Introduction | 
NAVIGATING NUMBERSApply your data analytics & visualization skills to advise a social media client on their content creation strategy as a Data Analyst at Accenture Data Free 73450+ 5 Star Reviews |
Why complete our Job Simulation | Why complete our Job SimulationA risk-free way to experience work on the job with us at Accenture North America. Practice your skills with example tasks and build your confidence to ace your applications. Self-paced 2-3 hours No grades No assessments Intermediate Accenture empowers you to be your best—personally and professionally. Every day around the world, we work with exceptional people, the latest and greatest tech and leading companies across industries. Deep dive into the evolving world of data from an analytics and visualization perspective with Navigating Numbers. Learn data basics such as data cleaning, modeling, visualization and storytelling. Upon completion, you’ll be equipped with data fundamentals and an understanding of what a career in data analytics could look like. All Accenture North America Job Simulations give you a taste of how together, we can create meaningful, powerful change. Bring your skills, your curiosity and your best true self! |
Skills you will learn and practice: | Skills you will learn and practice: Teamwork | Strategy | Project Planning | Data Understanding | Data Modeling | Data Analysis | Storytelling | Data Visualization | Presentations | Communication | Public Speaking |
How it works | How it worksComplete tasks guided by pre-recorded videos and example answers from our team at Accenture North America. No live sessions, all self-paced. Earn a certificate and add it to your resume and LinkedIn as an extra curricular activity. Stand out in applications. Confidently answer interview questions and explain why you’re a good fit for our team. |
Tasks in this program | Task One: Project Understanding<30 mins Introductory Quickly get up to speed with the business problem being addressed, project requirements and team alignment. What you'll learn - What are the responsibilities of a Data Analyst at Accenture
- What is a typical project team structure
- How to review a client project brief
What you'll do - Meet your Accenture team, including the industry, IPO and data experts
- Read and analyze a client project brief to understand the client and business problem, identify the requirements that need to be delivered, and identify which tasks you need to focus on as a data analyst
Task Two: Data Cleaning & Modeling30-60 mins Intermediate Modeling data to create valuable insights. What you'll learn - How to clean, model and analyze data to create valuable insights for the client
What you'll do - Identify which datasets will be required to answer the client’s business question
- Clean the datasets and merge them to prepare the data for analysis
- Determine the answer to the client’s business question
Task Three: Data Visualization & Storytelling30-60 mins Intermediate Bring your data to life and uncover insights for the business. What you'll learn - How to connect the business and the data, and how to communicate relevant and engaging insights in a presentation
What you'll do - Choose the data visualizations that best support the story you want to tell to the client
- Create a PowerPoint presentation that reports on the client’s content performance
Task Four: Present to the Client<30 mins Introductory It’s your time to shine by presenting your insights back to the client. What you'll learn - How to prepare for and present insights to a client in a presentation
What you'll do - Record a <10 minute video of your presentation to your client and internal team members
Finish LineCollect these achievements and tips to help you stand out in your job search. Interview Tips How to talk about this experience in your interviews. Resume Snippet A summary ready for your resume. |
|
|
Task One: |
|
1 Task Overview | Task OverviewWhat you'll learn- What are the responsibilities of a Data Analyst at Accenture
- What is a typical project team structure
- How to review a client project brief
What you'll do- Meet your Accenture team, including the industry, IPO and data experts
- Read and analyze a client project brief to understand the client and business problem, identify the requirements that need to be delivered, and identify which tasks you need to focus on as a data analyst
|
2 First up, why has Accenture built this program? | Task 1: Project Understanding First up, why has Accenture built this program?The recruitment team at Accenture has created this program to educate and identify great candidates. If you aren’t yet ready to apply to us, that’s okay! This program will help you to explore what the job involves and build your resume. So, how do you benefit? - You get relevant work experience taught by our team
- Add the program as a Certification to your Resume and LinkedIn
- Stand out in applications and interviews - talk about the job skills you've learned and why you're a good fit for the team.
And what does the Accenture Team see?
We have access to a dashboard to see who joins and completes our programs, and to contact you about upcoming opportunities - (only if you share your data with us of course!). By completing the program, you're showing us that you're a motivated student who's interested in Accenture, this is very important to us. Don't worry, this is not an assessment tool, this is a safe learning environment for you to build your skills. So, let's get started with the program! |
3 Before we begin… | Before we begin…Here are some key facts about this program: - You are working as a Data Analyst at Accenture.
- You work within a larger team, where each member has a different role and level of responsibility.
- Your team has been assigned a new project for a client called Social Buzz.
- You’re hoping for a promotion at work, and this is an exciting opportunity for you to showcase your data analysis and visualization skills.
Let's get started! |
4 Key roles and responsibilities of a Data Analyst | Key roles and responsibilities of a Data AnalystA data analyst sits between the business and the data. What do we mean by that? - The Business refers to the client and your internal team members who won’t be involved in detailed data analysis.
- They rely on your analysis to make strategic business decisions.
- Importantly, not everyone will have a strong understanding of data. Your job is to communicate your data findings simply and clearly for everyone to understand.
- The Data refers to the relevant data sources that you will clean, process, and use to generate interesting insights for the business.
As a Data Analyst at Accenture, you’ll get to work across a range of different clients and projects. This keeps things interesting, as there are always new problems to solve and new topics to learn about.
However, our clients often want accurate results in a tight timeframe. The pace of work is fast and you’ll need to get up to speed on new projects as quickly as possible. Now you know a bit more about the role, let’s get back to the project with Social Buzz. |
|
5 Read the brief from Social Buzz | Read the brief from Social BuzzYour first task is to read the brief from Social Buzz and complete a short knowledge check before the call. One of Accenture’s Managing Directors, Mae Mulligan, is the client lead for Social Buzz. She has reviewed the brief provided by Social Buzz and has assembled a diverse team of Accenture experts to deliver the project. Mae has scheduled a project kick off call with the internal Accenture project team for tomorrow morning. Ahead of the call, Mae has shared the project brief so you can get up to speed on what Social Buzz need help with. Read the brief to: - Understand the client and business problem at hand.
- Identify the requirements that need to be delivered for this project.
- Identify which tasks you should focus on as a Data Analyst.
Complete the knowledge check to move onto the next step. You can attempt each question in the knowledge check as many times as you like!

Brief from Social Buzz Click to download file → Here are some resources to help youHere are some key terms if you're curious: Note: You don’t need to know anything more about Big Data or IPOs for this program. Big Data refers to large, diverse sets of information that grow at ever-increasing rates. It includes the volume of information, the velocity or speed at which it is created and collected, and the variety or scope of the data points being covered (known as the "three v's" of big data). Source: Investopedia. An IPO stands for Initial Public Offering - this happens when a private company becomes public by selling its shares on a stock exchange. Source: Investopedia. |
Client name: Social Buzz
Client industry: Social media & content creation
Year established: 2010
Location of HQ: San Francisco
Number of employees: 250
Client background: Social Buzz was founded by two former engineers from a large social media conglomerate, one from London and the other from San Francisco. They left in 2008 and both met in San Francisco to start their business. They started Social Buzz because they saw an opportunity to build on the foundation that their previous company started by creating a new platform where content took center stage. Social Buzz emphasizes content by keeping all users anonymous, only tracking user reactions on every piece of content. There are over 100 ways that users can react to content, spanning beyond the traditional reactions of likes, dislikes, and comments. This ensures that trending content, as opposed to individual users, is at the forefront of user feeds.
Over the past 5 years, Social Buzz has reached over 500 million active users each month. They have scaled quicker than anticipated and need the help of an advisory firm to oversee their scaling process effectively.
Due to their rapid growth and digital nature of their core product, the amount of data that they create, collect and must analyze is huge. Every day over 100,000 pieces of content, ranging from text, images, videos and GIFs are posted. All of this data is highly unstructured and requires extremely sophisticated and expensive technology to manage and maintain. Out of the 250 people working at Social Buzz, 200 of them are technical staff working on maintaining this highly complex technology.
Up until this point, they have not relied on any third party firms to help them get to where they are. However there are 3 main reasons why they are now looking at bringing in external expertise:
1) They are looking to complete an IPO by the end of next year and need guidance to ensure that this goes smoothly. 2) They are still a small company and do not have the resources to manage the scale that they are currently at. They could hire more people, but they want an experienced practice to help instead. 3) They want to learn data best practices from a large corporation. Due to the nature of their business, they have a massive amount of data so they are keen on understanding how the world's biggest companies manage the challenges of big data.
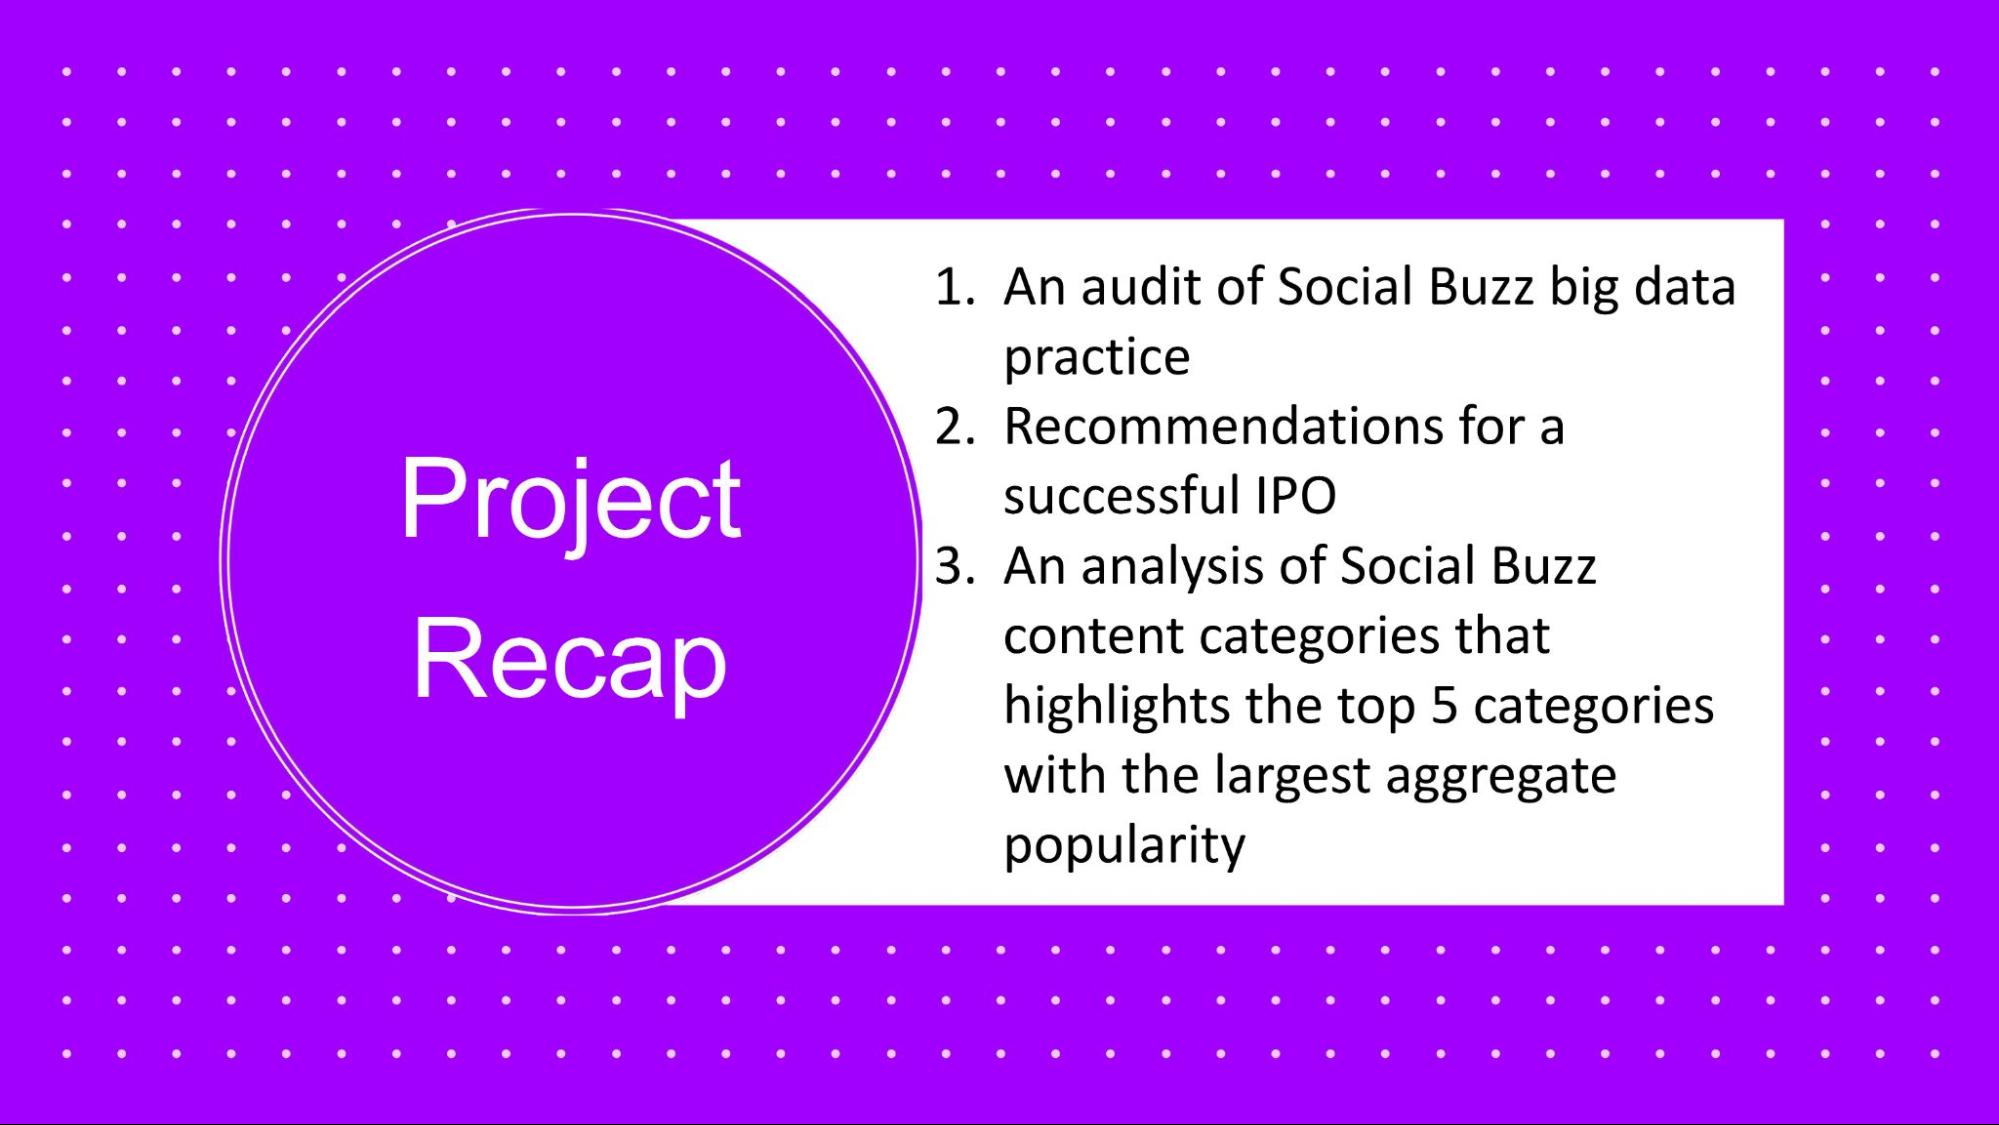
To start our engagement with Social Buzz, we are running a 3 month initial project in order to prove to them that we are the best firm to work with. They are expecting the following: - An audit of their big data practice - Recommendations for a successful IPO - An analysis of their content categories that highlights the top 5 categories with the largest aggregate popularity
Tasks to be delegated: - Creation of an up-to-date big data best practices presentation - Extraction of sample data sets using SQL - On-site audit of their data-center - Merging of sample data set tables - Virtual session with Social Buzz team to present previous client success stories relevant to them - Preparation of best practice document for IPO - Loading of sample data sets into Accenture sandbox database - Technology architecture workshop with Social Buzz Data Team to understand their technology landscape - Stress testing of their technology to identify weak spots - Communication with previous IPO companies within our client base for reference stories - Analysis of sample data sets with visualizations - Full documentation of the process that we can guide them through for IPO |
6 Question | Question 1 of 2 Which statement best describes the business problem that Accenture is tasked to address for this project?The clients financial stability has rapidly declined due to COVID-19 and they need to find new market opportunities to increase revenue. The client is looking to raise a significant amount of money through private investment and needs support with this. The client has reached a massive scale within recent years and does not have the resources internally to handle it. The client has reached a massive scale within recent years and is having big issues retaining and hiring the best talent. The client needs help to find out why this problem has arisen.
Great Work! Well done! Spot on, the client stated that scale was a big problem of theirs and they are struggling to manage the scale with the resources that they currently have. The brief said that the client is looking for help with the management of their journey into such a large scale.
Question 2 of 2 Which statement lists the three requirements that Accenture is tasked to fulfill for this project?Audit of financial history, IPO recommendations, analysis of popular content Big data analytics, recommendations for recruitment, analysis of popular content Audit of big data practice, recommendations for IPO, analysis of market opportunities Audit of big data practice, recommendations for IPO, analysis of popular content
Great Work! Correct! Spot on! These 3 requirements are the exact requirements that the client is expecting! |
7 Meet your Accenture team | Meet your Accenture teamGreat work reading and interpreting the brief from Social Buzz. You’re now ready for your internal meeting with Mae. So, let’s jump on the call and see who you’re going to be working with, then answer one quick question to move onto your next task!
If you can't access the video, please use the resources below. 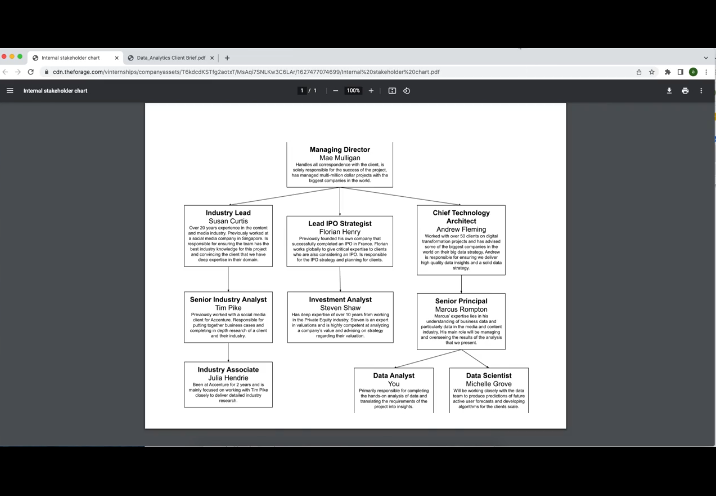
Here are some resources to help youCan’t access the video? See the summary slide of your team here. Notice how the team is structured in three key groups: - Industry experts in the social media space to ensure we accurately understand Social Buzz’s sector.
- IPO experts who will deliver on the IPO requirement
- Data experts who will provide Big Data insights and content category analysis. This is where you sit!
Accenture Project Team Click to download file → Internal stakeholder chart 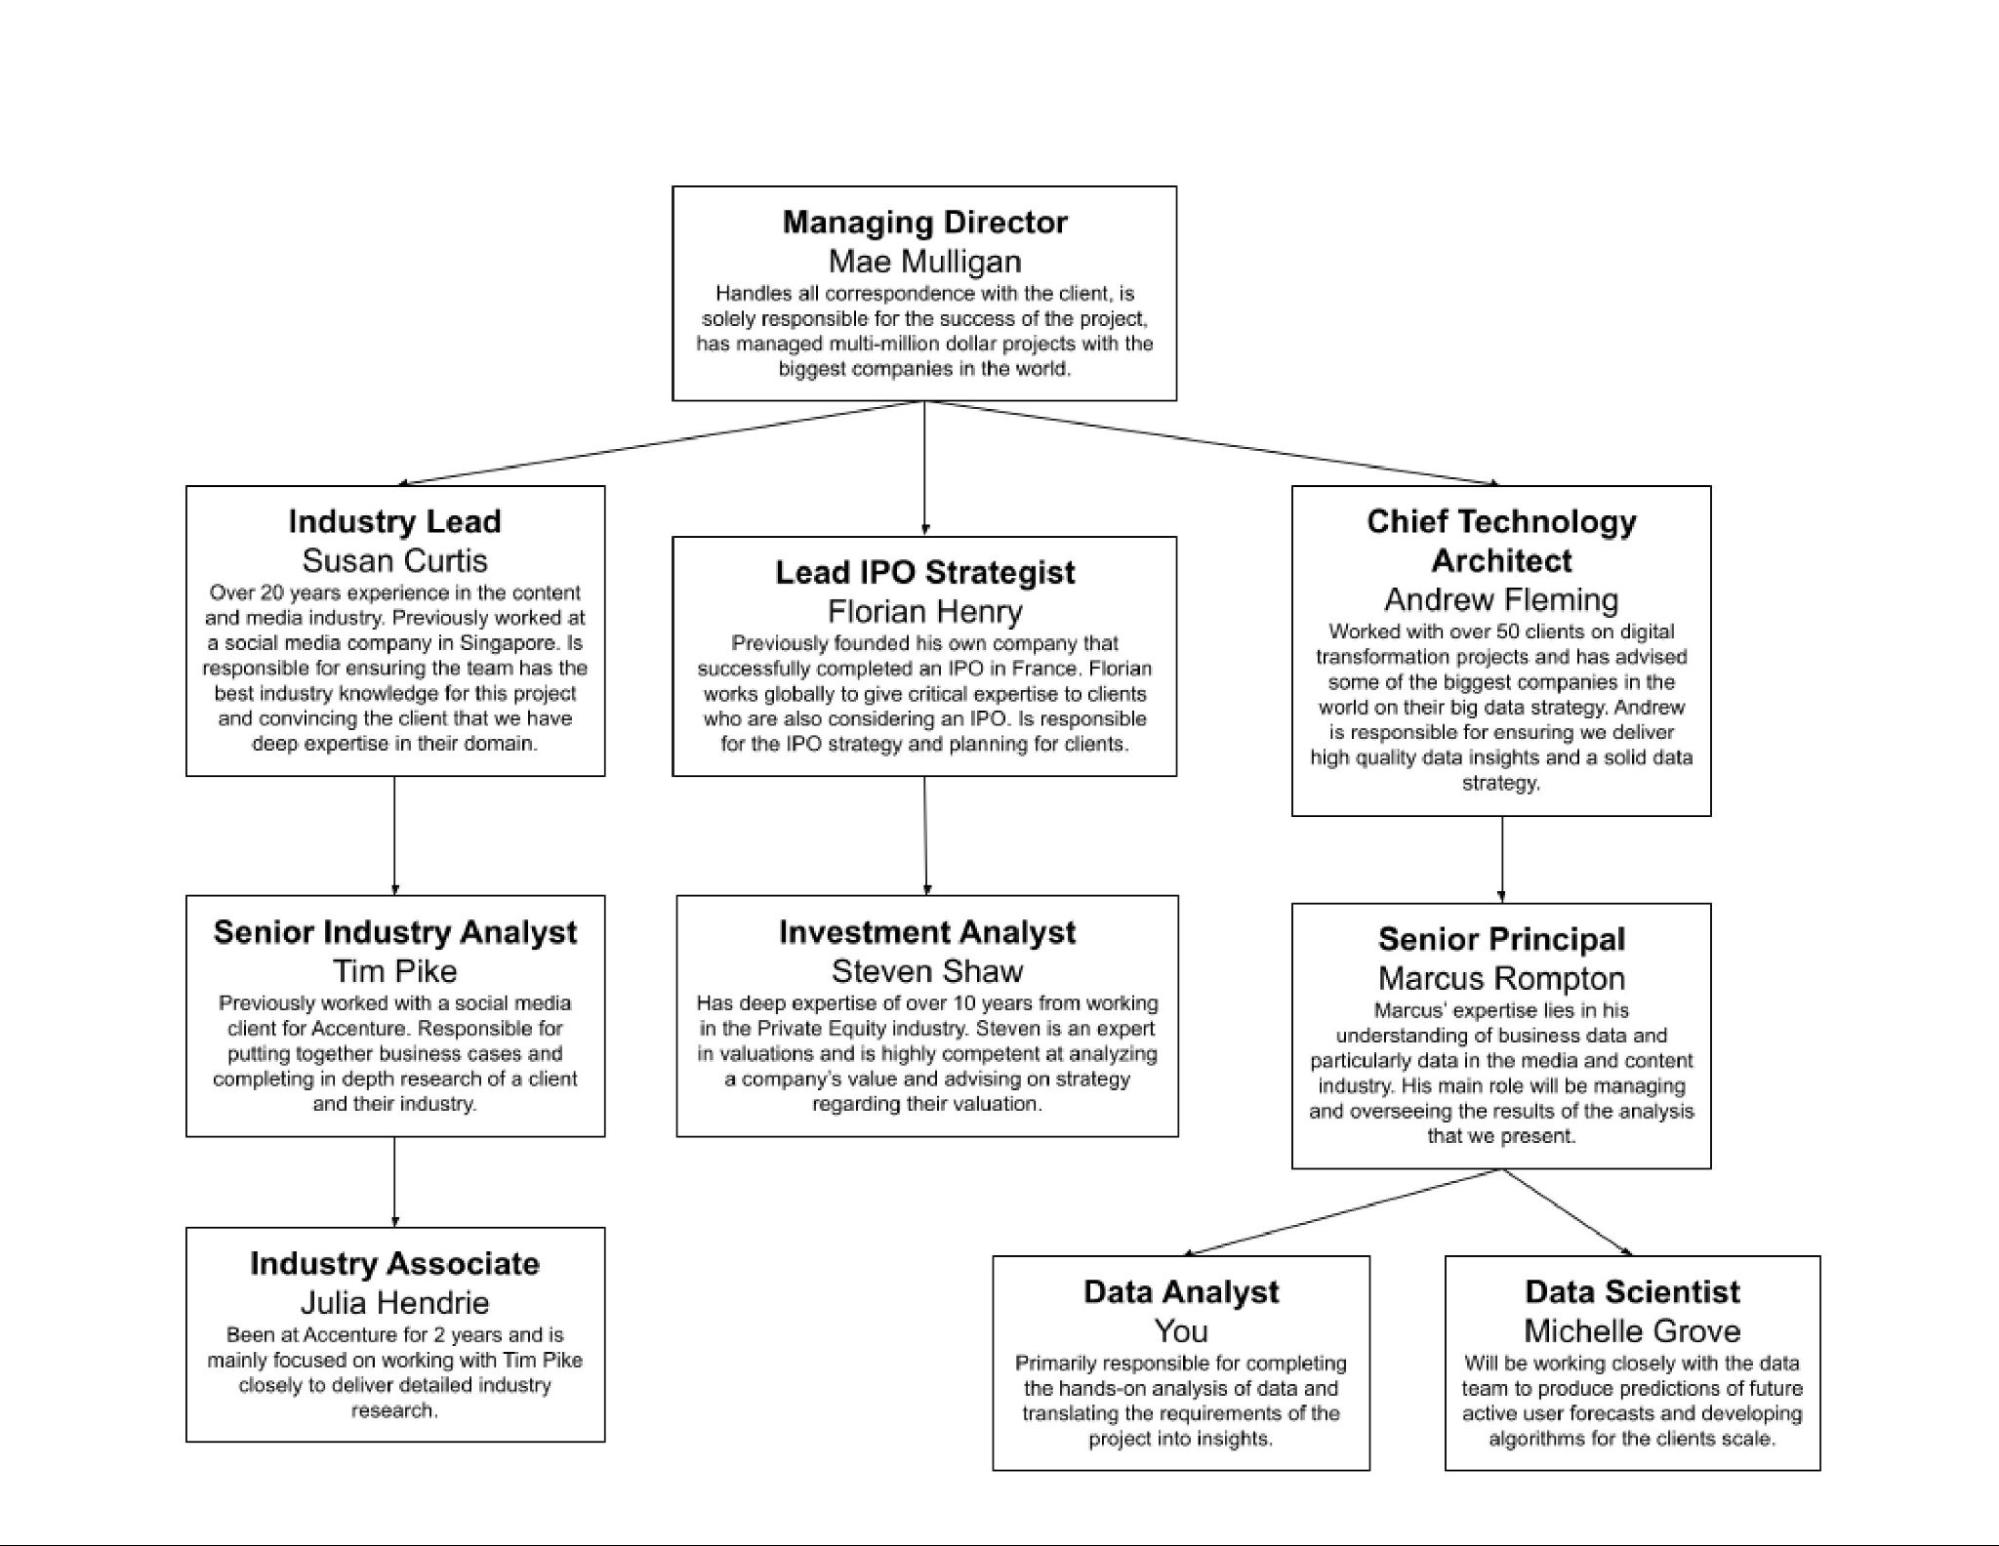
|
8 Question | Question 1 of 1 Which task out of these options is the most relevant to you as a data analyst, and therefore which one will you work on?On-site audit of their data-center Preparation of best practice document for IPO Analysis of sample data sets with visualizations to understand the popularity of different content categories Stress testing of their technology to identify weak spots
Great Work! Correct! This is exactly the task a data analyst would be focusing on and this is what you will be working on! |
9 Completion | 
|
|
|
Task Two: |
|
1 Task Overview | Task 2: Data Cleaning & ModelingTask OverviewWhat you'll learn- How to clean, model and analyze data to create valuable insights for the client
What you'll do- Identify which datasets will be required to answer the client’s business question
- Clean the datasets and merge them to prepare the data for analysis
- Determine the answer to the client’s business question
|
2 Let's dive into the data | Let's dive into the dataNow you have a good understanding of the project and your role - it’s time to get to work! Don’t worry if you haven’t done data analysis before, we’ll take you through each step and provide support along the way. So, let’s have a look at what data you have to work with. The client has sent through: - 7 data sets - each data set contains different columns and values
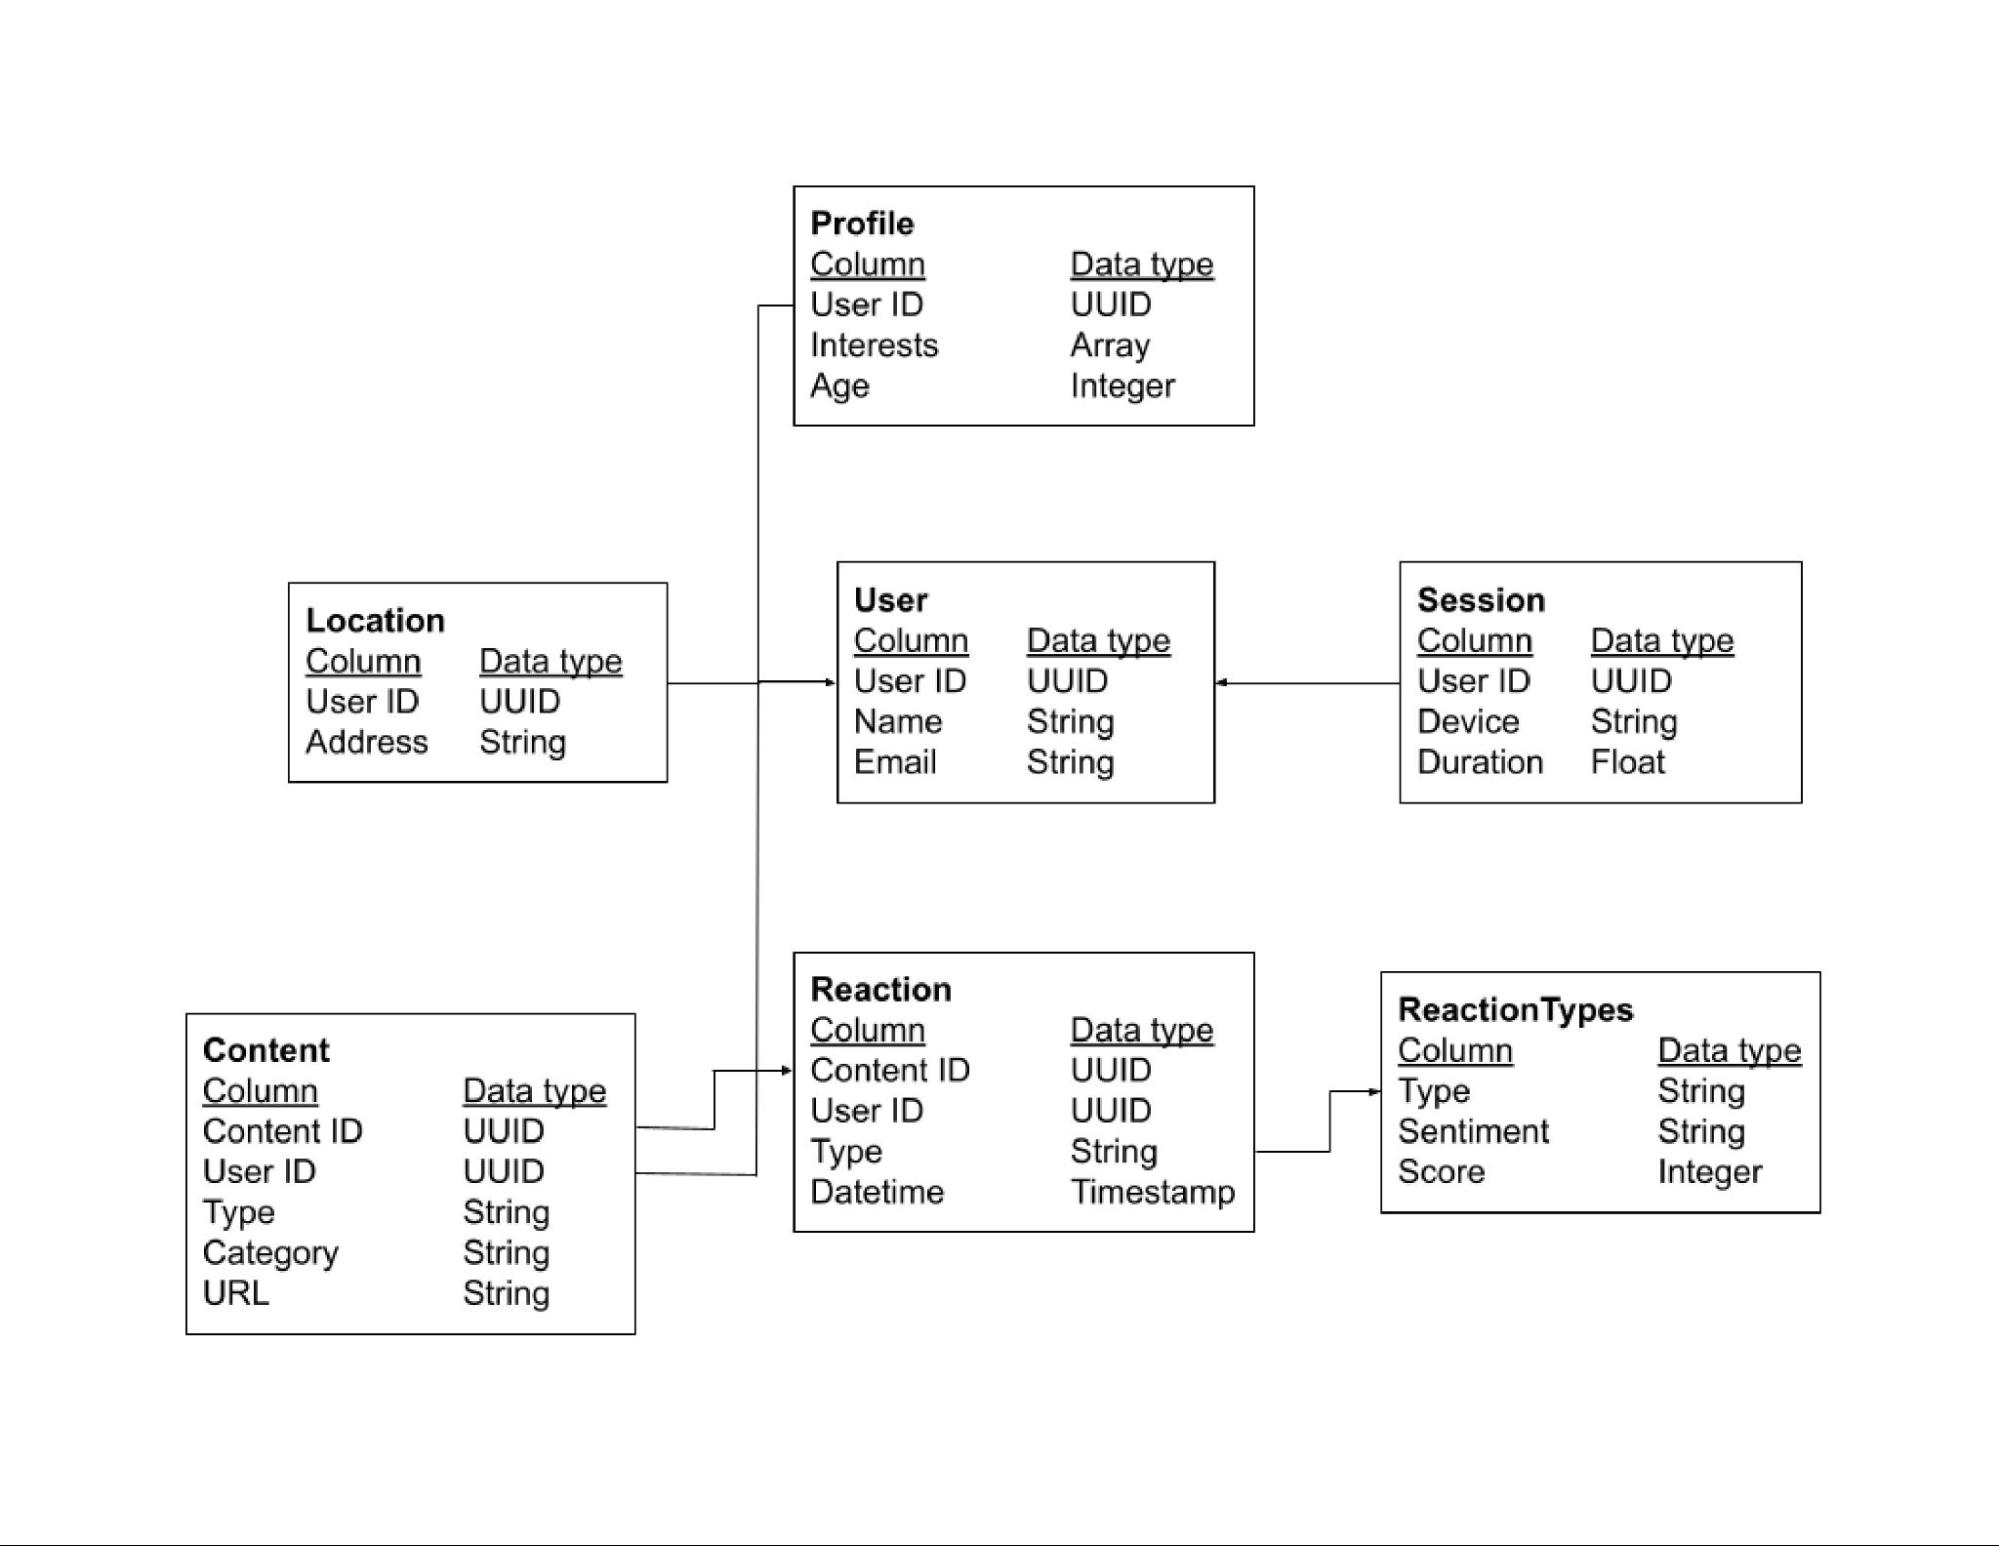
- A data model - this shows the relationships between all of the data sets, as well as any links that you can use to merge tables.
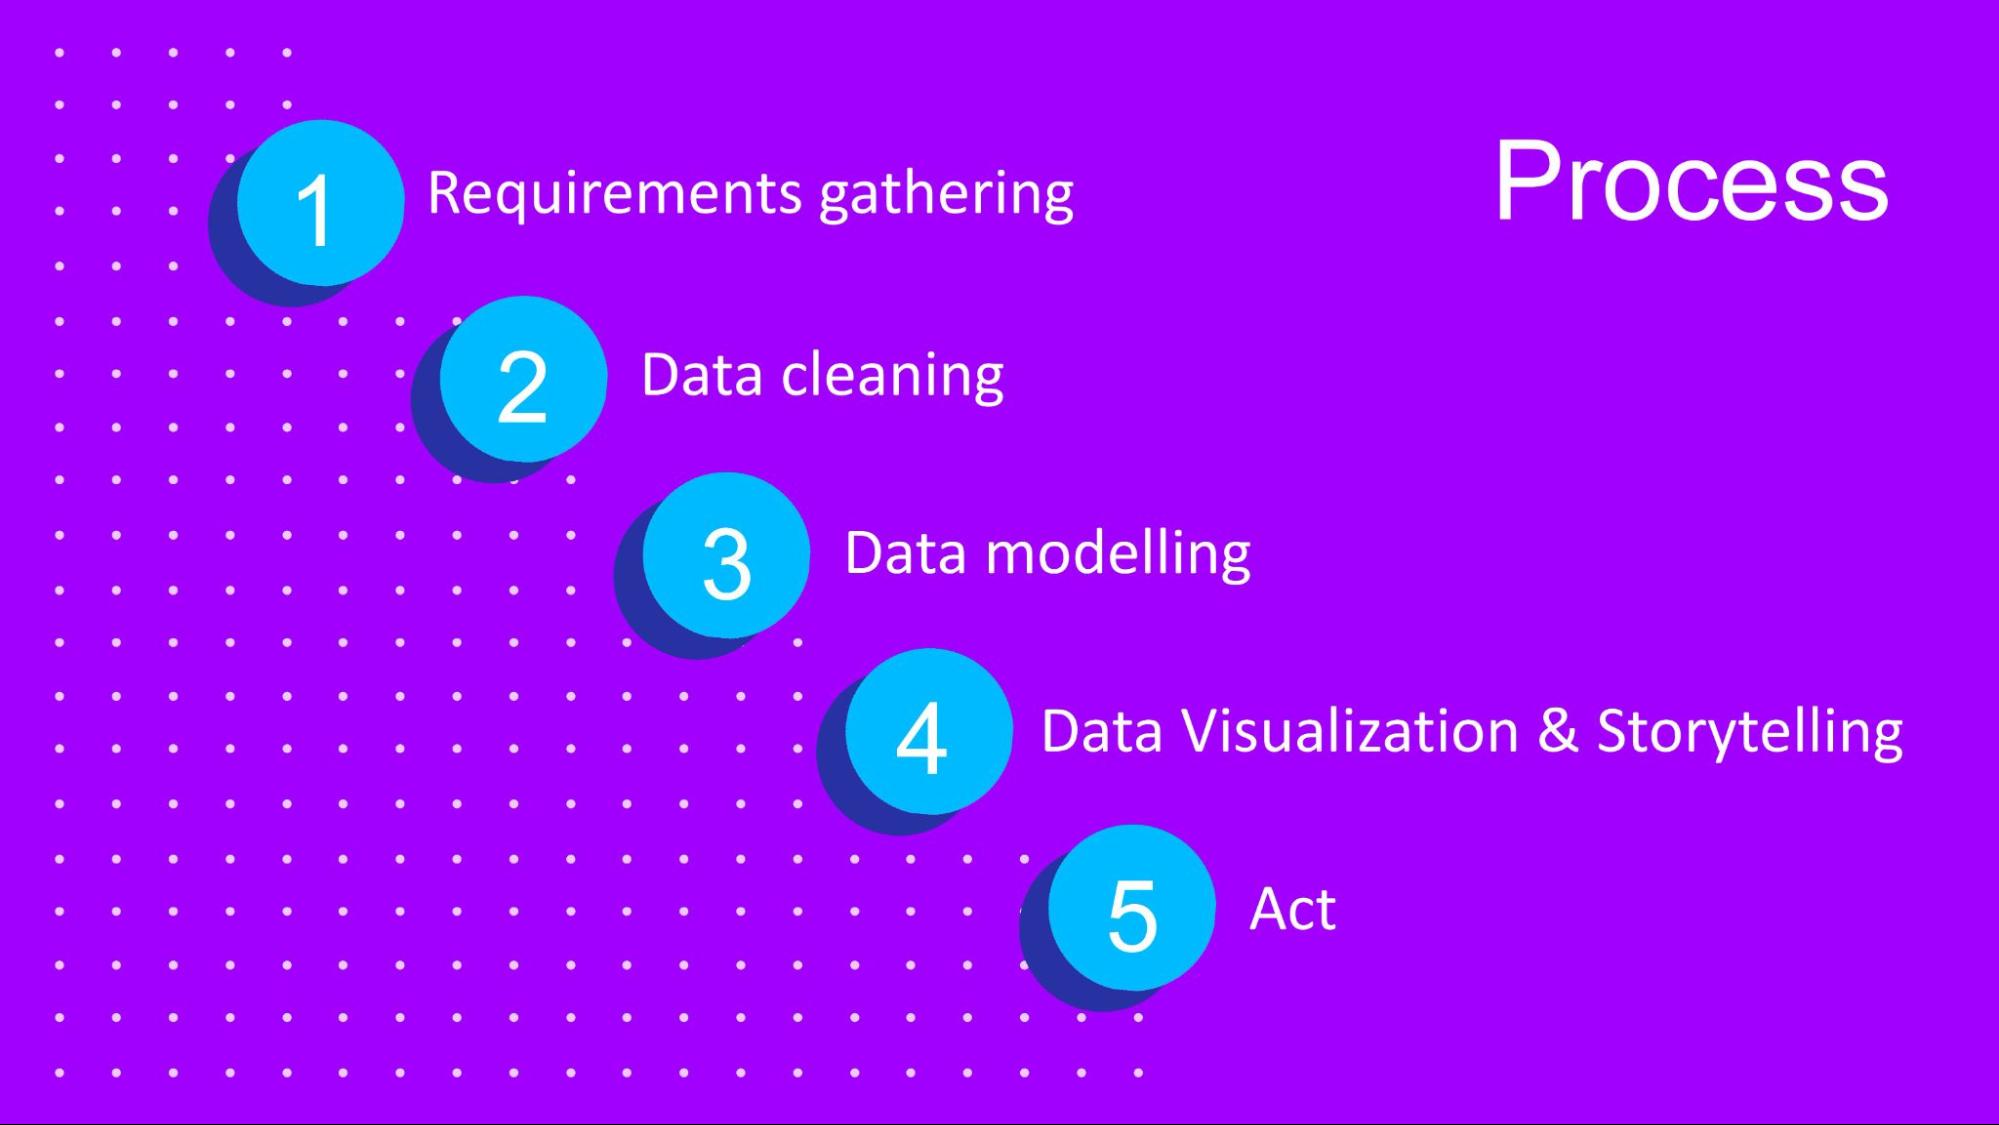
There is a lot of information here and it’s easy to get lost in the data. So, to make sure you are using the right data to answer the business questions you’ll follow these steps: - Requirements gathering
- Data cleaning
- Data modelling
|
3 First up, requirements gathering | First up, requirements gatheringAs we mentioned, you have been sent 7 datasets and a data model. Often you won’t need all these datasets to find what you’re looking for. So, the first step is to use this data model to identify which datasets will be required to answer your business question - which is to to figure out the top 5 categories with the largest popularity. When you think you’ve identified the right data sets to include, complete the multi choice quiz to move onto the next step.
Data Model Click to download file → Here are some resources to help youHow do you interpret a data model? 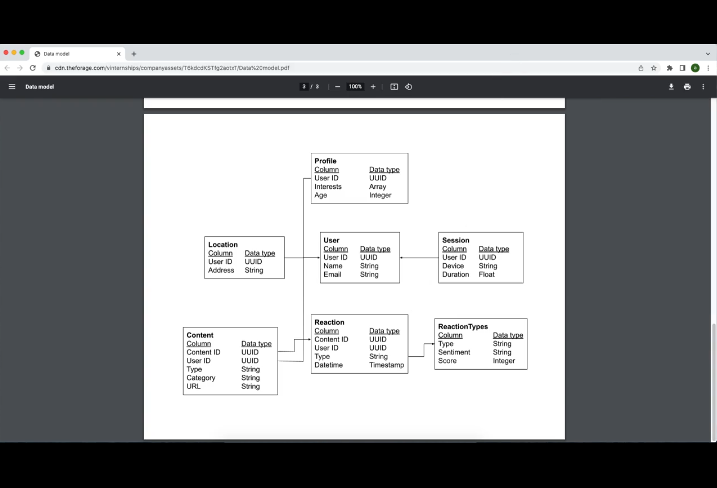 Definitions of different data types: - String - Sequence of characters, digits, or symbols—always treated as text
- UUID - Universally Unique Identifiers
- Array - List with a number of elements in a specific order—typically of the same type
- Integer - Numeric data type for numbers without fractions
- Timestamp - Number of seconds that have elapsed since midnight (00:00:00 UTC), 1st January 1970 (Unix time)
Source: Direct extract from Amplitude
User ID: Unique ID of the user (automatically generated) Name: Full name of user Email: Email address of user Profile User ID: Unique ID of a user that exists in the User table Interests: Interests of the associated user Age: Age of the associated user Location User ID: Unique ID of a user that exists in the User table Address: Full address of the user Session User ID: Unique ID of a user that exists in the User table Device: Mobile device that they used for this session on the application Duration: Amount of time in minutes that this user stayed active on the application during this session Content ID: Unique ID of the content that was uploaded (automatically generated) User ID: Unique ID of a user that exists in the User table Type: A string detailing the type of content that was uploaded Category: A string detailing the category that this content is relevant to URL: Link to the location where this content is stored Reaction Content ID: Unique ID of a piece of content that was uploaded User ID: Unique ID of a user that exists in the User table who reacted to this piece of content Type: A string detailing the type of reaction this user gave Datetime: The date and time of this reaction ReactionTypes Type: A string detailing the type of reaction this user gave "Sentiment: A string detailing whether this type of reaction is considered as positive, negative or neutral" Score: This is a number calculated by Social Buzz that quantifies how “popular” each reaction is. A reaction type with a higher score should be considered as a more popular reaction.
|
4 Question | Question 1 of 1 Which three data sets will you need to complete your analysis?Reaction, Content, Reaction Types Reaction, Content, Profile Reaction, Reaction Type, User Great Work! Great work! Your job is to identify which content categories are most popular. Popularity is determined based on reaction scores. |
5 Data sets - Quick Explanation | Data sets - Quick ExplanationGreat work! You’ve identified Reaction, Content, and Reaction Types as our relevant data sets. To clarify why you made this selection: - The brief carefully it states that the client wanted to see “An analysis of their content categories showing the top 5 categories with the largest popularity”.
- As explained in the data model, popularity is quantified by the “Score” given to each reaction type.
- We therefore need data showing the content ID, category, content type, reaction type, and reaction score.
- So, to figure out popularity, we’ll have to add up which content categories have the largest score.
But! Before we begin to work with the data sets, we’ll need to ensure that the data is clean and ready for analysis…
|
6 Data Cleaning | Data CleaningData cleaning is a common and very important task when working with data. What you need to do: First: Open the three data sets below 
Reaction Types Click to download file →
Reactions Click to download file →
Content Click to download file → Second: Clean the data by: - removing rows that have values which are missing,
- changing the data type of some values within a column, and
- removing columns which are not relevant to this task.
- Think about how each column might be relevant to the business question you’re investigating. If you can’t think of why a column may be useful, it may not be worth including it.
Your end result should be three cleaned data sets.
If you get stuck, we’ll provide some guidance in the next step. But we encourage you to give it a go first! |
7 Quick explanation - how to clean the data set | Quick explanation - how to clean the data setNice work cleaning the data. If you got stuck, here is a quick video on how to clean your data set. Once you’re ready move onto the next step. 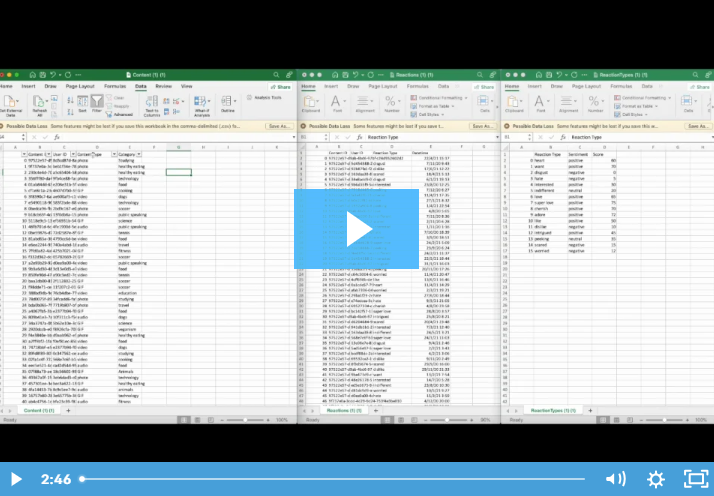
|
8 Data Modelling | Data ModellingOkay, we’re nearly there! You’re doing a great job. Now we want to figure out the top 5 categories. To complete your data modelling, follow these steps: 1. Create a final data set by merging your three tables together - We recommend using the Reaction table as your base table, then first join the relevant columns from your Content data set, and then the Reaction Types data set.
- Hint: You can use a “VLookUp” formula
2. Figure out the Top 5 performing categories - Add up the total scores for each category.
- Hint: You can use the “Sum If” formula
The end result should be one spreadsheet which contains:
- A cleaned dataset
- The top 5 categories
Once you have a final data file, upload it to complete this task! We'll provide you with some explanation videos in the next step - but first give it a go to see if you can figure it out. You can use Excel or any other tool of your choice to create your final data set. Upload your clean data file 
|
9 Quick Explanation - Data Modelling | Quick Explanation - Data ModellingGreat work! If you want to check that your data is right - here are two videos showing how you could have completed it. Here is a video on how to merge your data: 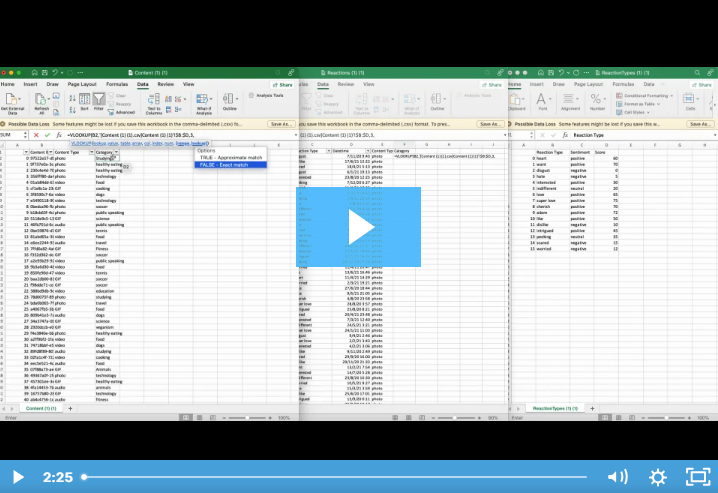
Here is a video on how to figure out the top categories: 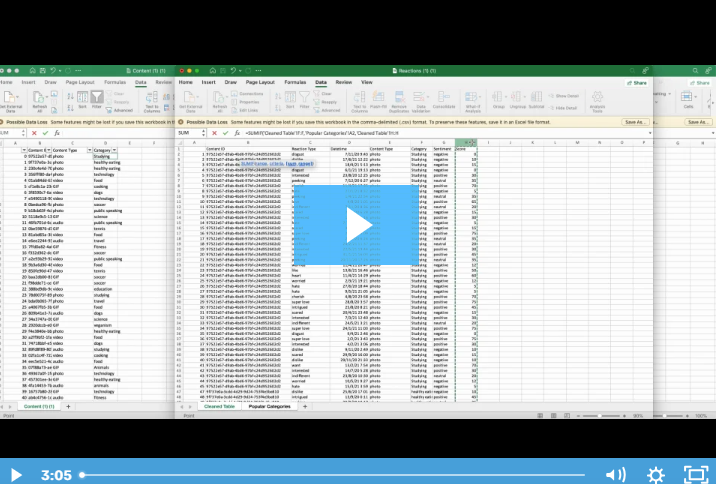
|
10 Completion | 
|
|
|
Task Three: |
|
1 Task Overview | Task 3: Data Visualization & StorytellingTask OverviewWhat you'll learn- How to connect the business and the data, and how to communicate relevant and engaging insights in a presentation
What you'll do- Choose the data visualizations that best support the story you want to tell to the client
- Create a PowerPoint presentation that reports on the client’s content performance
|
2 Build your presentation Structure | Build your presentation StructureImportantly, before you start creating your data charts, you should plan your presentation structure. This will ensure your presentation answers the right questions. Here is a template that we would use at Accenture to create a presentation. You need to download this template and populate slides 2-6. 
Accenture Presentation Template Click to download file →
For each slide, think about:
- Agenda - What will your presentation cover?
- Project Recap - What are the key points from the brief?
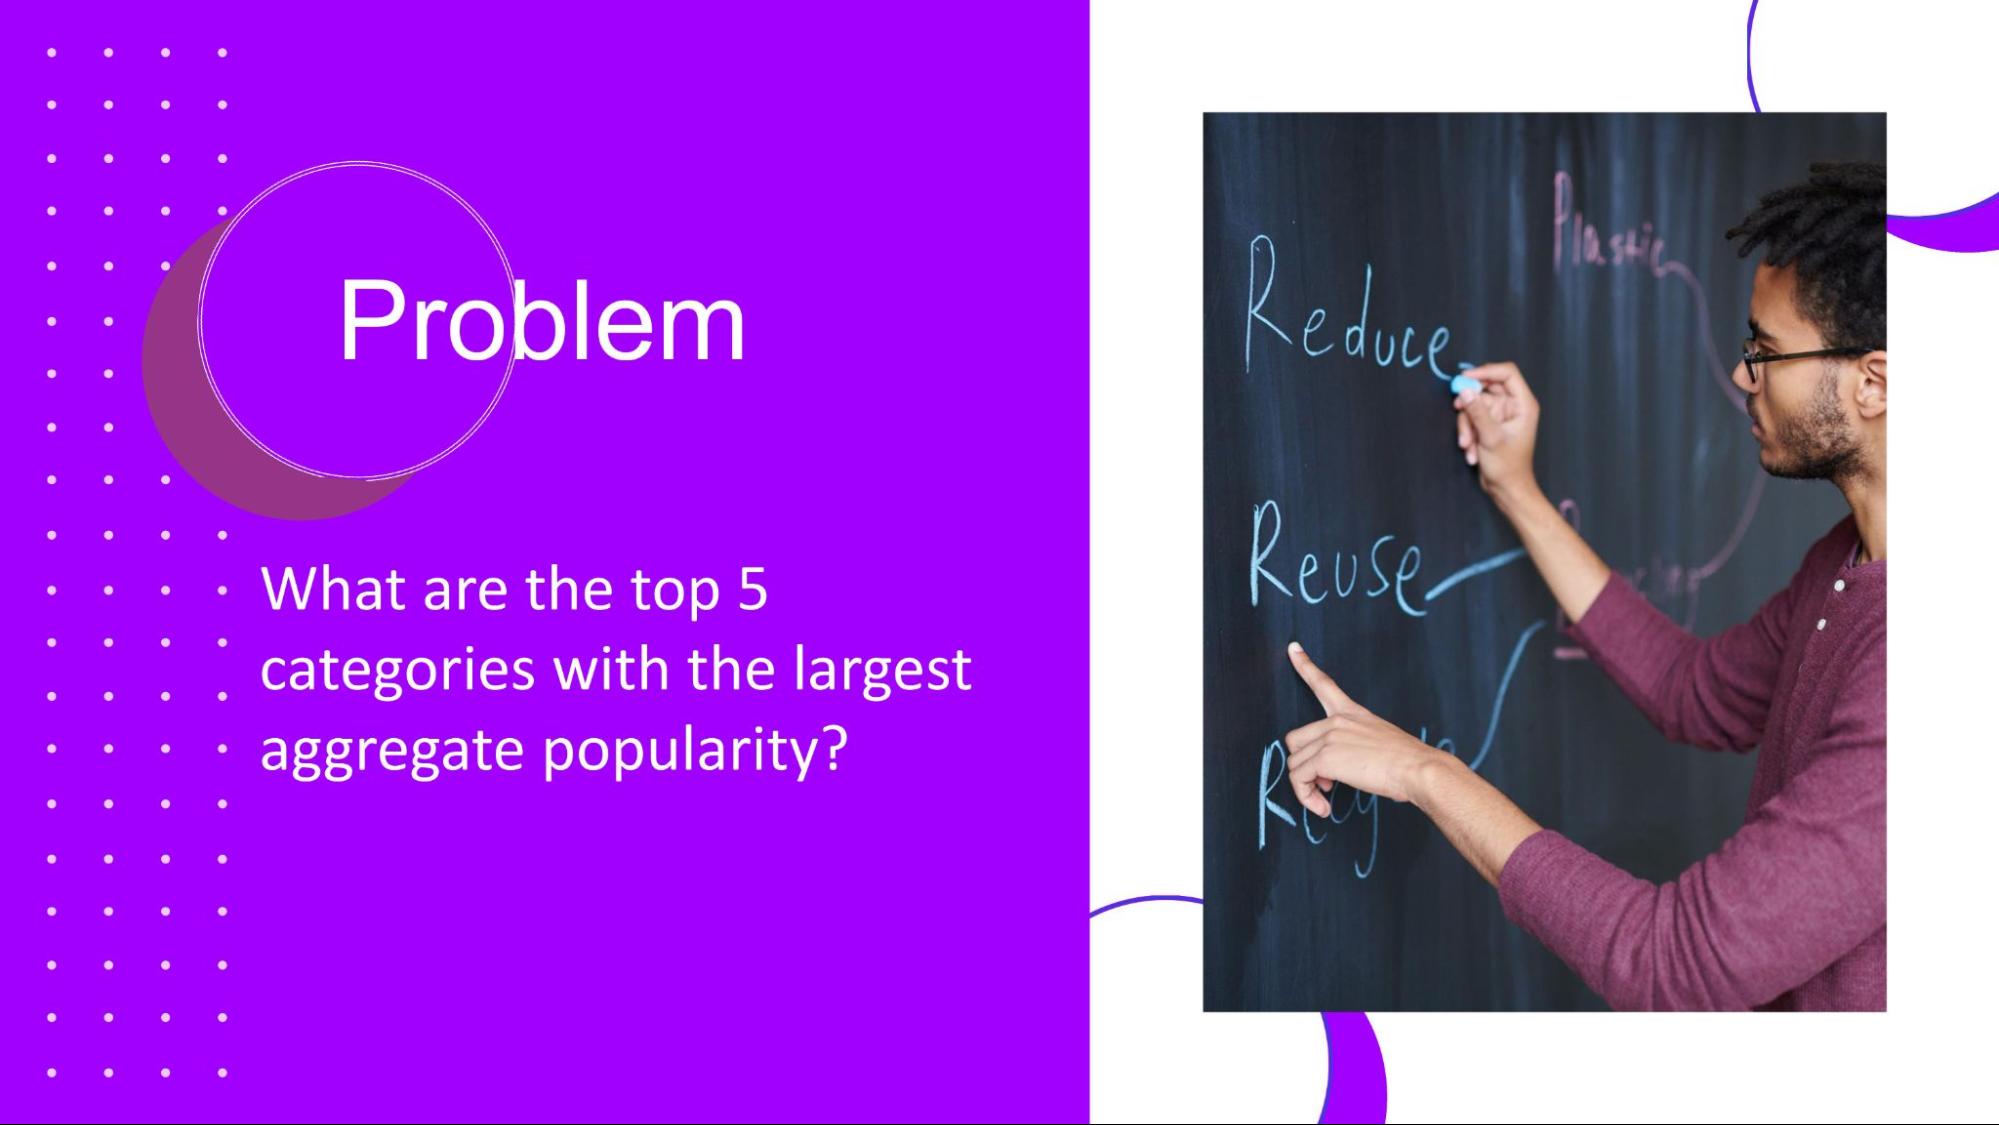
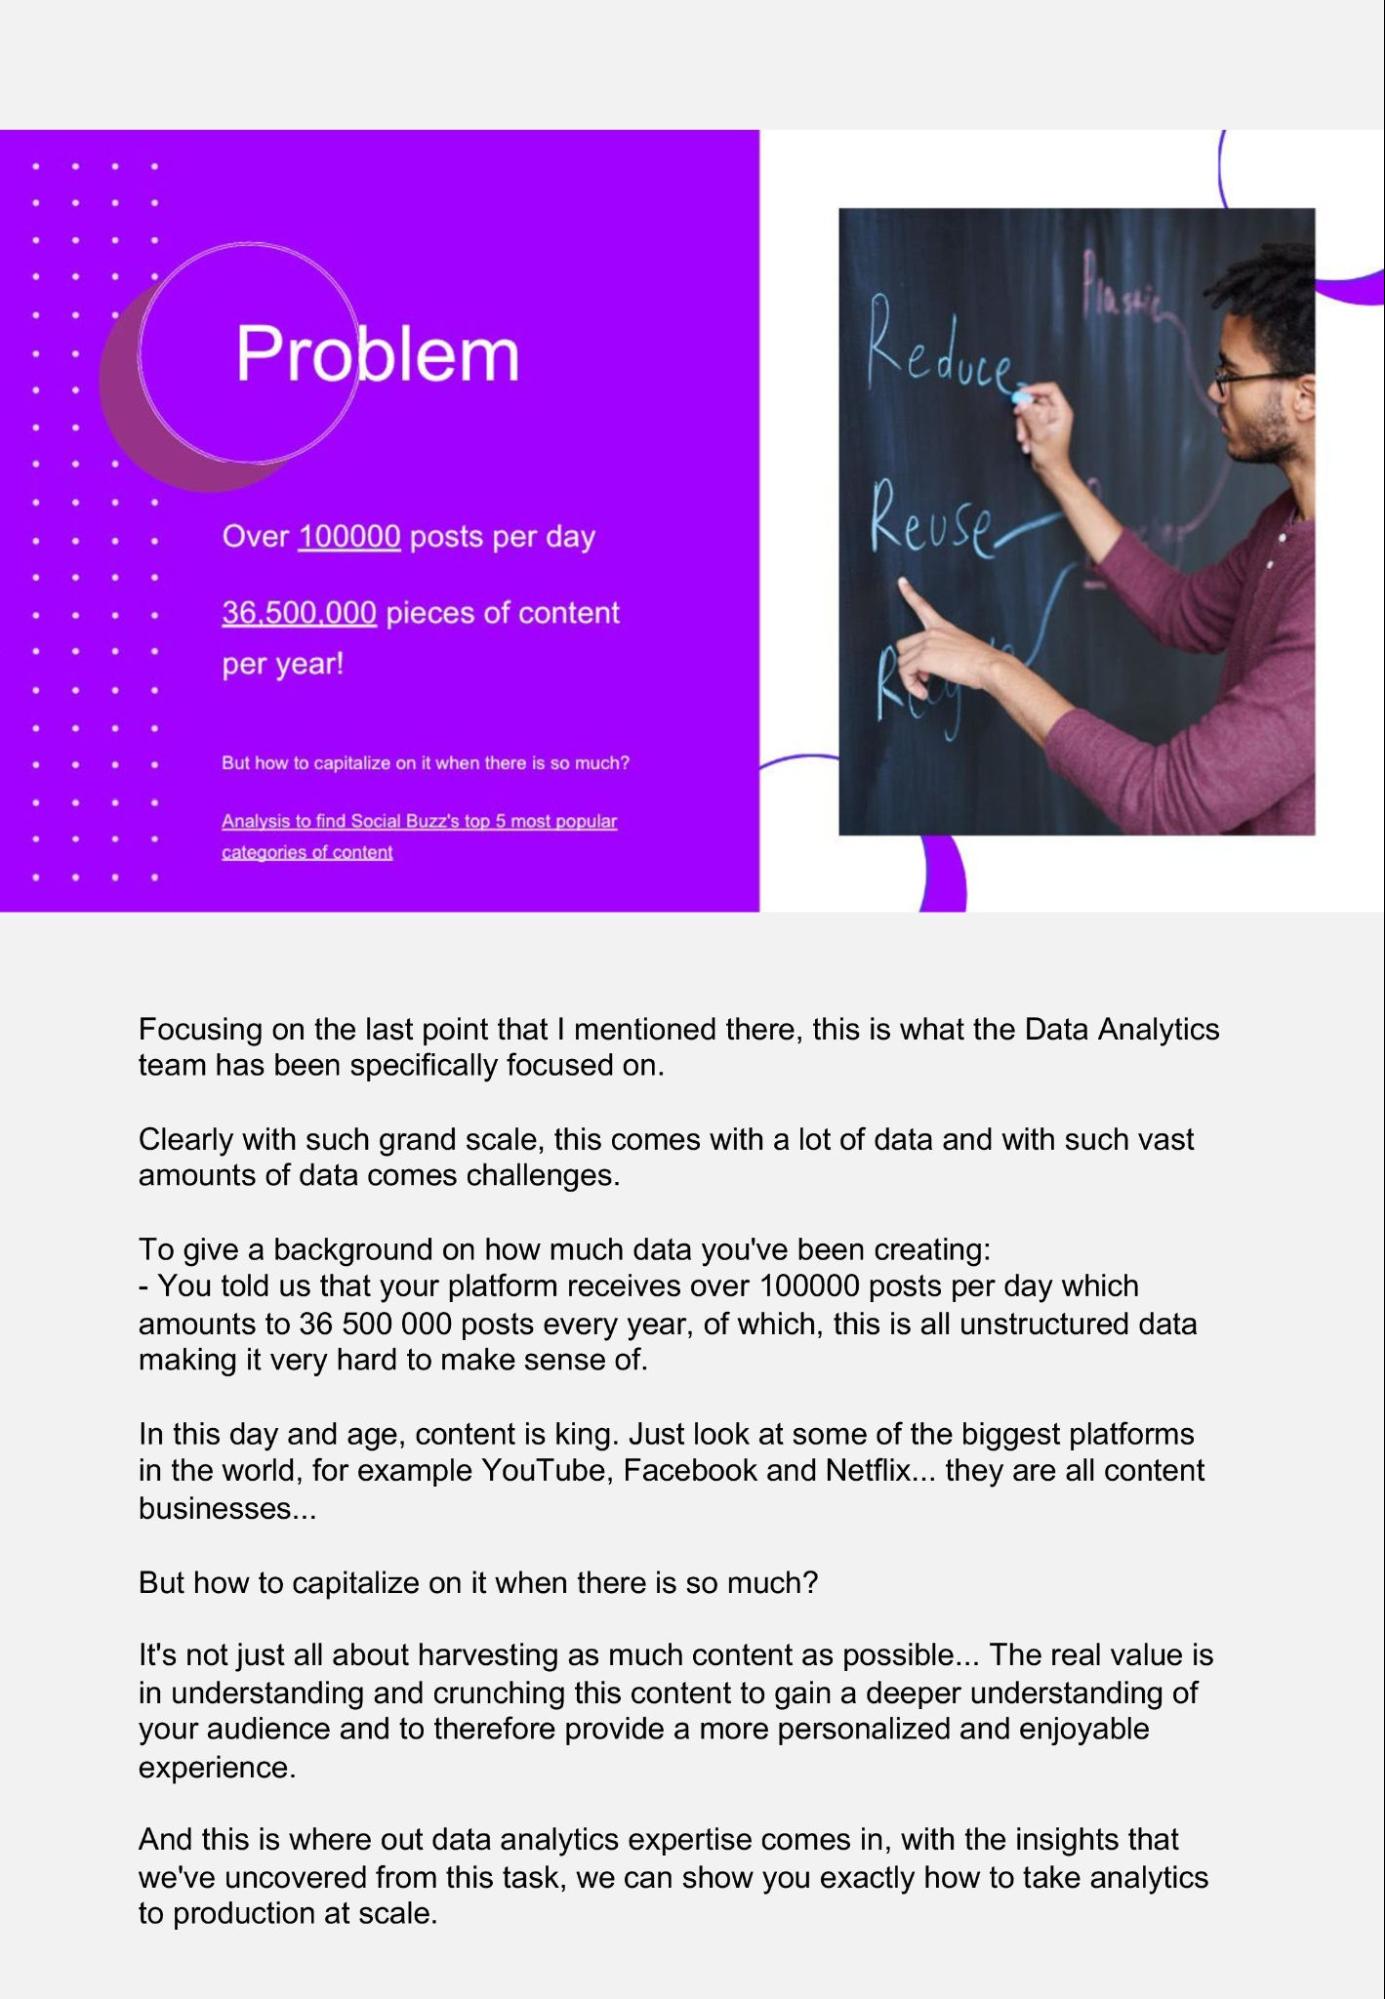
- Problem - What is the problem that you answer in this presentation?
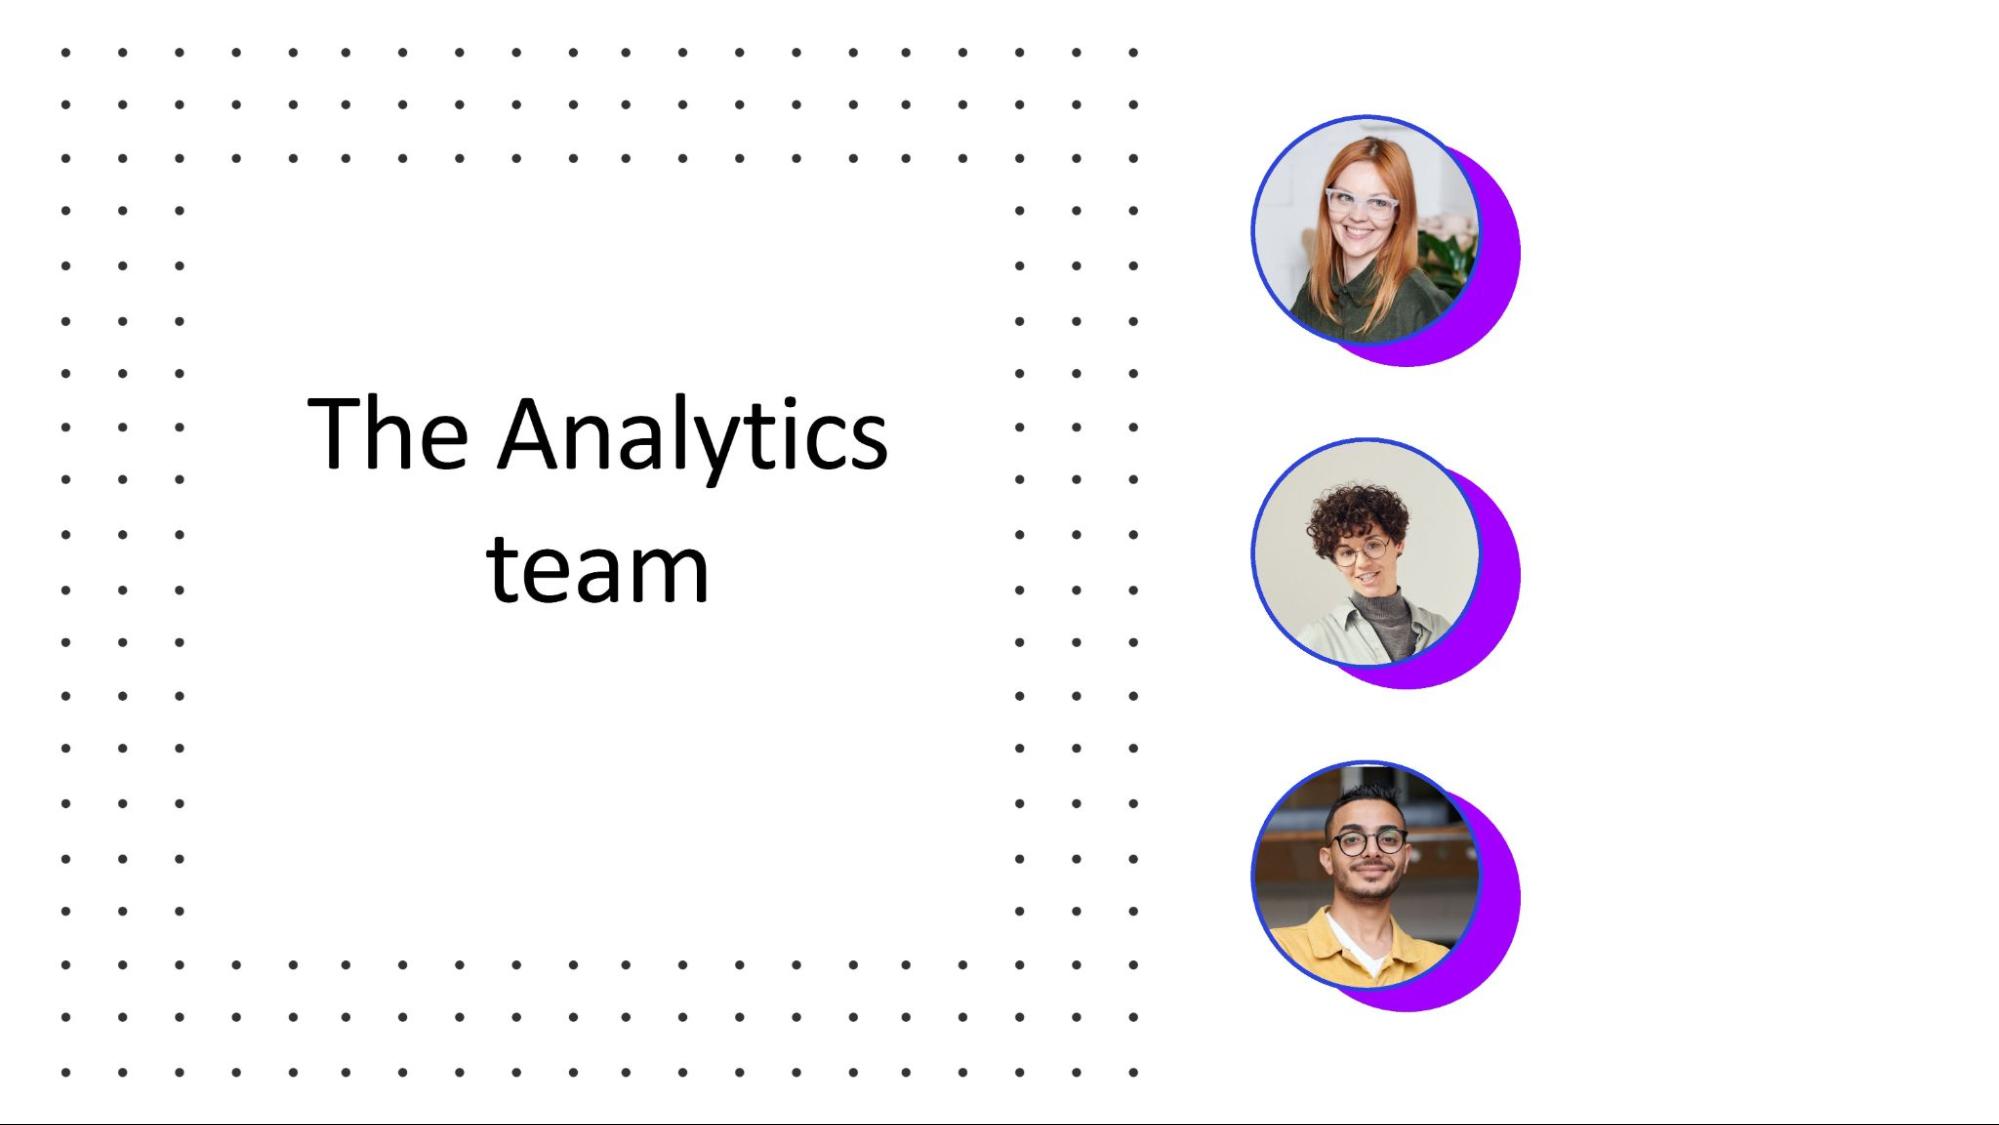
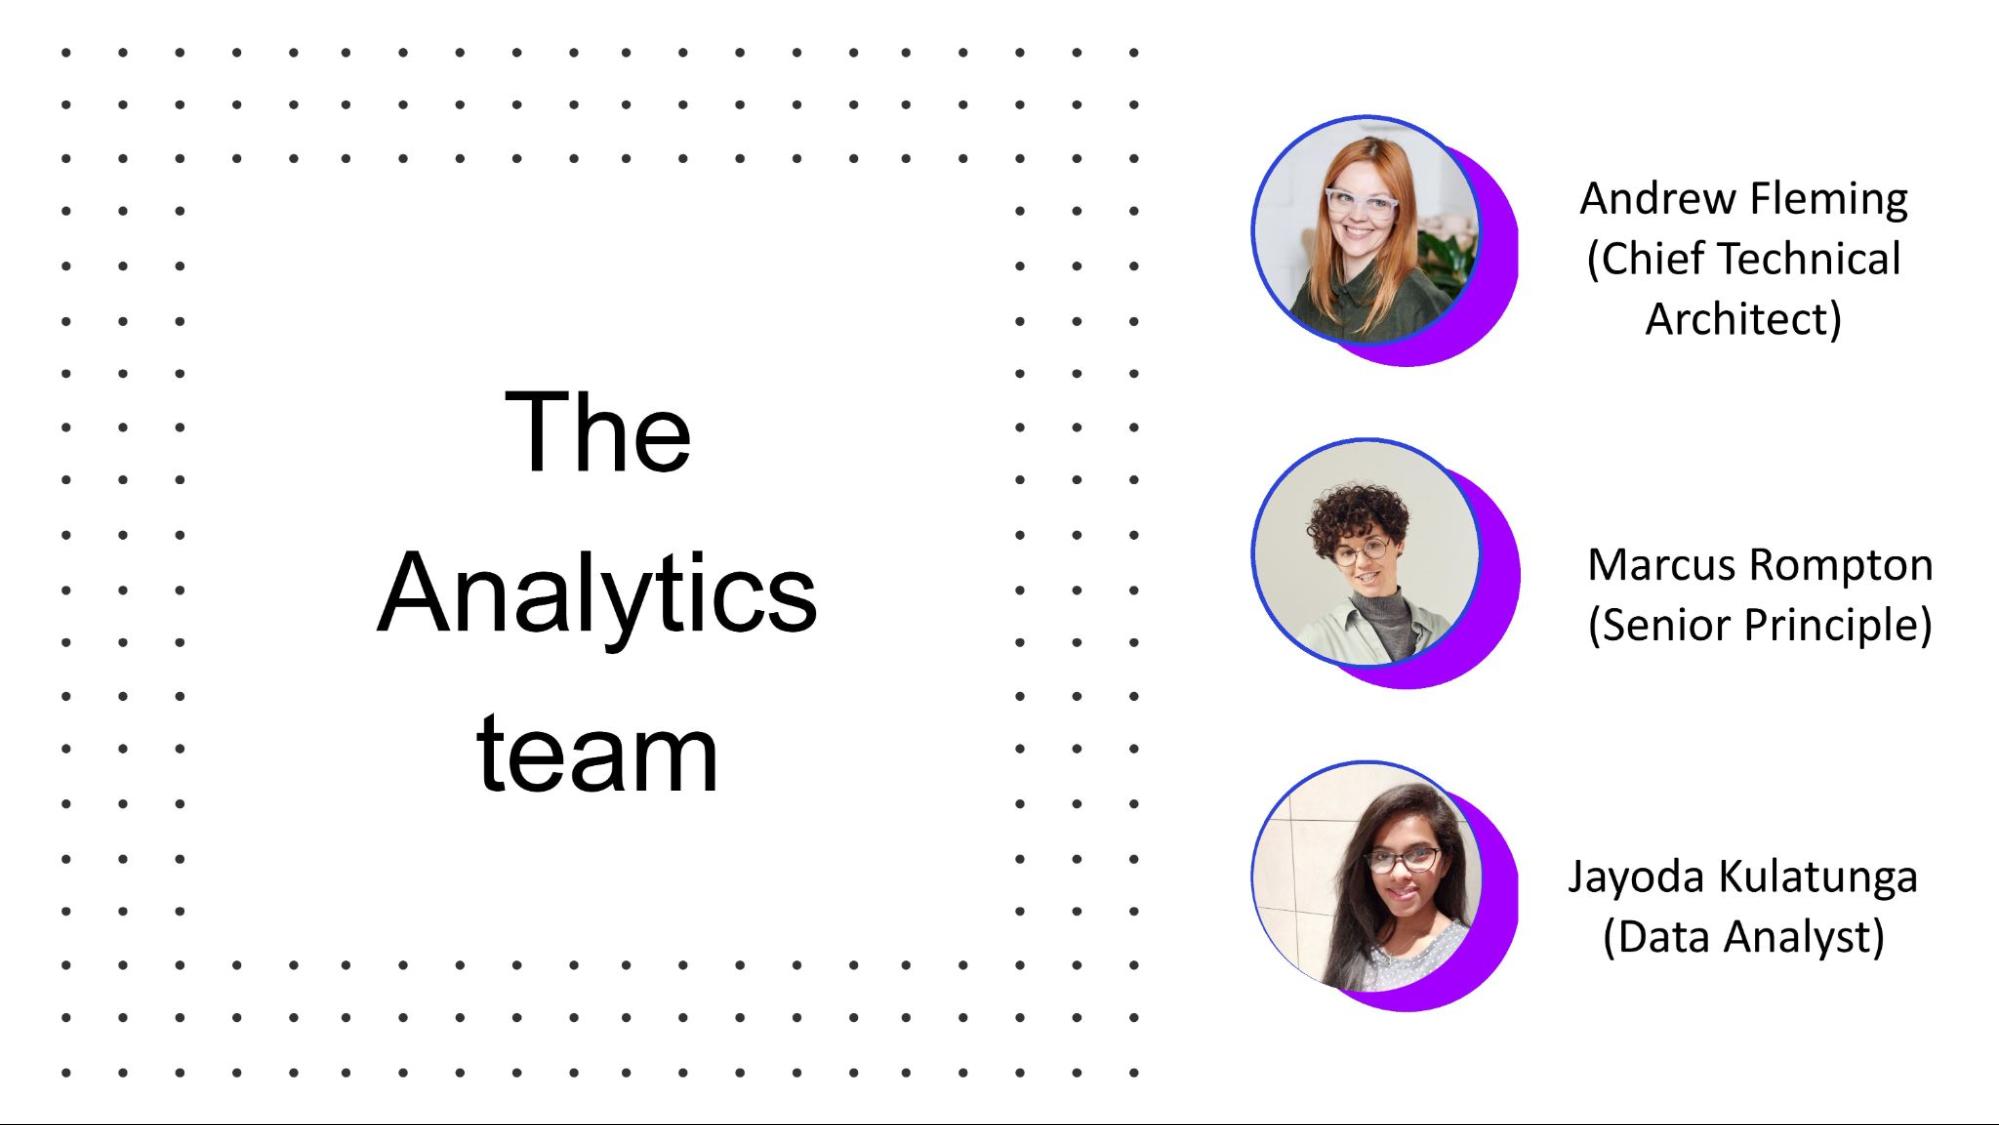
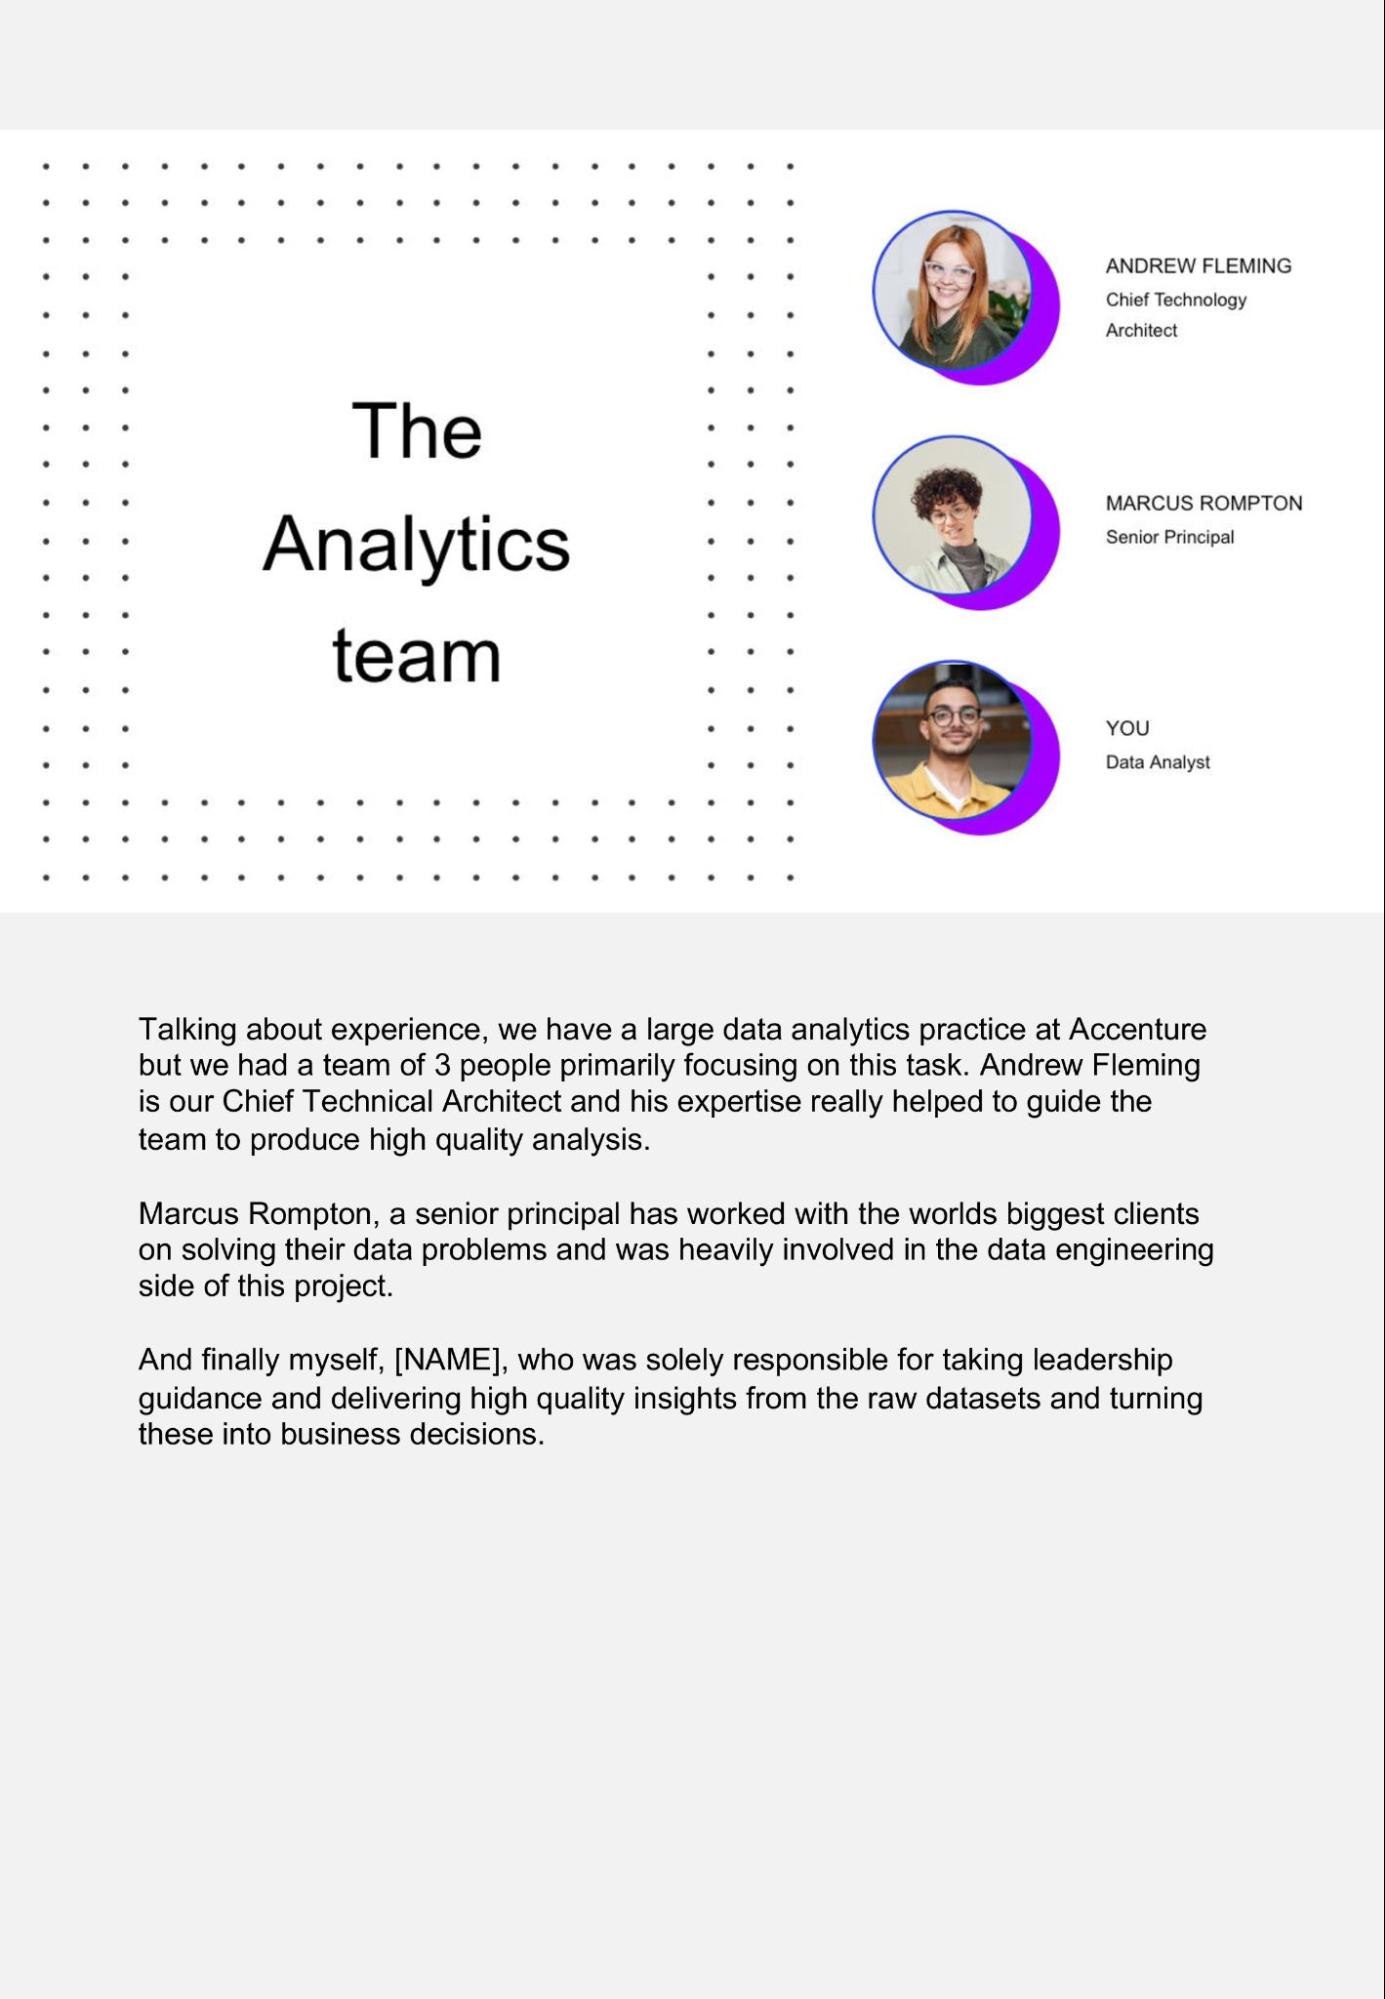
- The Analytics team - Who is on your team?
- As a reminder from the earlier task - this includes: Andrew Fleming (Chief Technical Architect), Marcus Rompton (Senior Principle), and yourself!
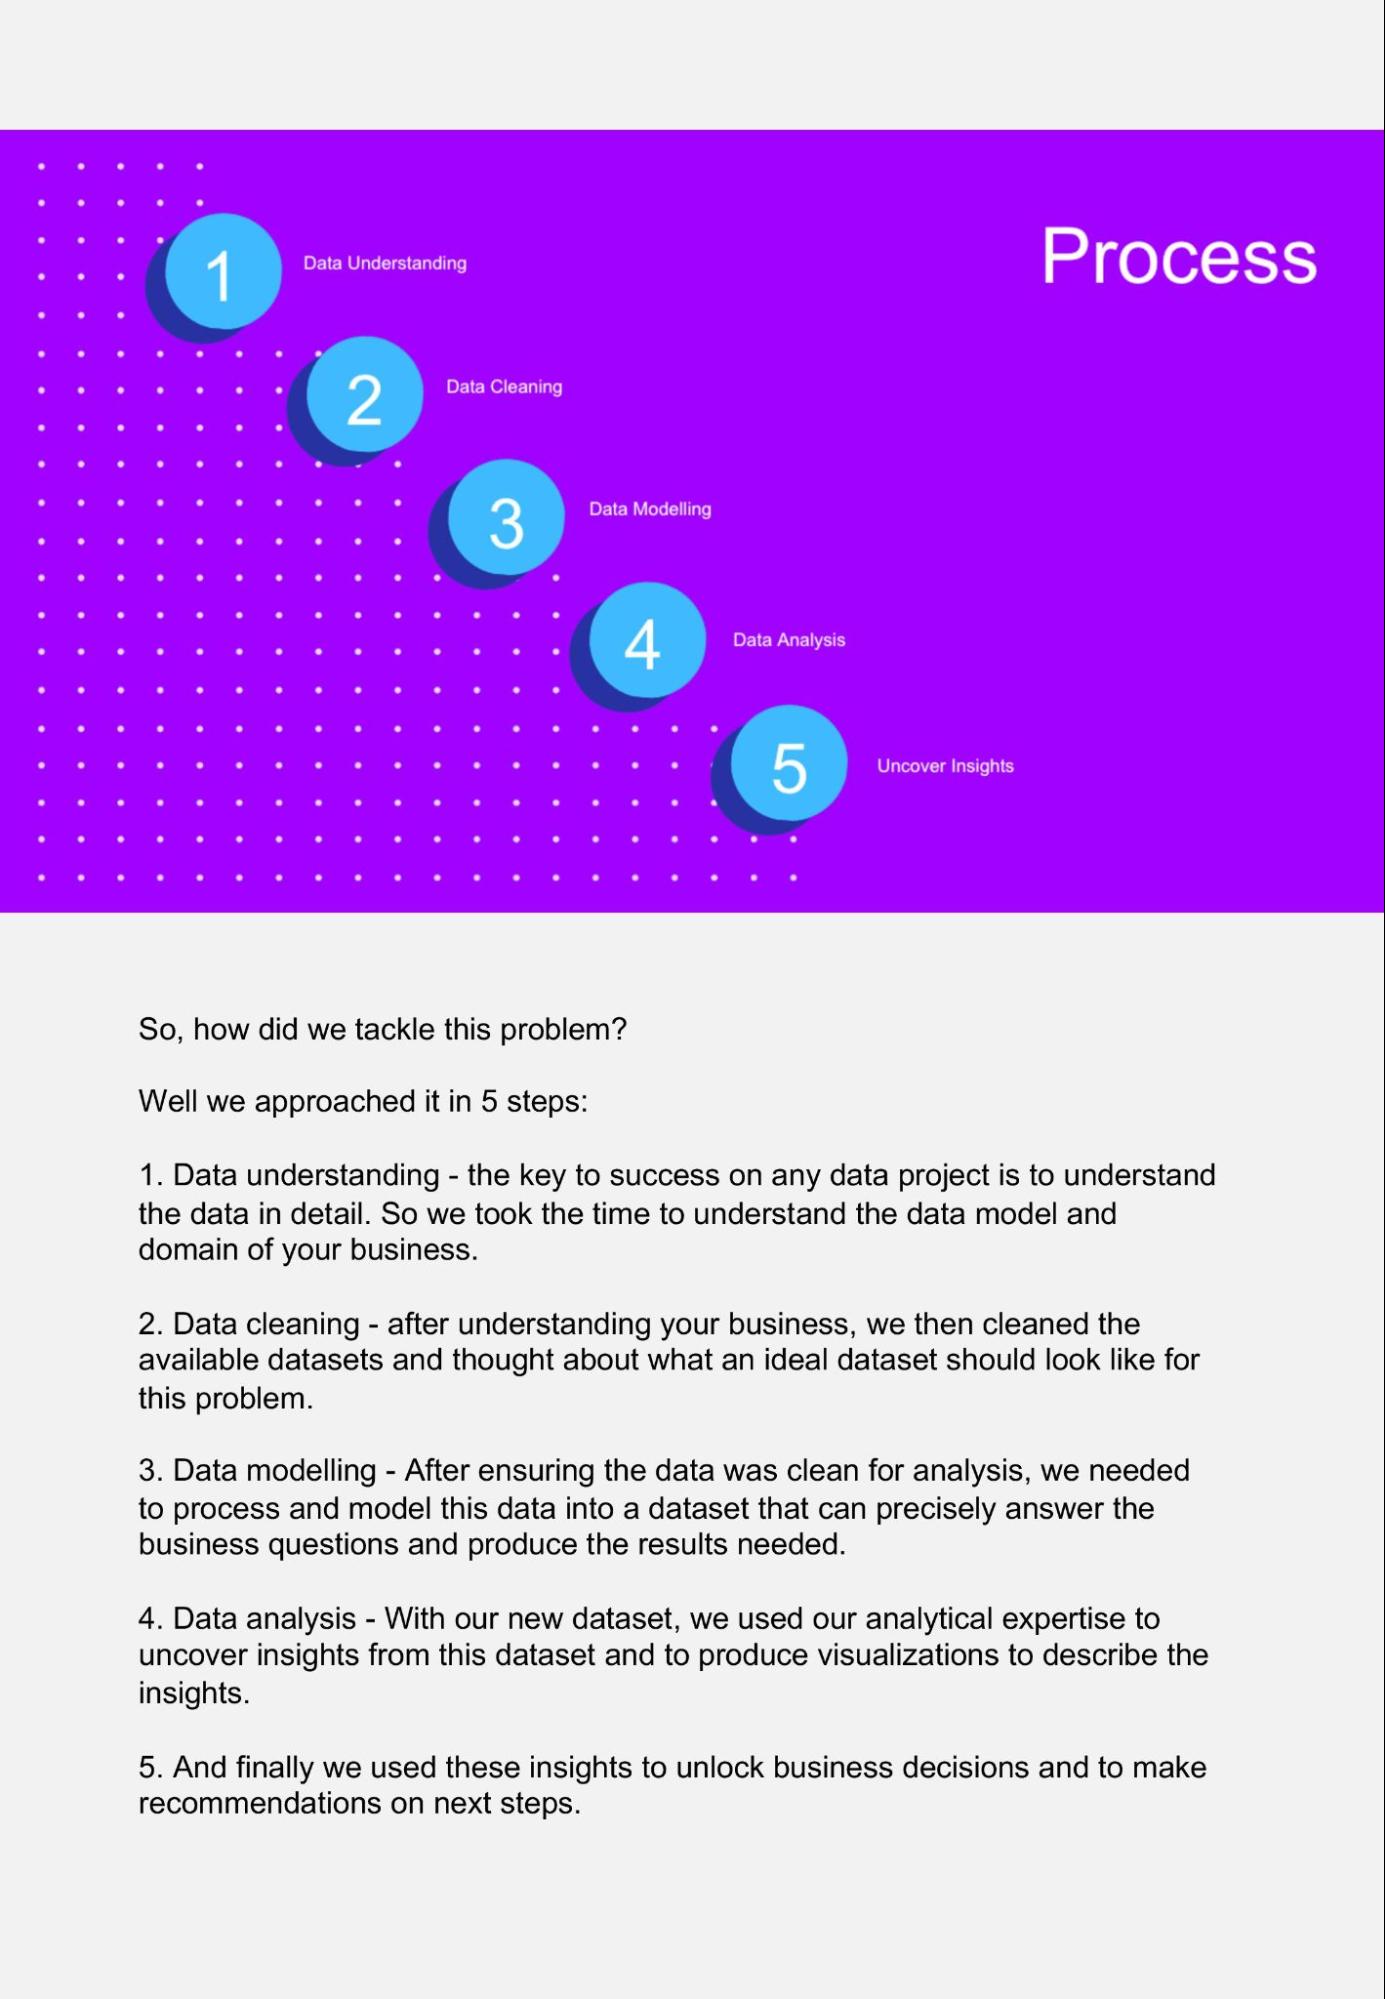
- Process - How did you complete your analysis?
Once you’ve populated slides 2-6 - complete the quick knowledge check to move onto the next step.
In the next step, we’ll review what you’ve included before we start charting. If you can't open the powerpoint template, here is a PDF version for you to use:
Accenture Presentation Template Click to download file →
|
3 Question |
Question 1 of 1 Have you completed slides 2-6 in your presentation?Yes! Not yet Great Work! Great! Let's move on. |
4 Quick explanation | Quick explanationGreat work! To ensure you're on the right track, have a look at these annotated images to see how a professional at Accenture would have completed slides 2-6. Notice how the information is clear and concise, and summarizes the most important points. You can click on each image to expand it. When you're done, move onto the next step and we'll add in some charts! 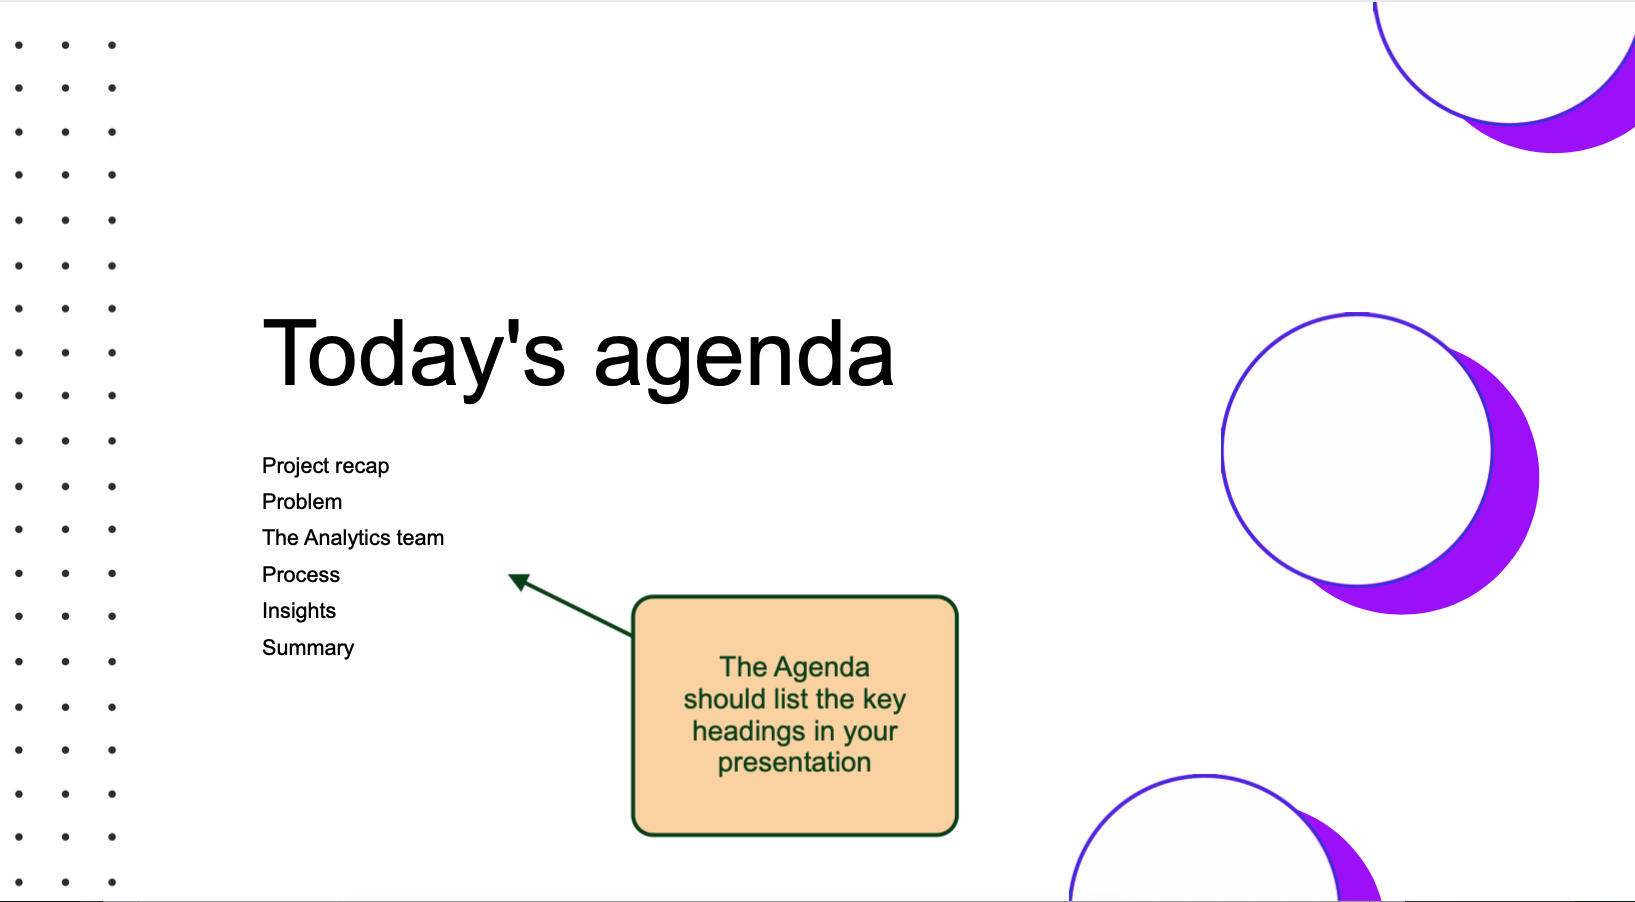
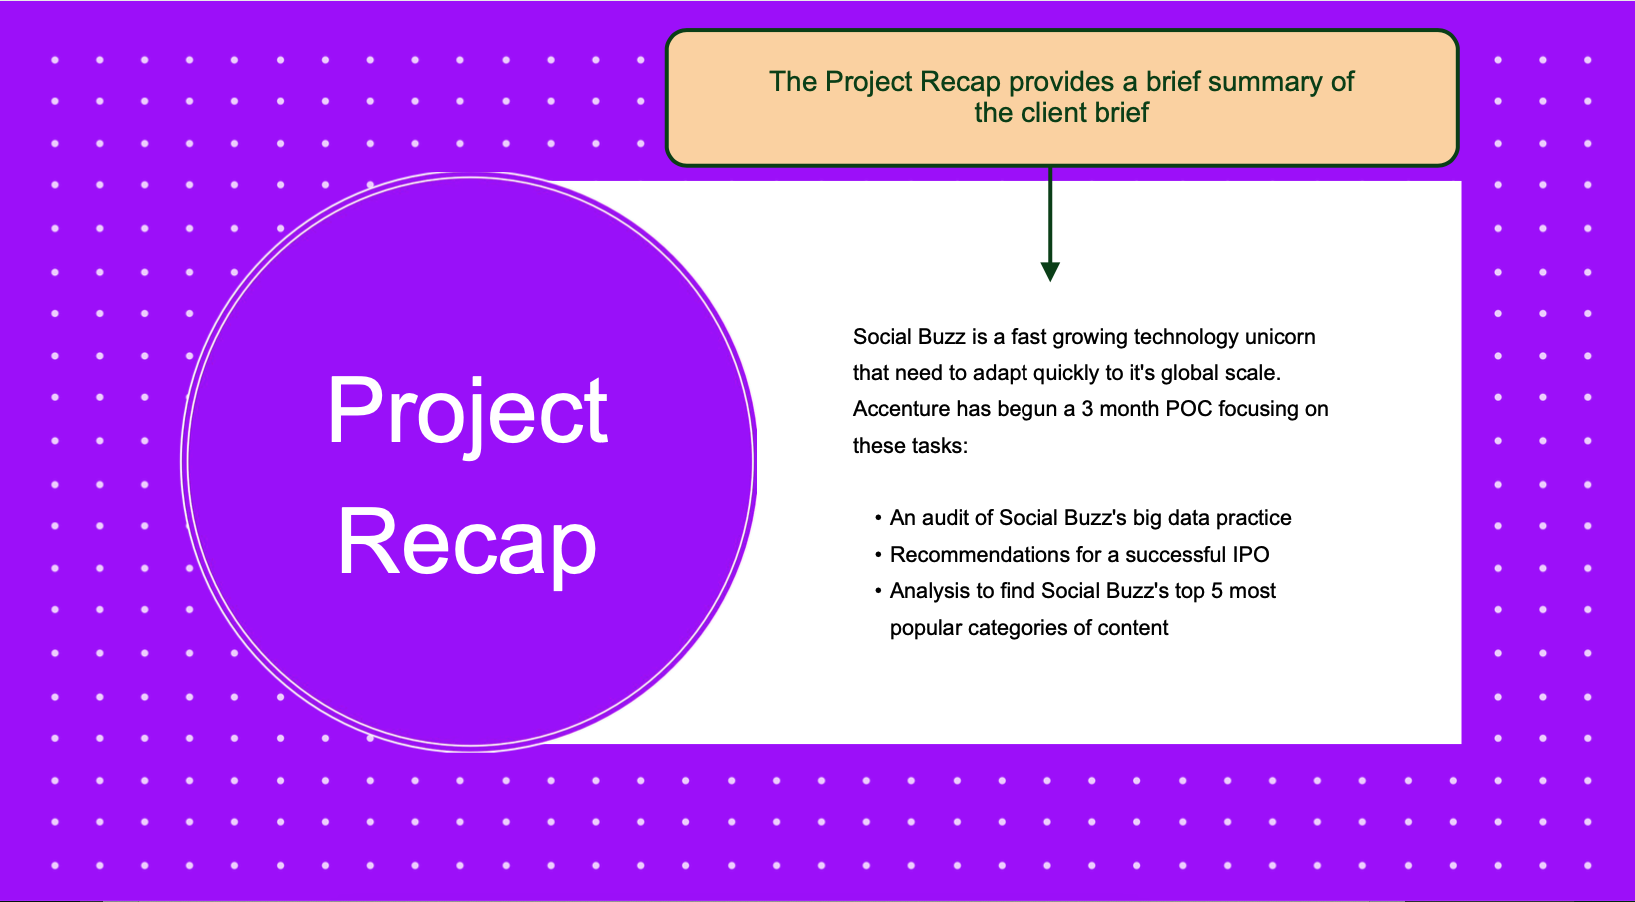
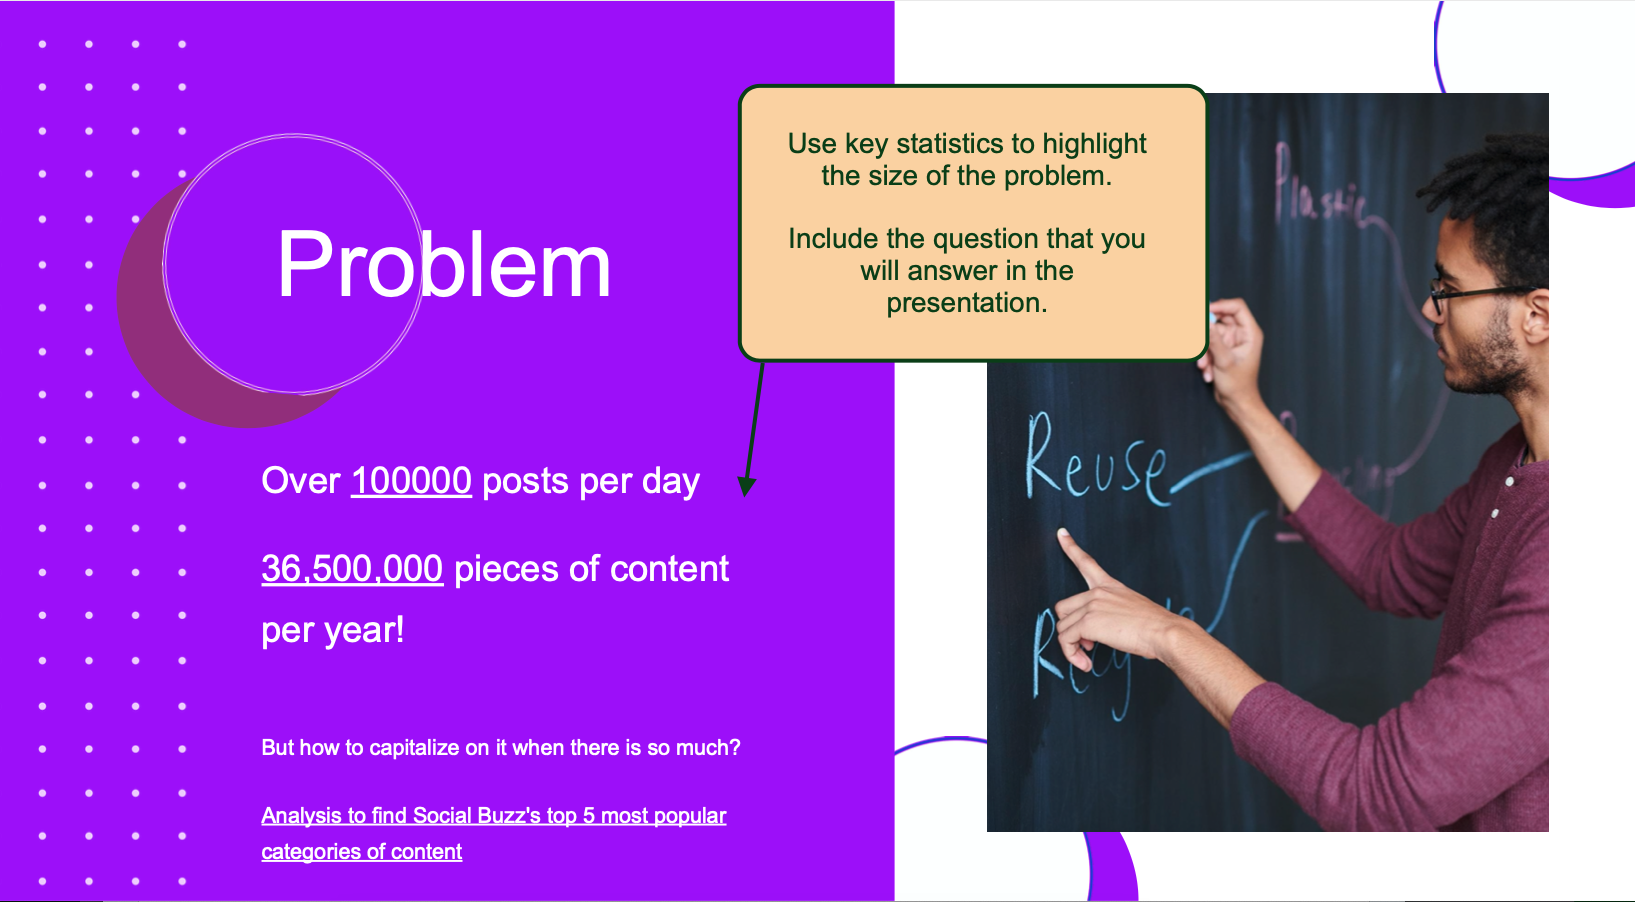
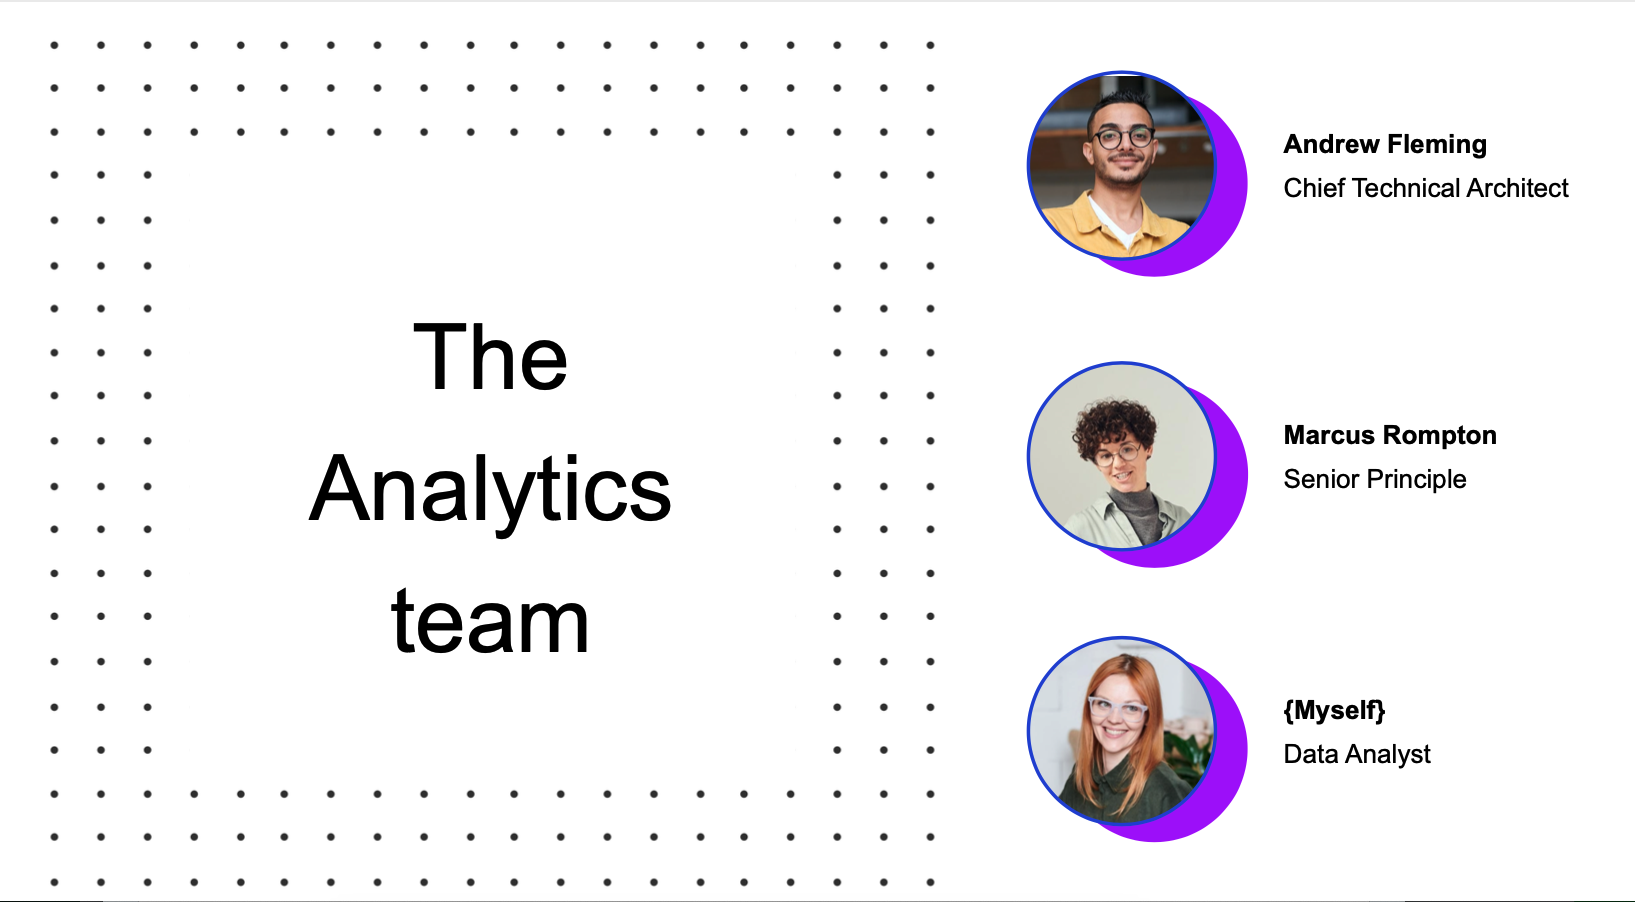
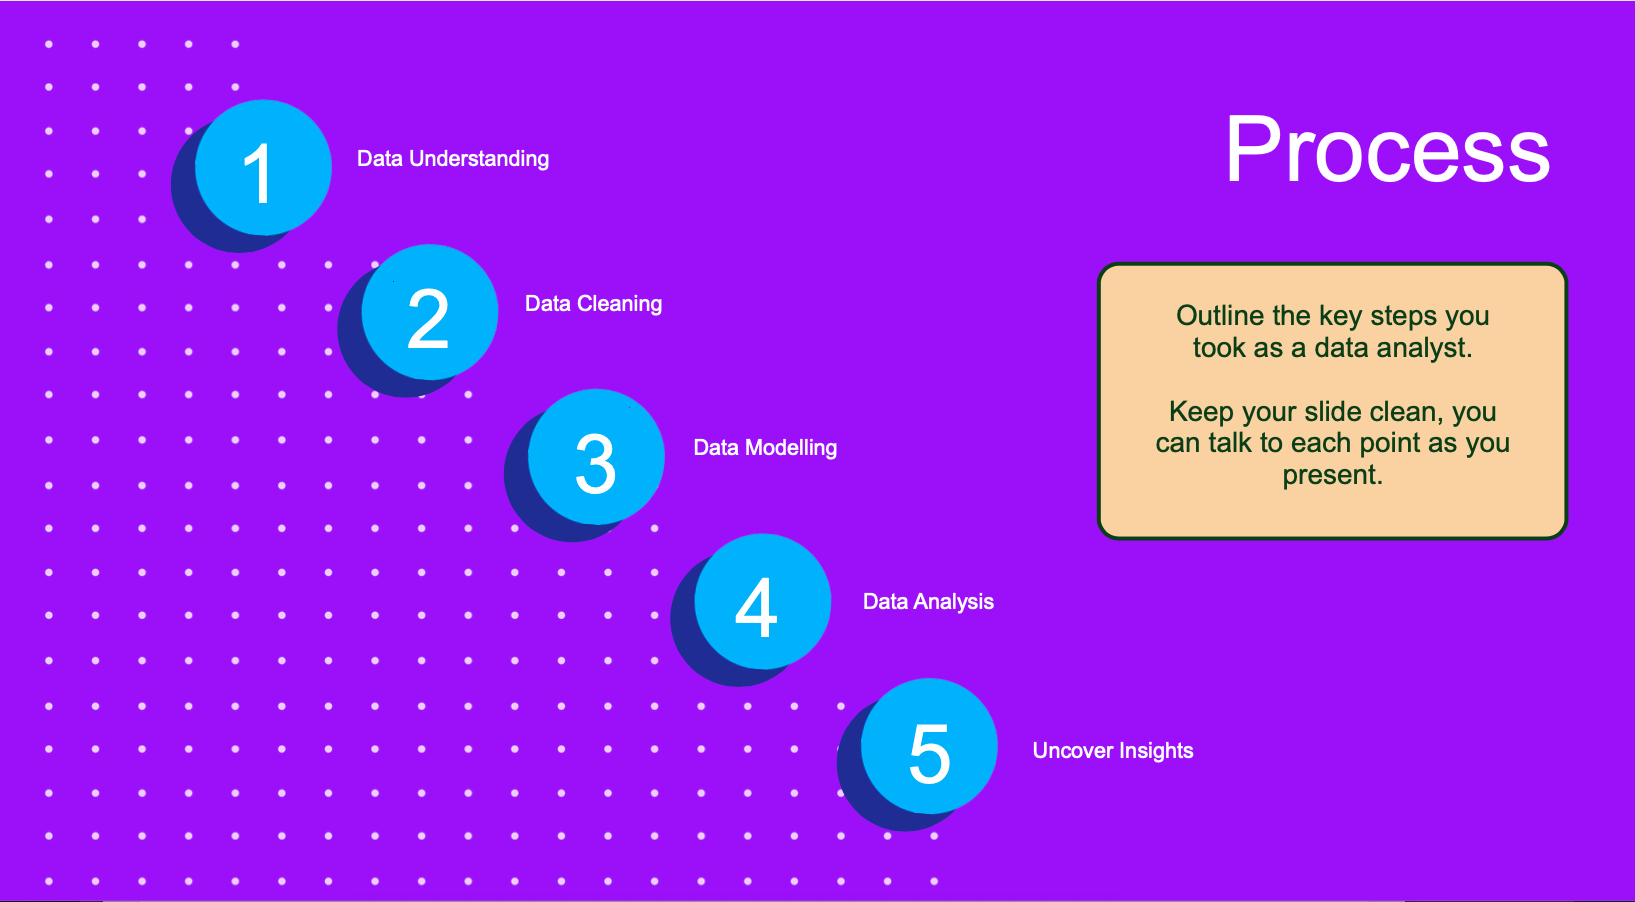
|
5 Create your charts | Create your chartsThe final step of this task is to populate slides 7 - 10 with your data insights. If you’ve lost your spreadsheet, we’ve attached one here again for you to use.
Cleaned data set for analysis Click to download file →
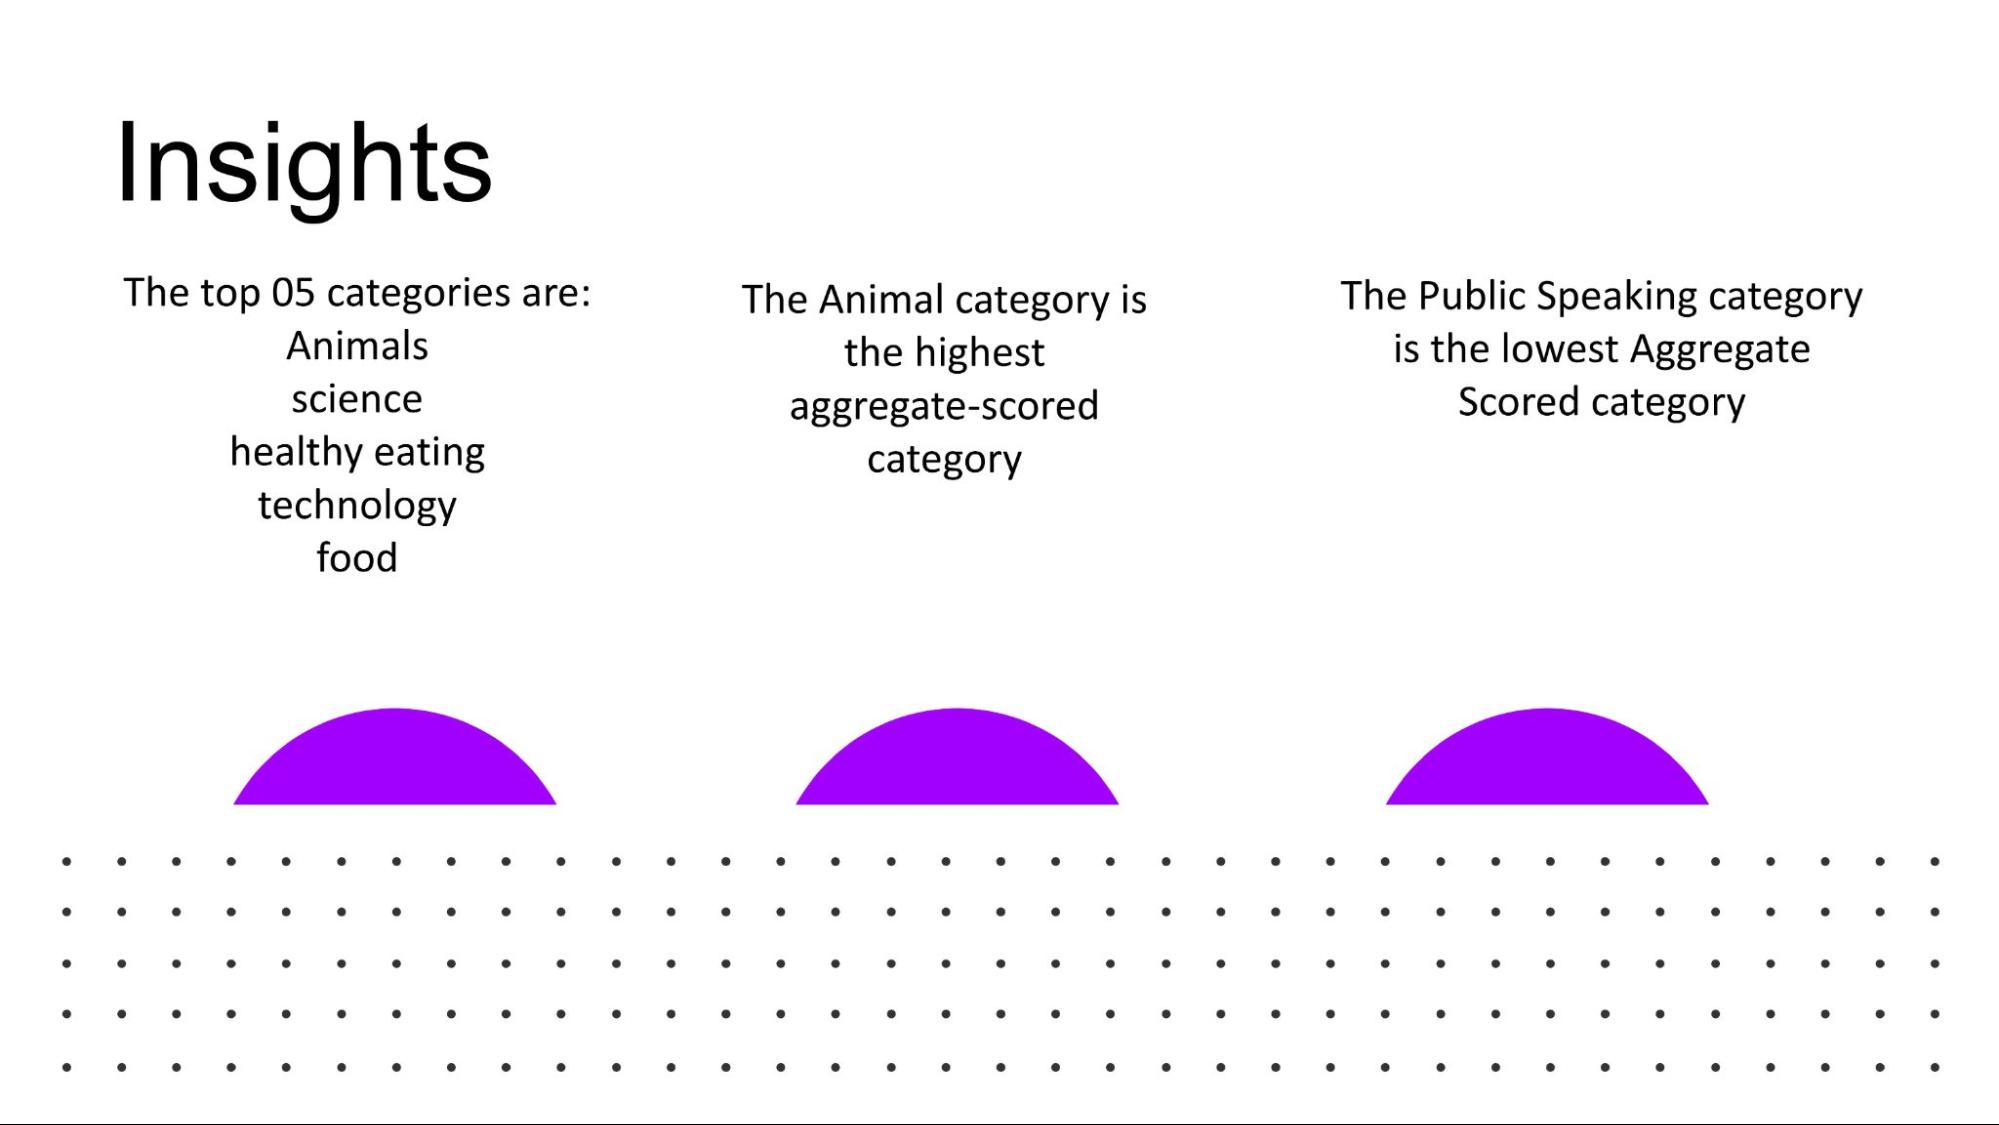
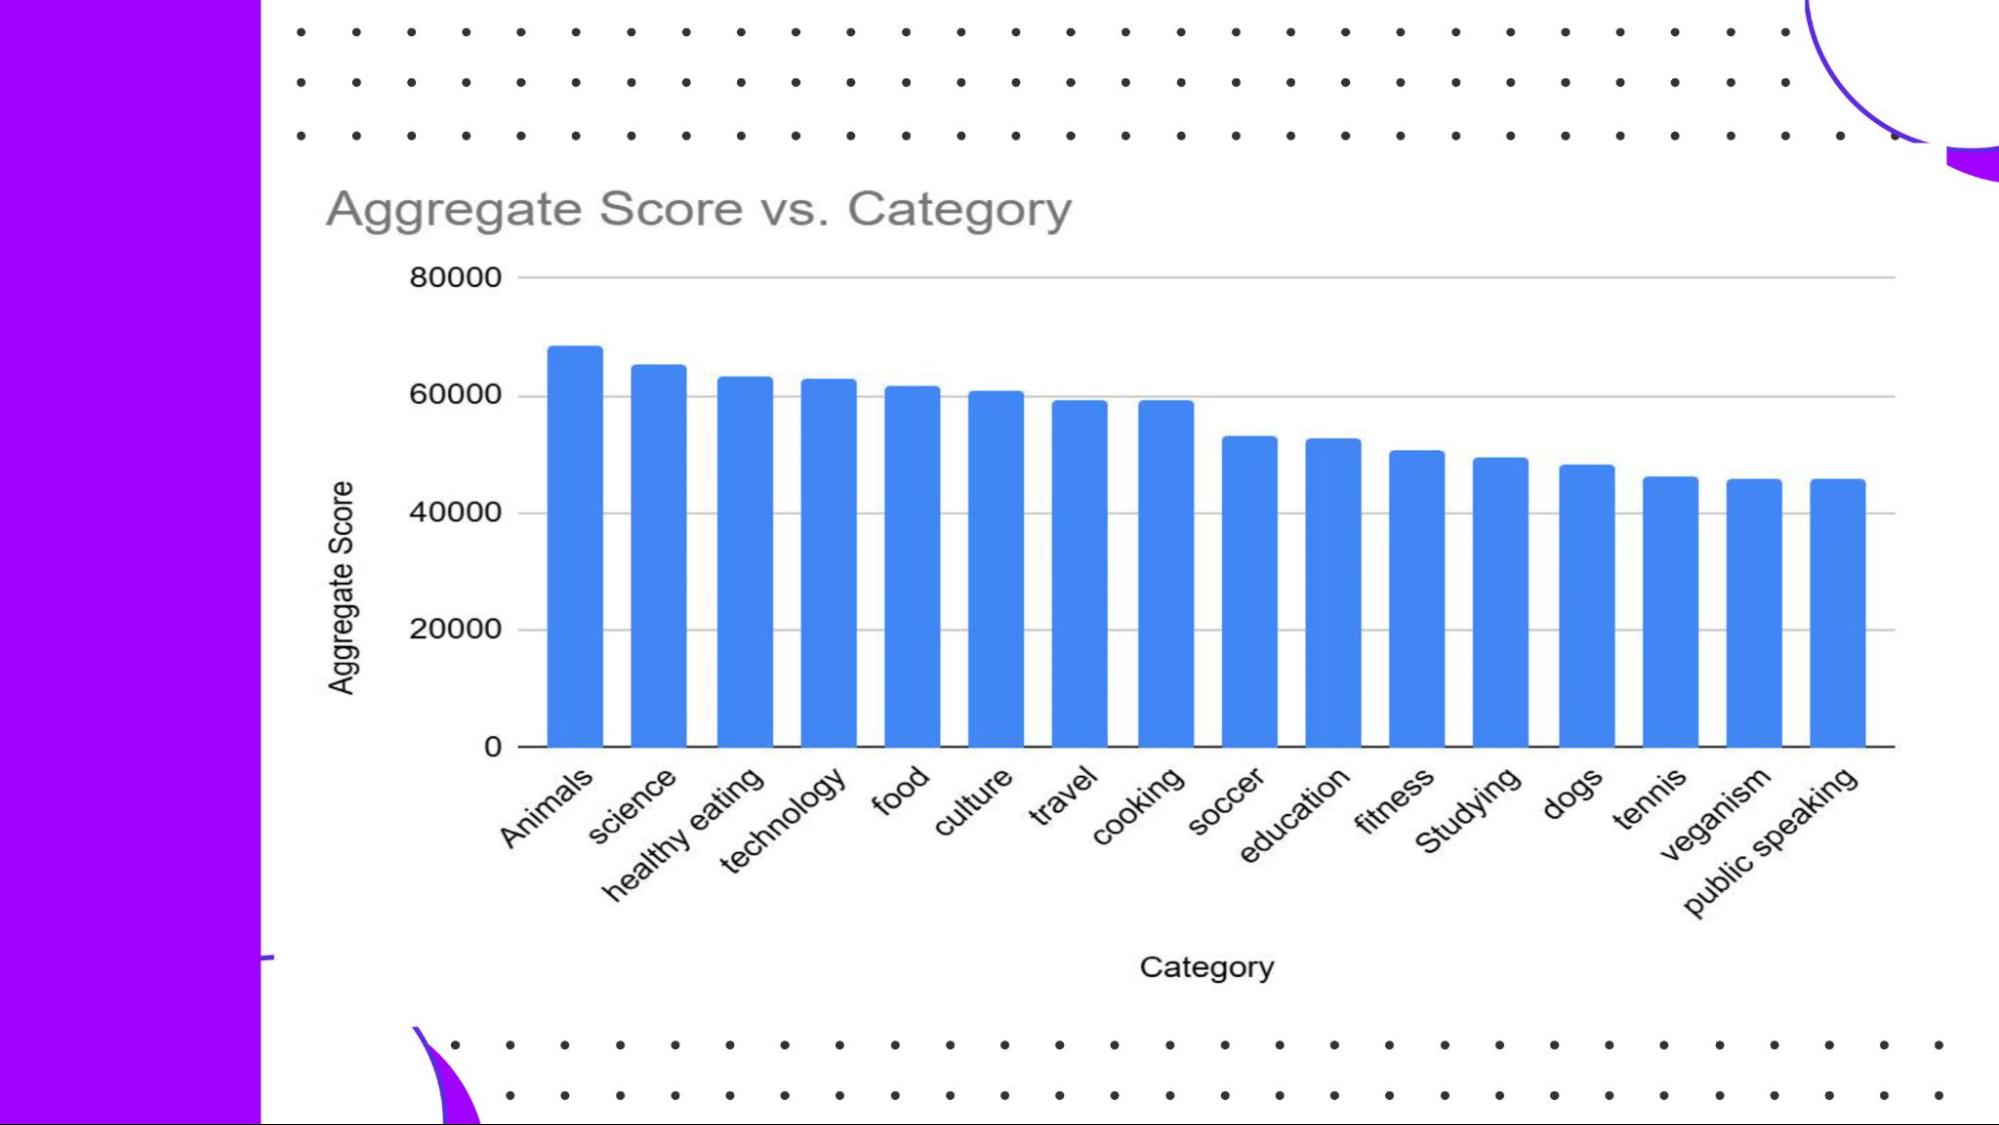
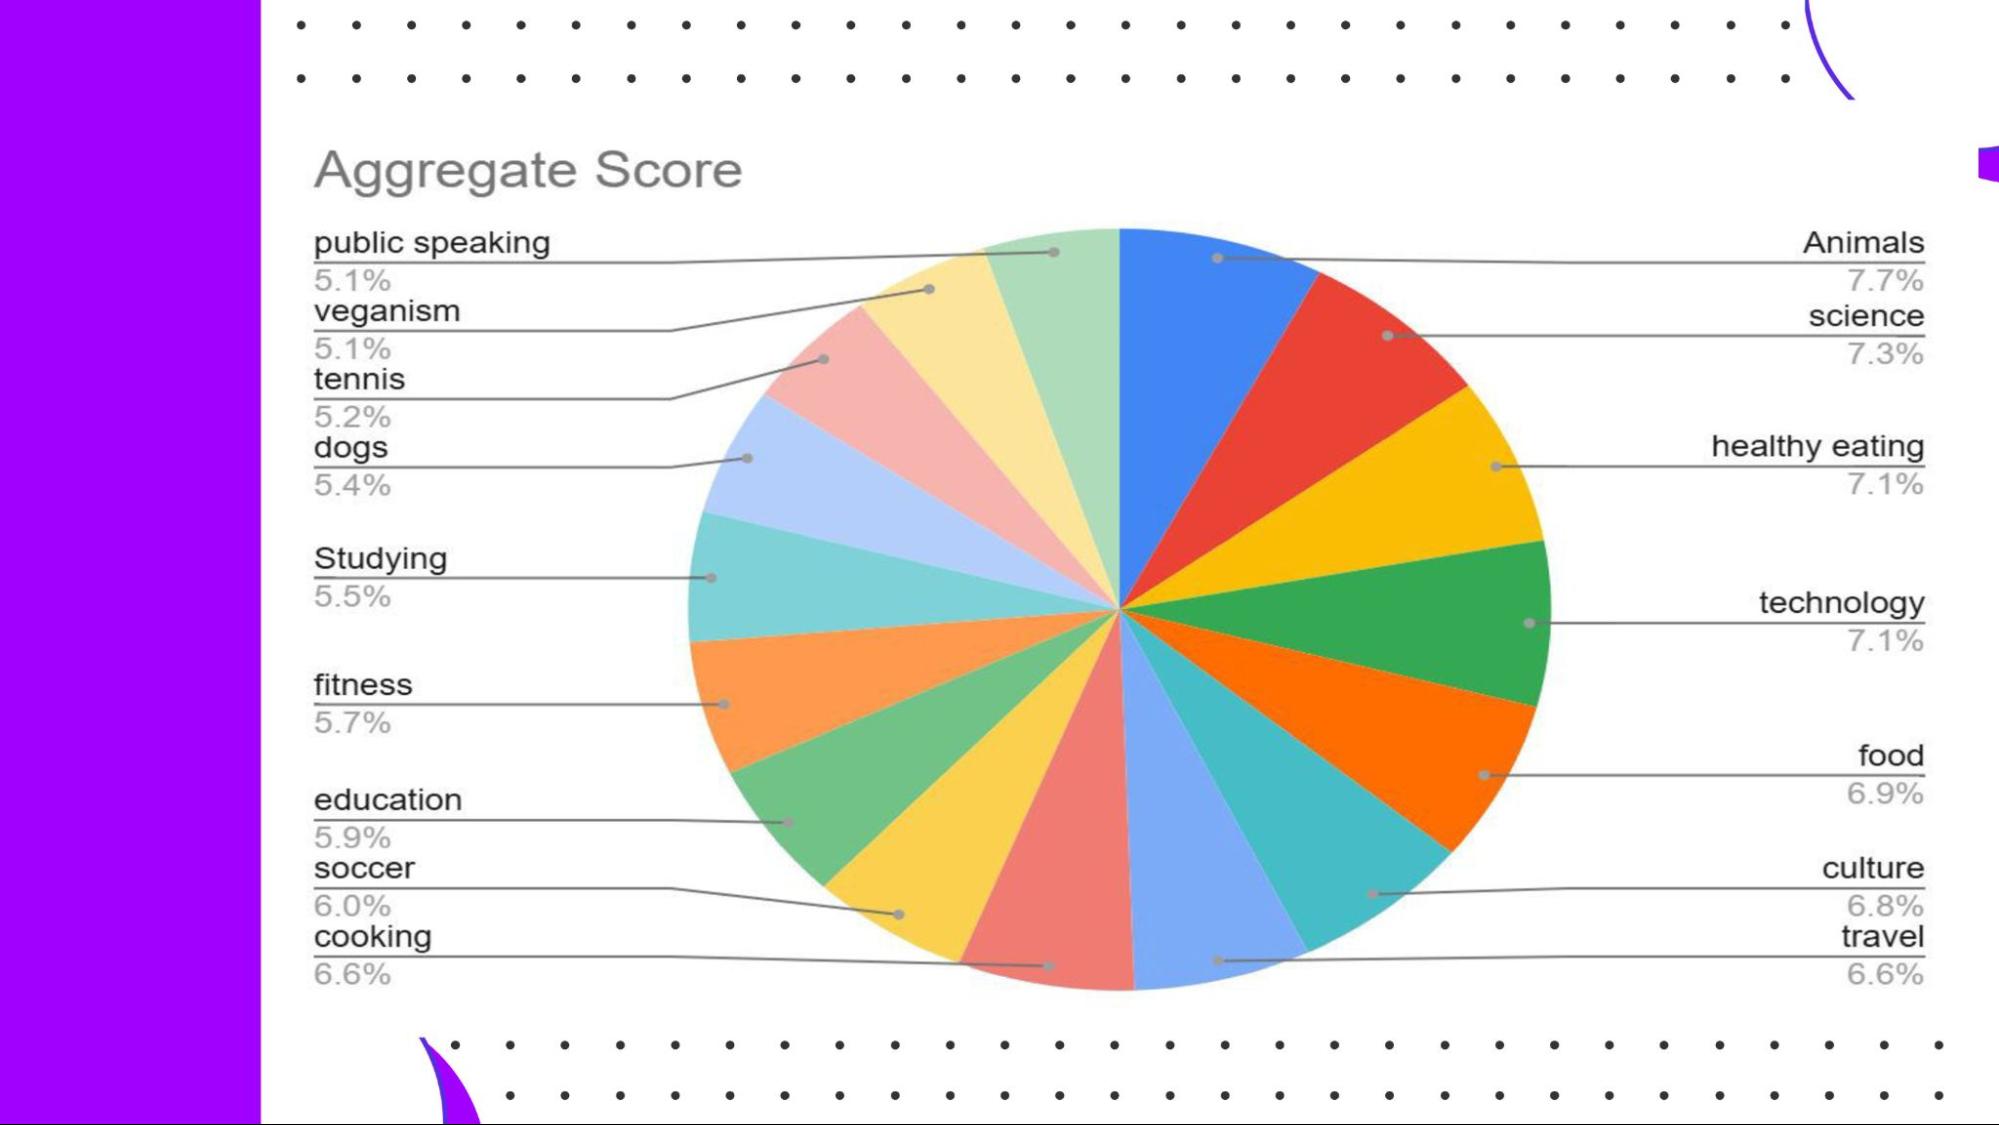
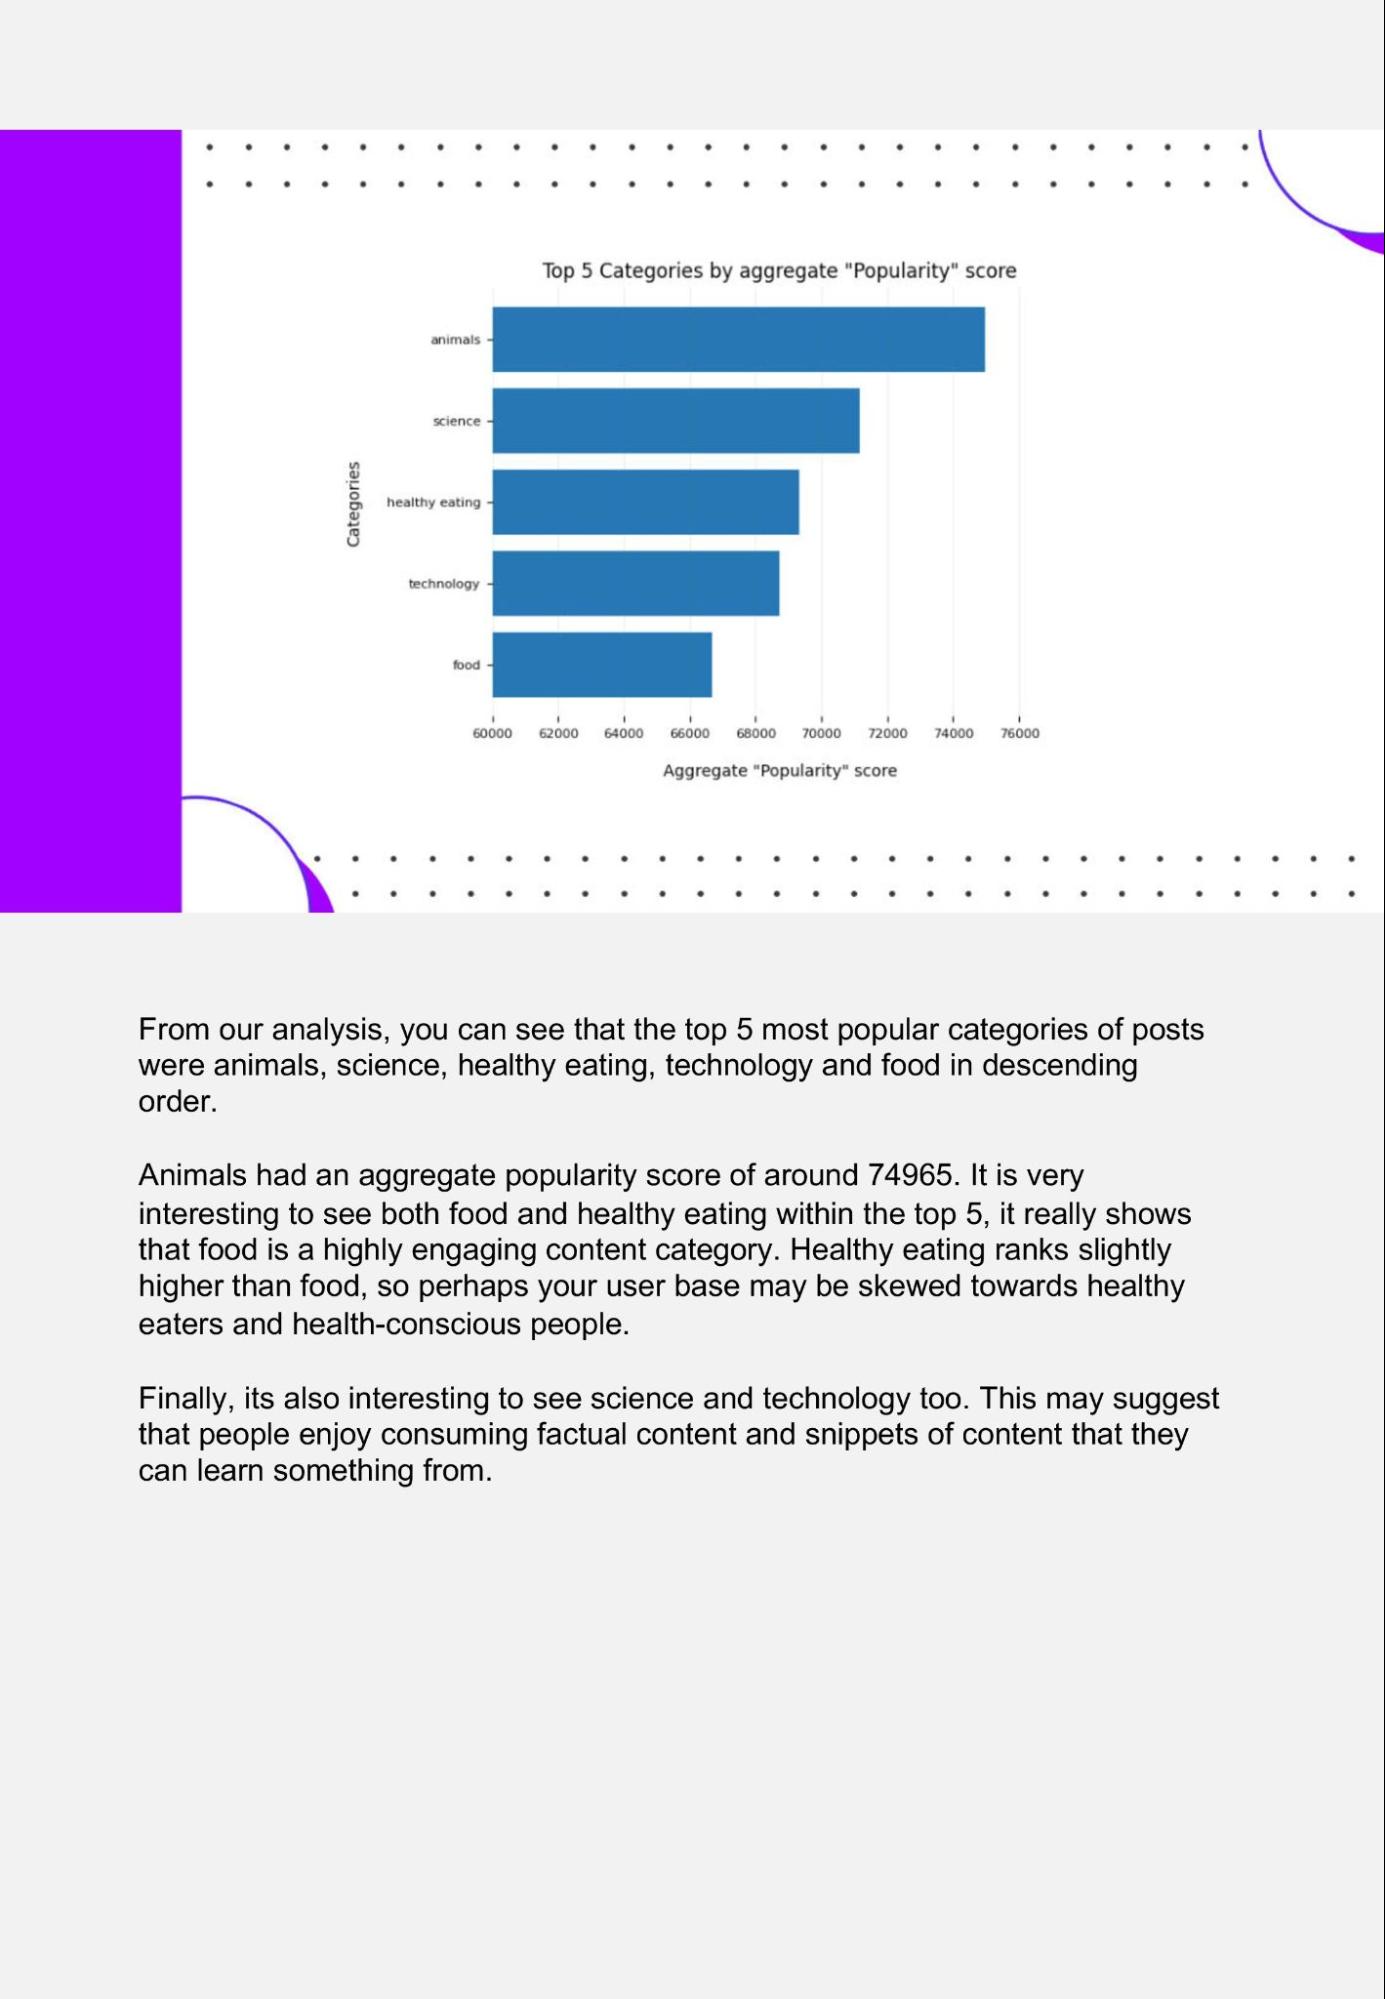
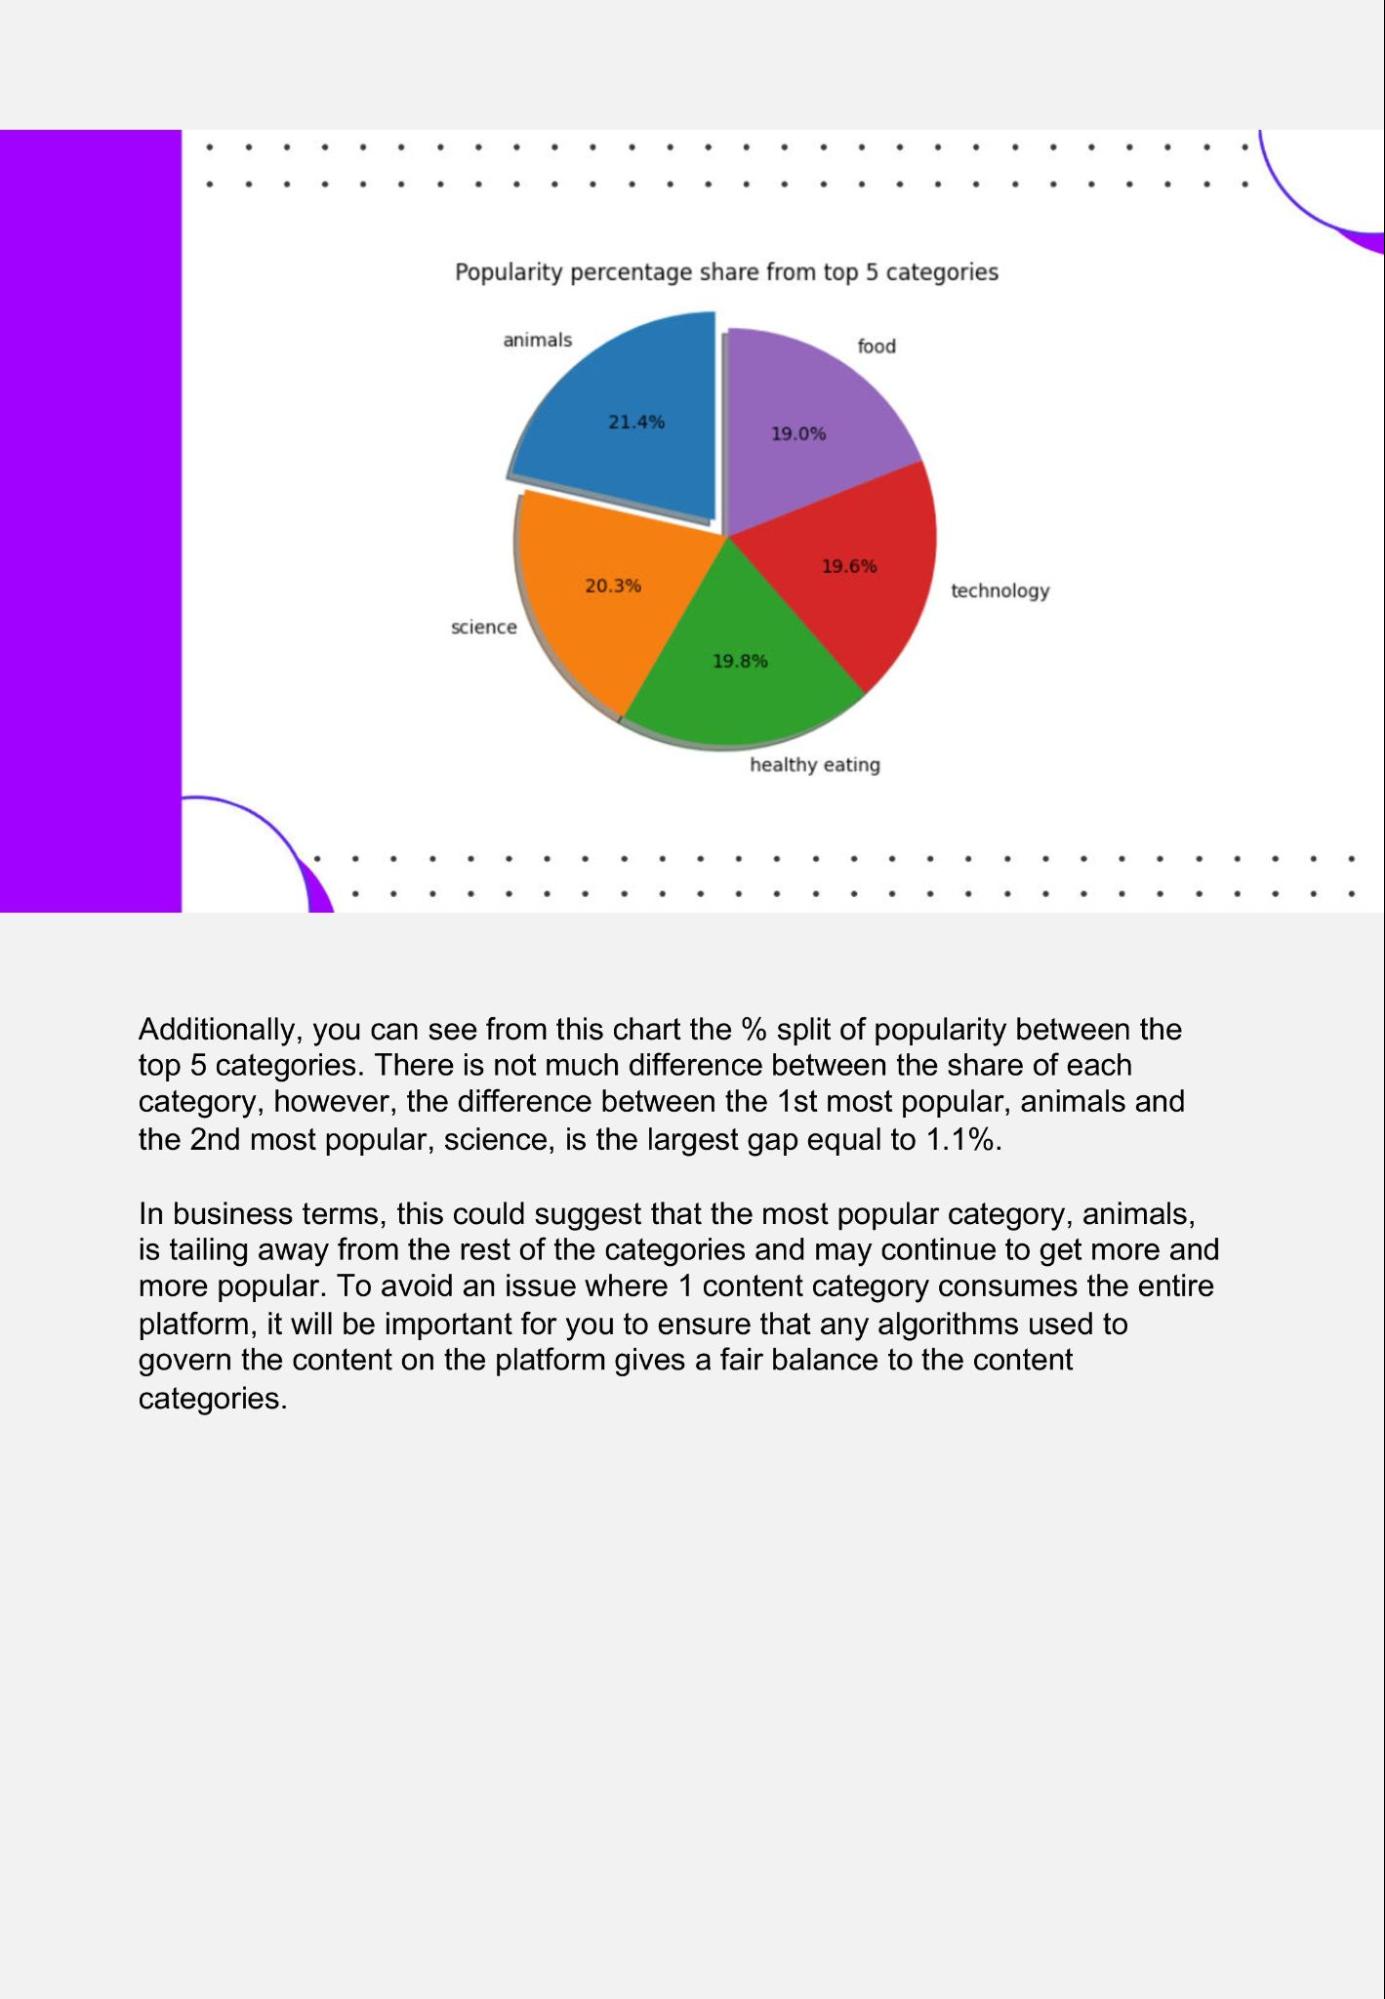
We know that the client wants to understand the top 5 content categories. Have a think about what are the best ways to present this? In a pie chart? In a bar chart?
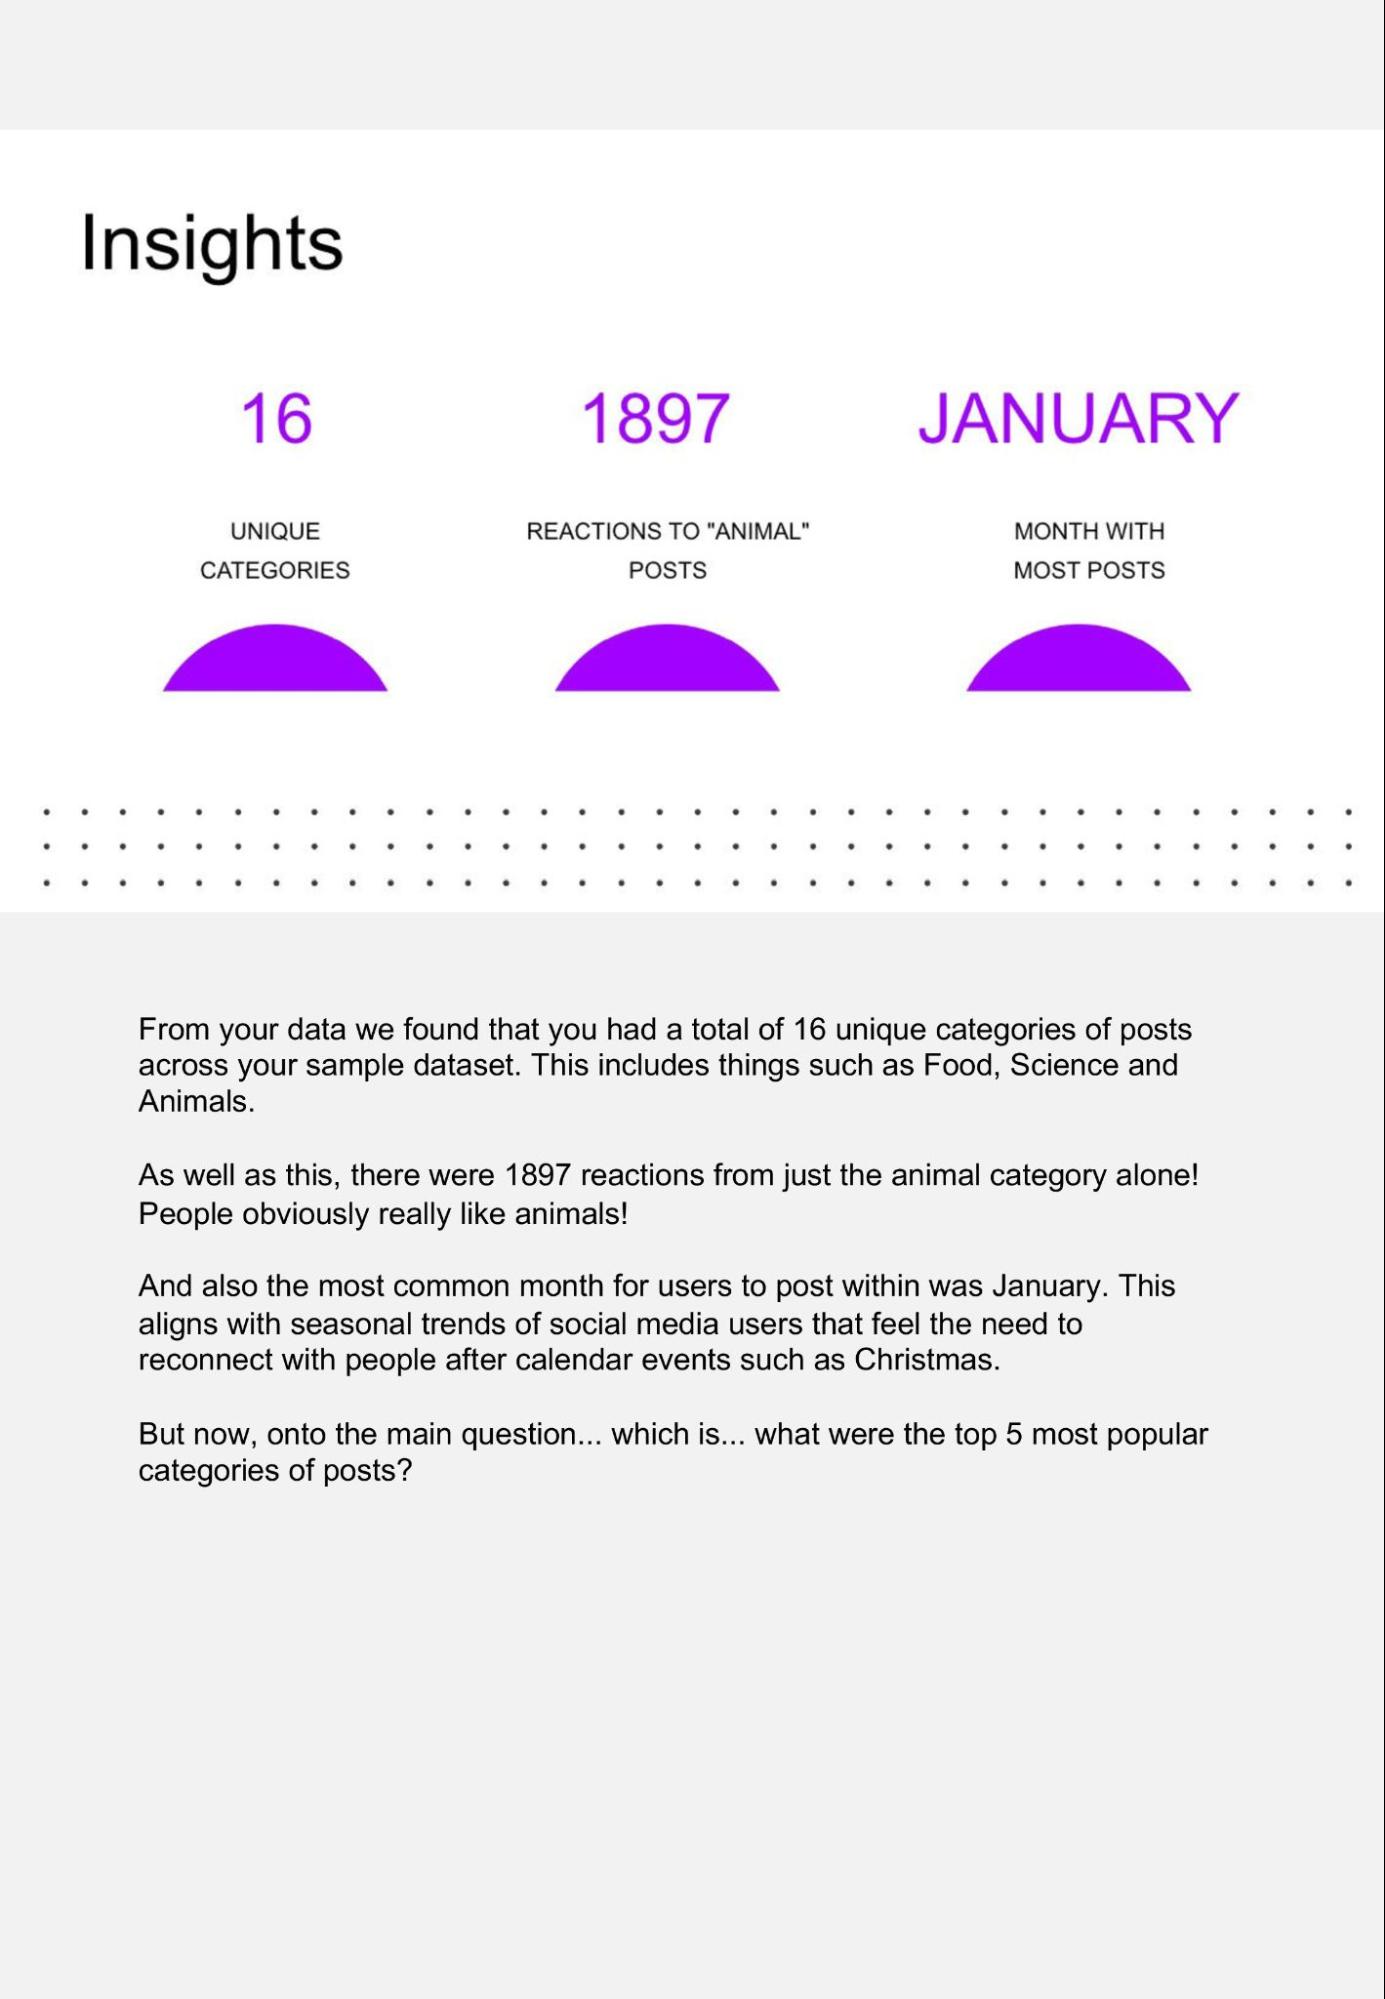
There are also some other interesting insights that we might want to share with them. For example: - How many unique categories are there?
- How many reactions are there to the most popular category?
- What was the month with the most posts?
If you get stuck, here is a resource on how to make charts in excel. Once your slides are complete with your data insights and charts, upload your work to see the example answer in the next step.
|
6 Data Visualization Explained | Data Visualization ExplainedNice work completing the data visualization exercise! Like we’ve said, it’s important to keep your presentation simple and clean - take a look at the annotated example images to see how you could have visualized the data. You could have done it differently, and that’s okay! There are lots of different ways that you can bring data to life. Now let’s go to your final step where you will practice your presentation skills! Click on each image to expand: 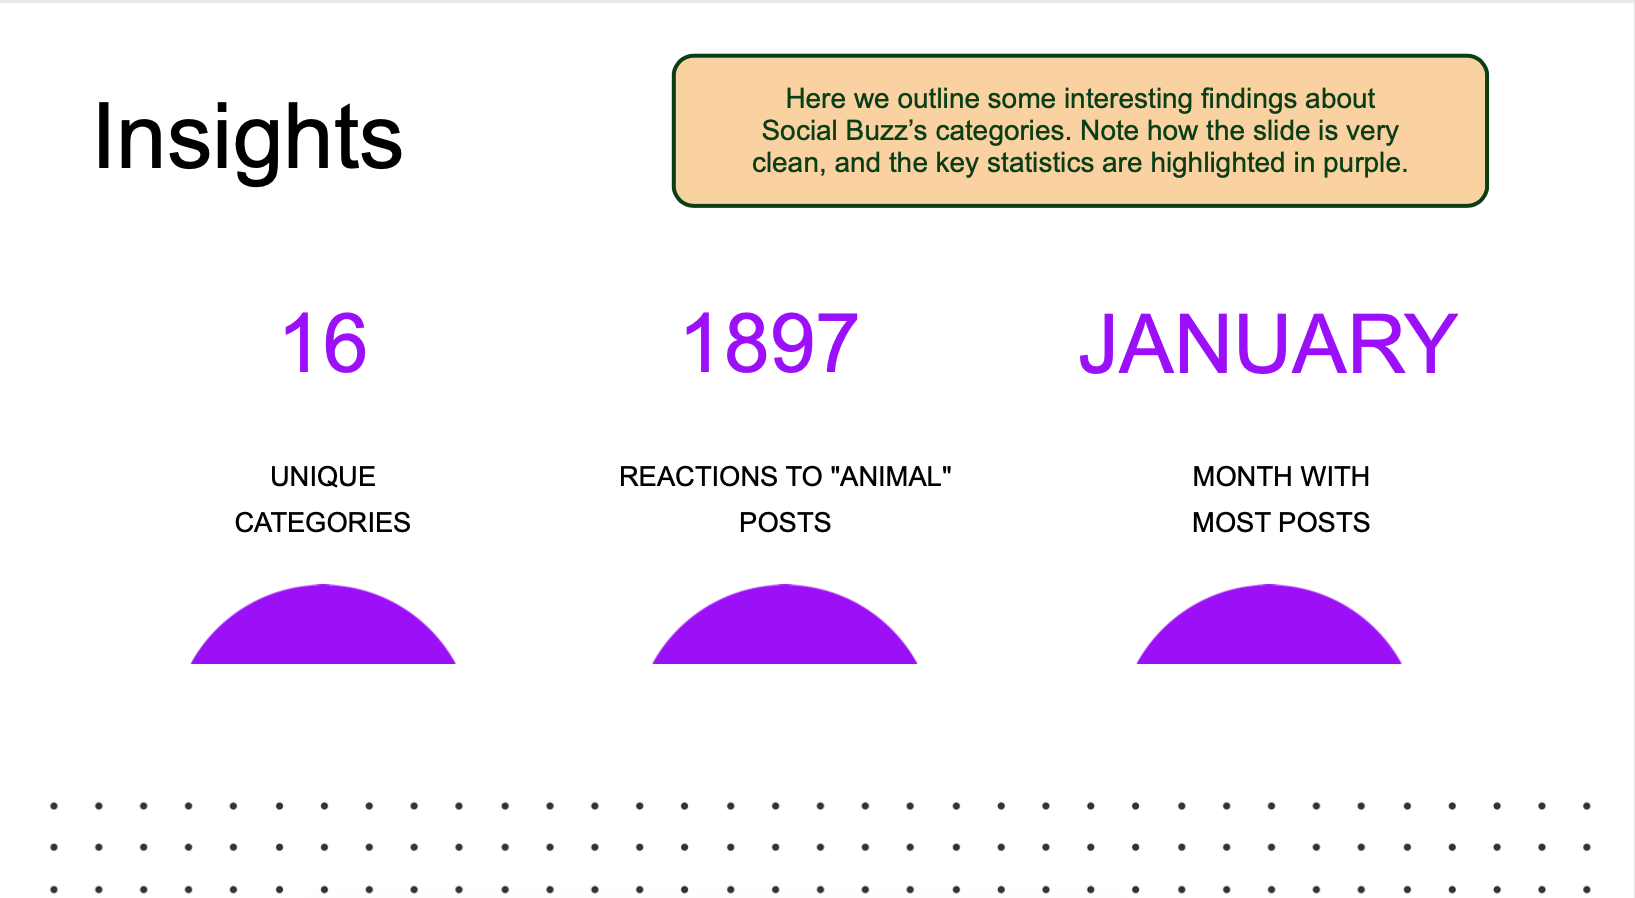 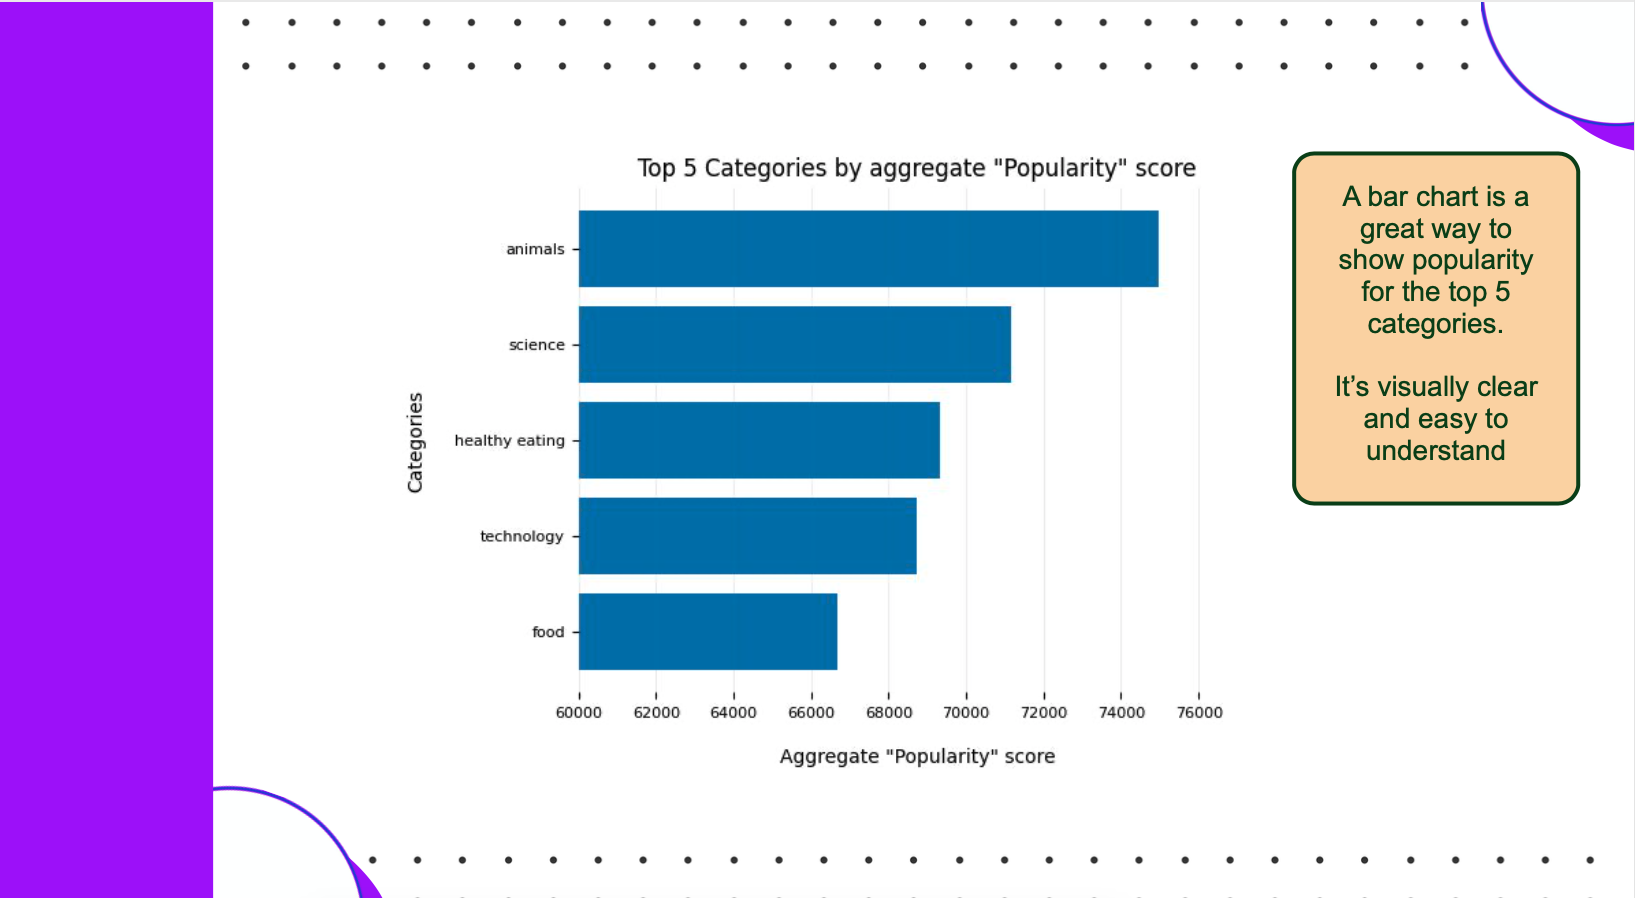 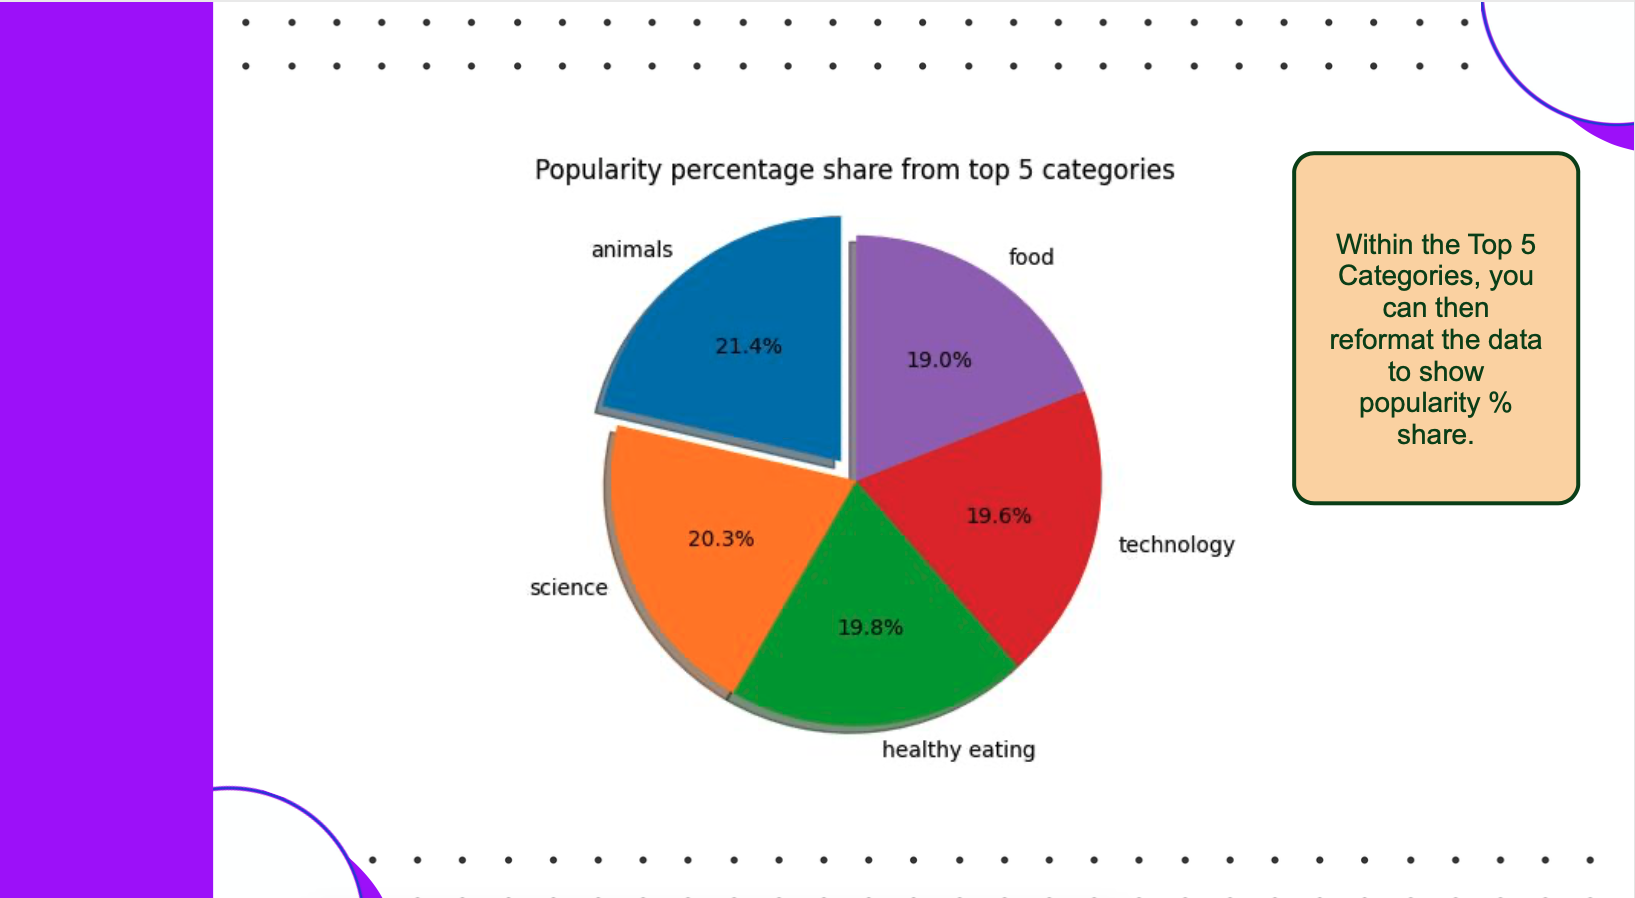 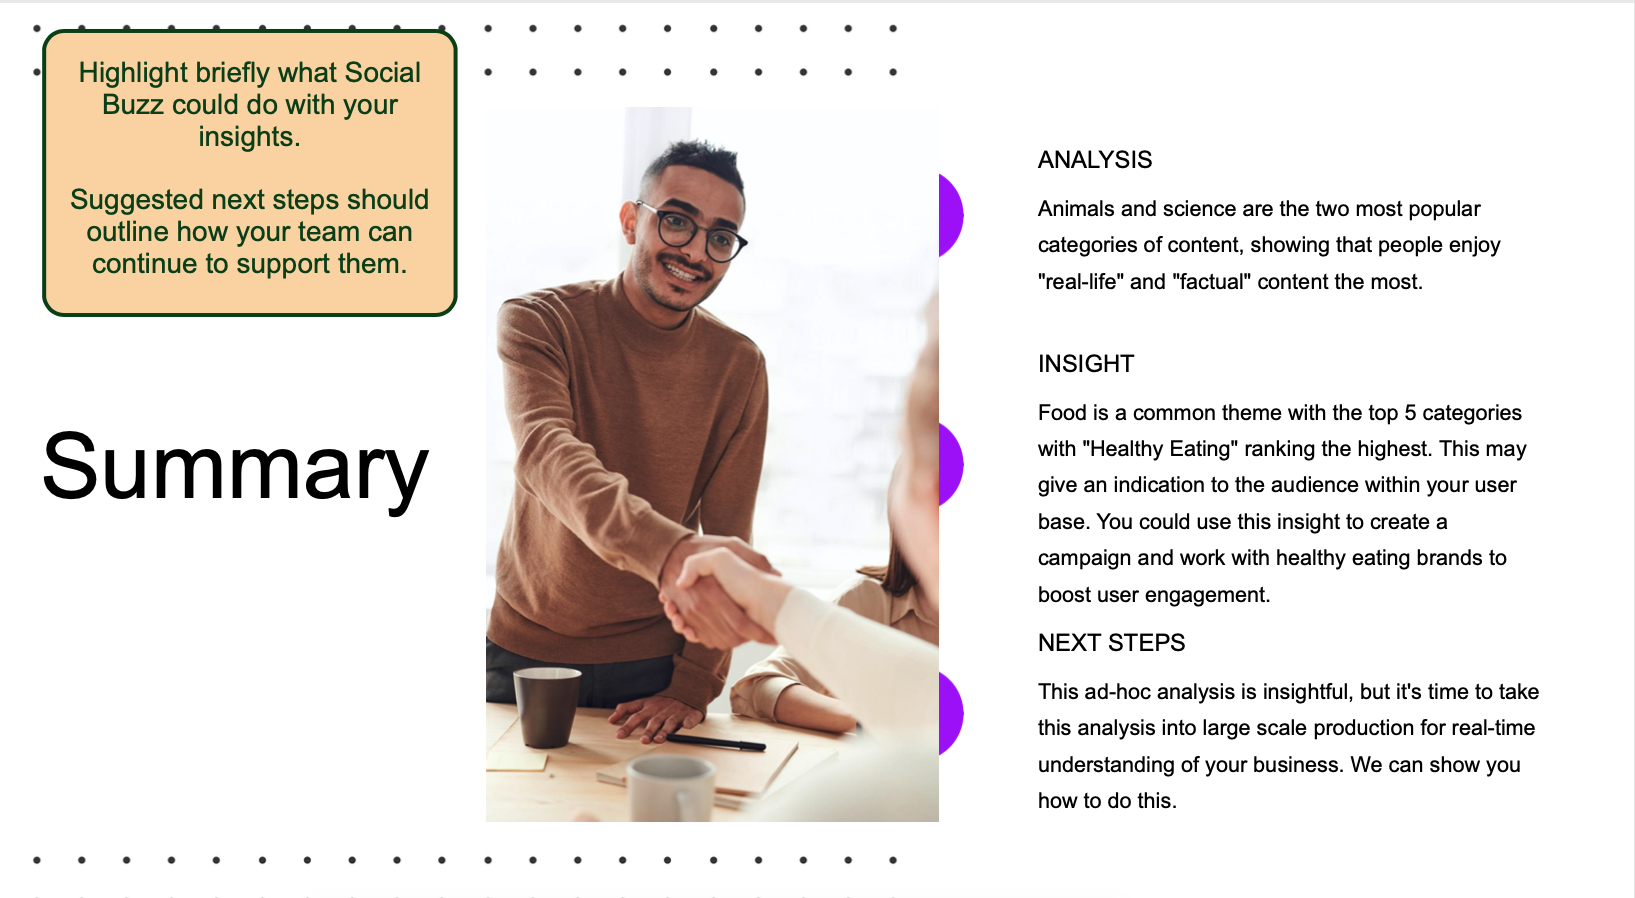
|
7 Completion | 
|
|
|
Task Four: |
|
1 Task Overview | Task 4: Present to the ClientTask OverviewWhat you'll learn- How to prepare for and present insights to a client in a presentation
What you'll do- Record a <10 minute video of your presentation to your client and internal team members
|
2 Presentation tips | Presentation tipsWhen presenting to the client there are a few things that you should remember: - They may not all be familiar with data, so you need to make sure you talk to them in business-friendly language.
- You want to show them that you’ve understood their business and requirements, so use their terminology and language relevant to the task.
- This is your time to shine and to show them how great you are! Try to present your work with confidence and conviction, if you don’t feel confident talking about your results then it’s a good indication that you don’t understand them fully or may need to revisit the dataset! Speaking about your results should feel natural when you explain what you’ve done.
- A good presentation always takes a lot of preparation. The more you practice presenting your content, the more confident you will be when the time comes. Practice with your housemates, friends, family, anyone that is free! Ask for feedback and keep improving until you’re happy with your presentation and you’re confident in presenting your content.
Let’s keep going, you’re nearly finished! |
3 Record your video | Record your videoIt is now time to record your presentation to the client. Remember, your presentation should be concise, engaging and should tell a compelling story. It should be no longer than 10 minutes. Recording the video may require a few attempts until you’re happy with it, but this task shouldn't take you longer than 30 minutes. While the recording functionality in this task won't allow you to share your slides as you speak, it will help you learn how to communicate and use eye contact when presenting. Let's record below! 
blob:https://www.theforage.com/de6c795e-4108-4089-bd50-dab9b4ba9519 |
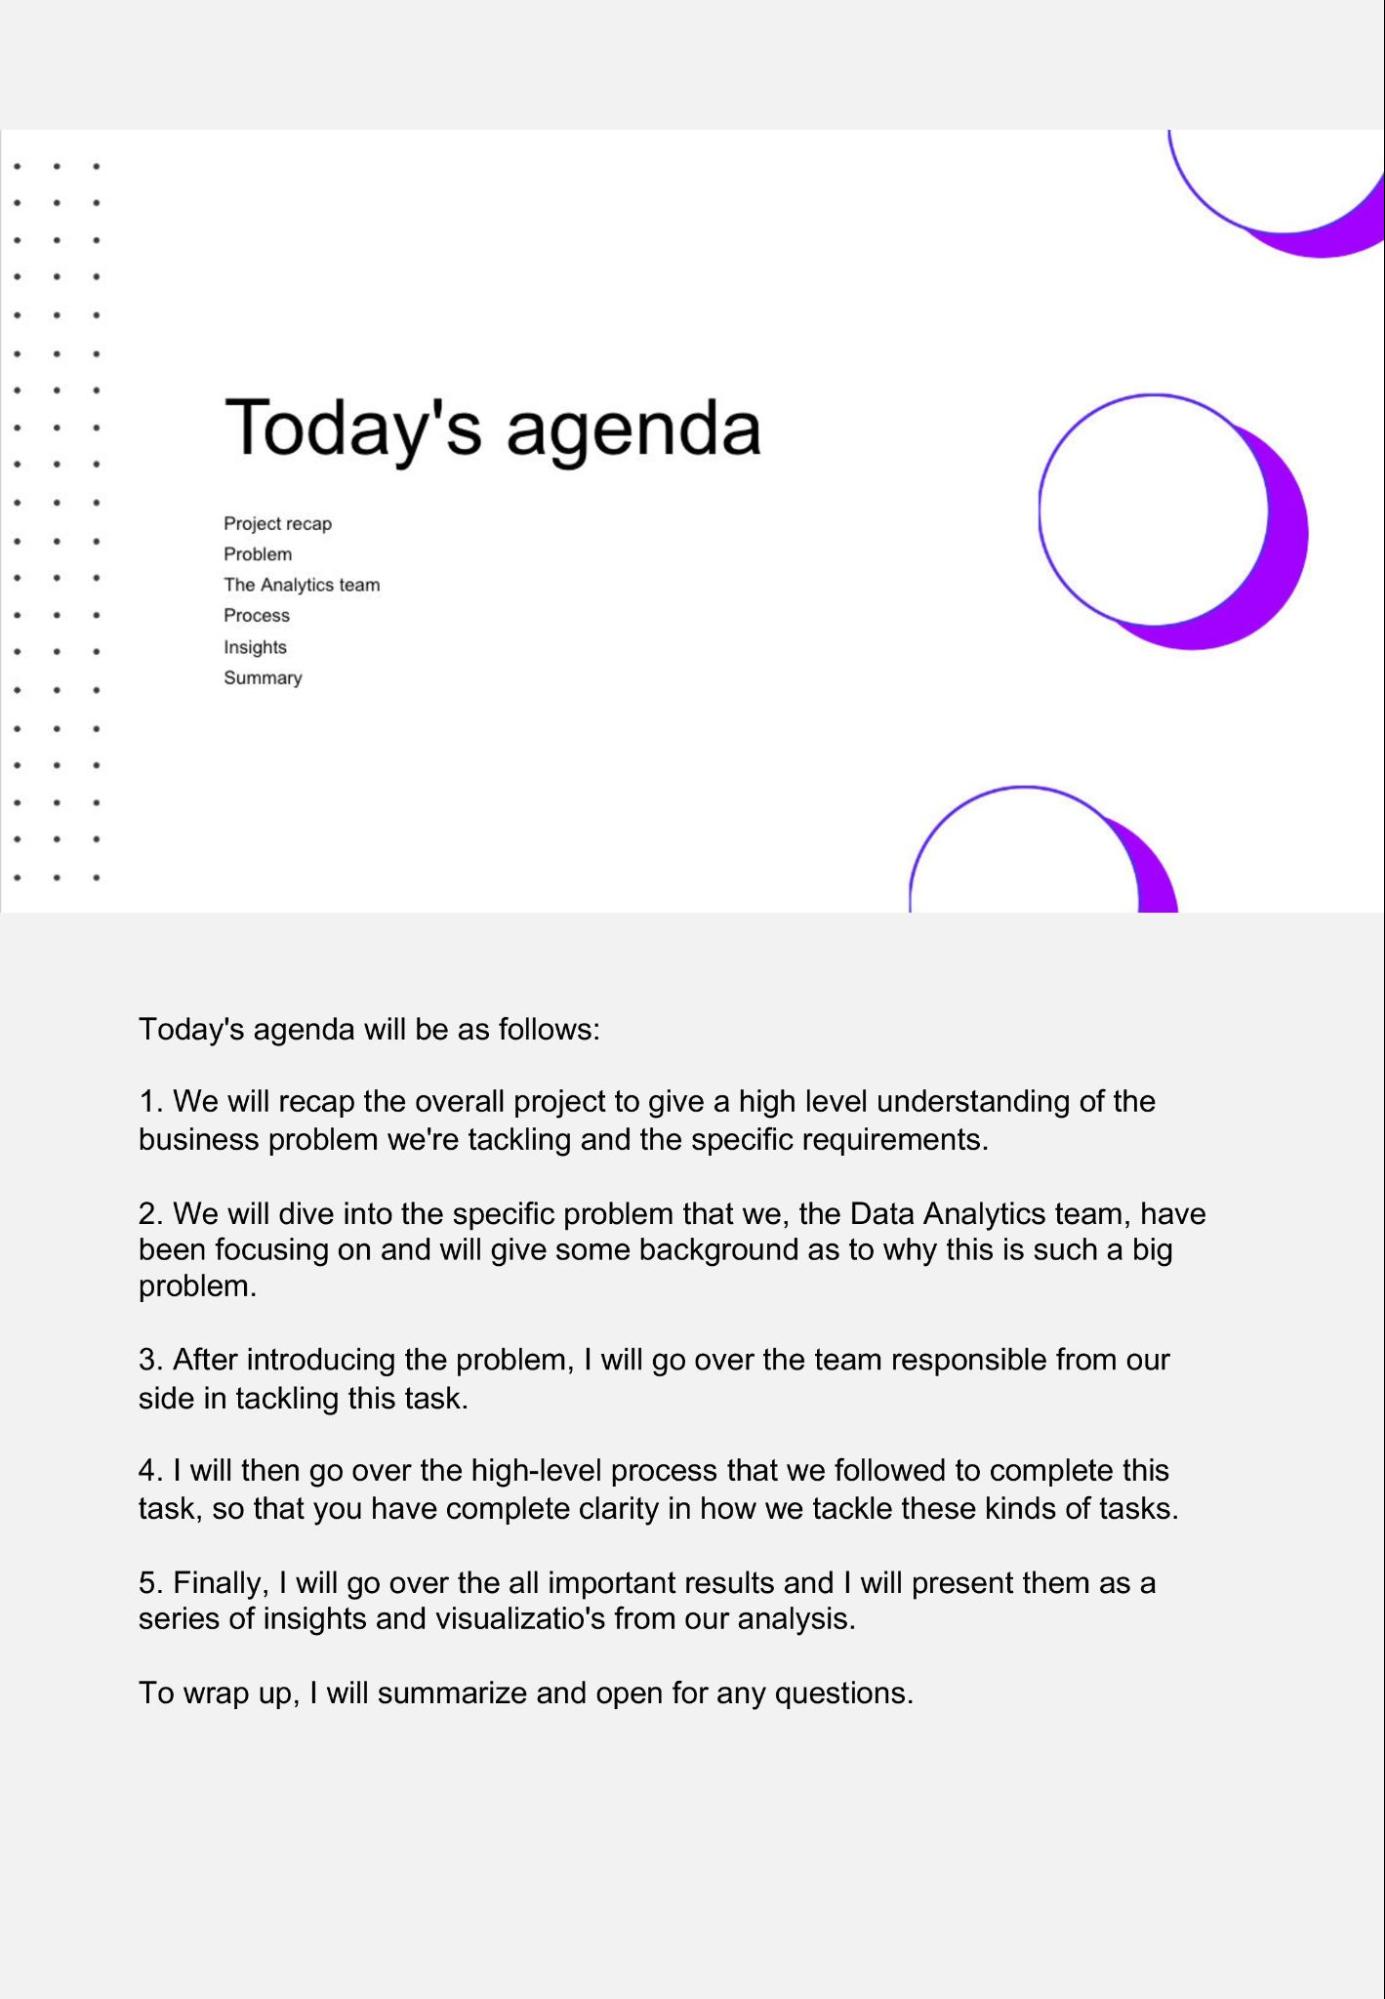
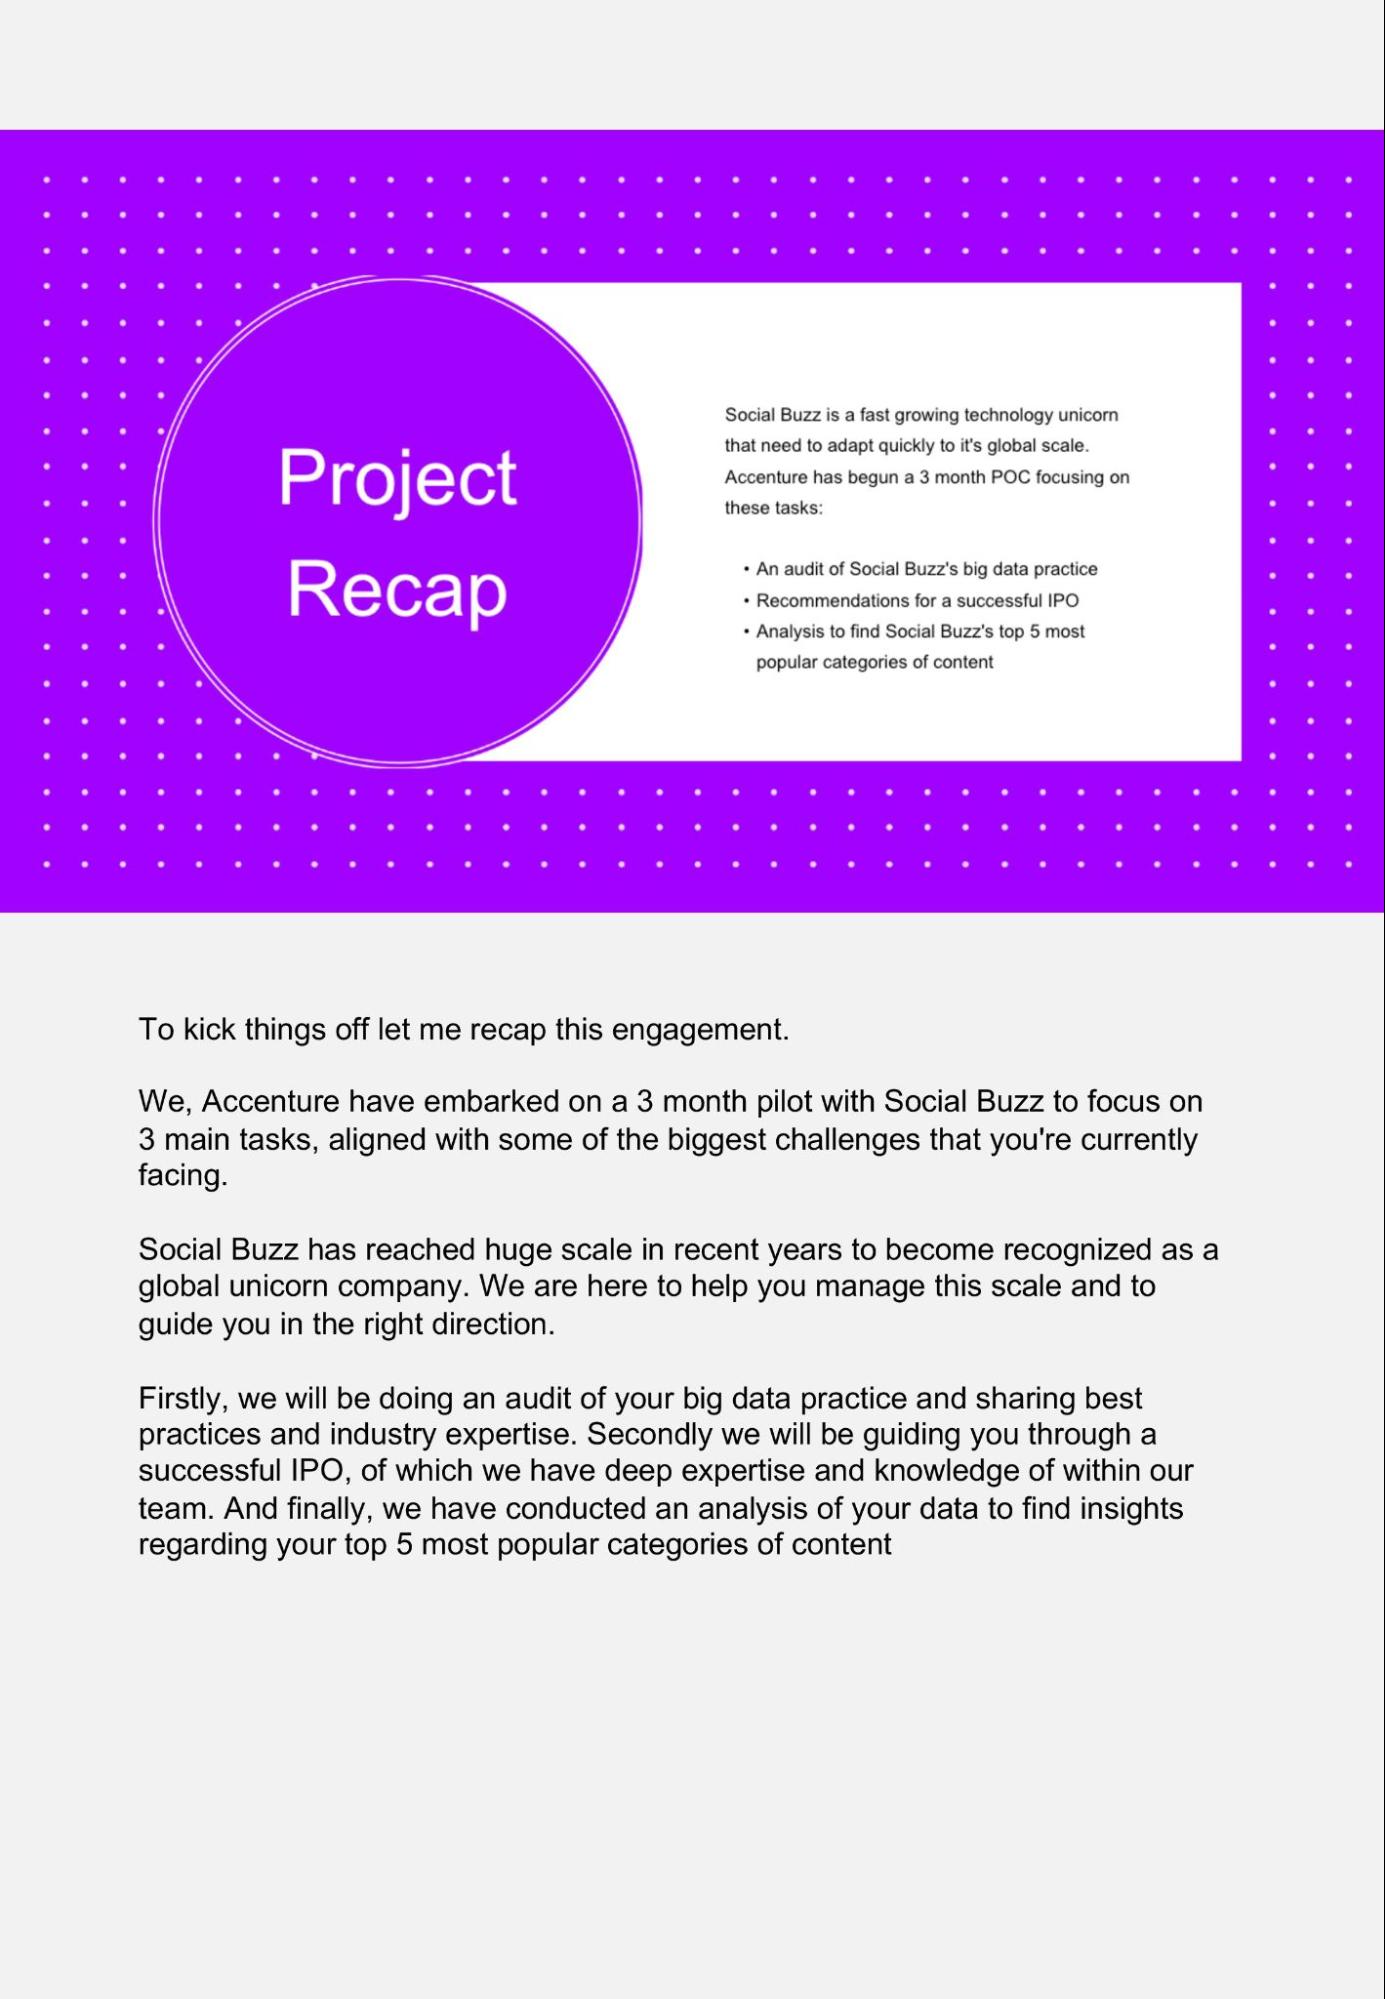
4 Presentation Example Answer | Presentation Example AnswerGreat work on your presentation. Watch this recording to see how you could have presented the insights.
If you approached it differently, that's okay! Everyone will have their own style - but you should always strive to speak clearly and confidently. 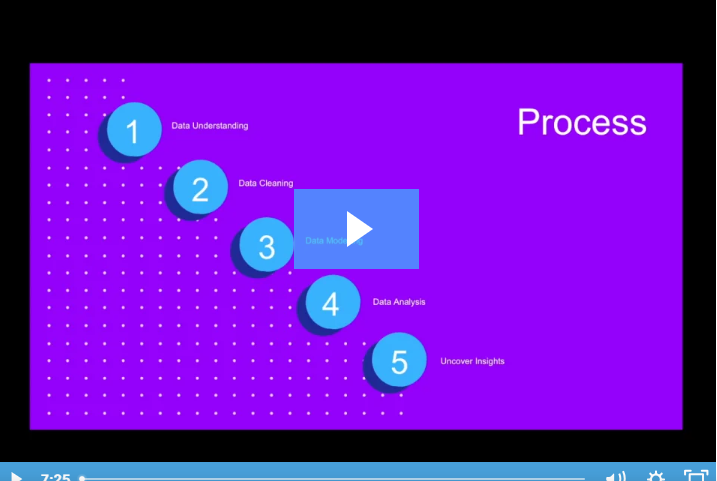
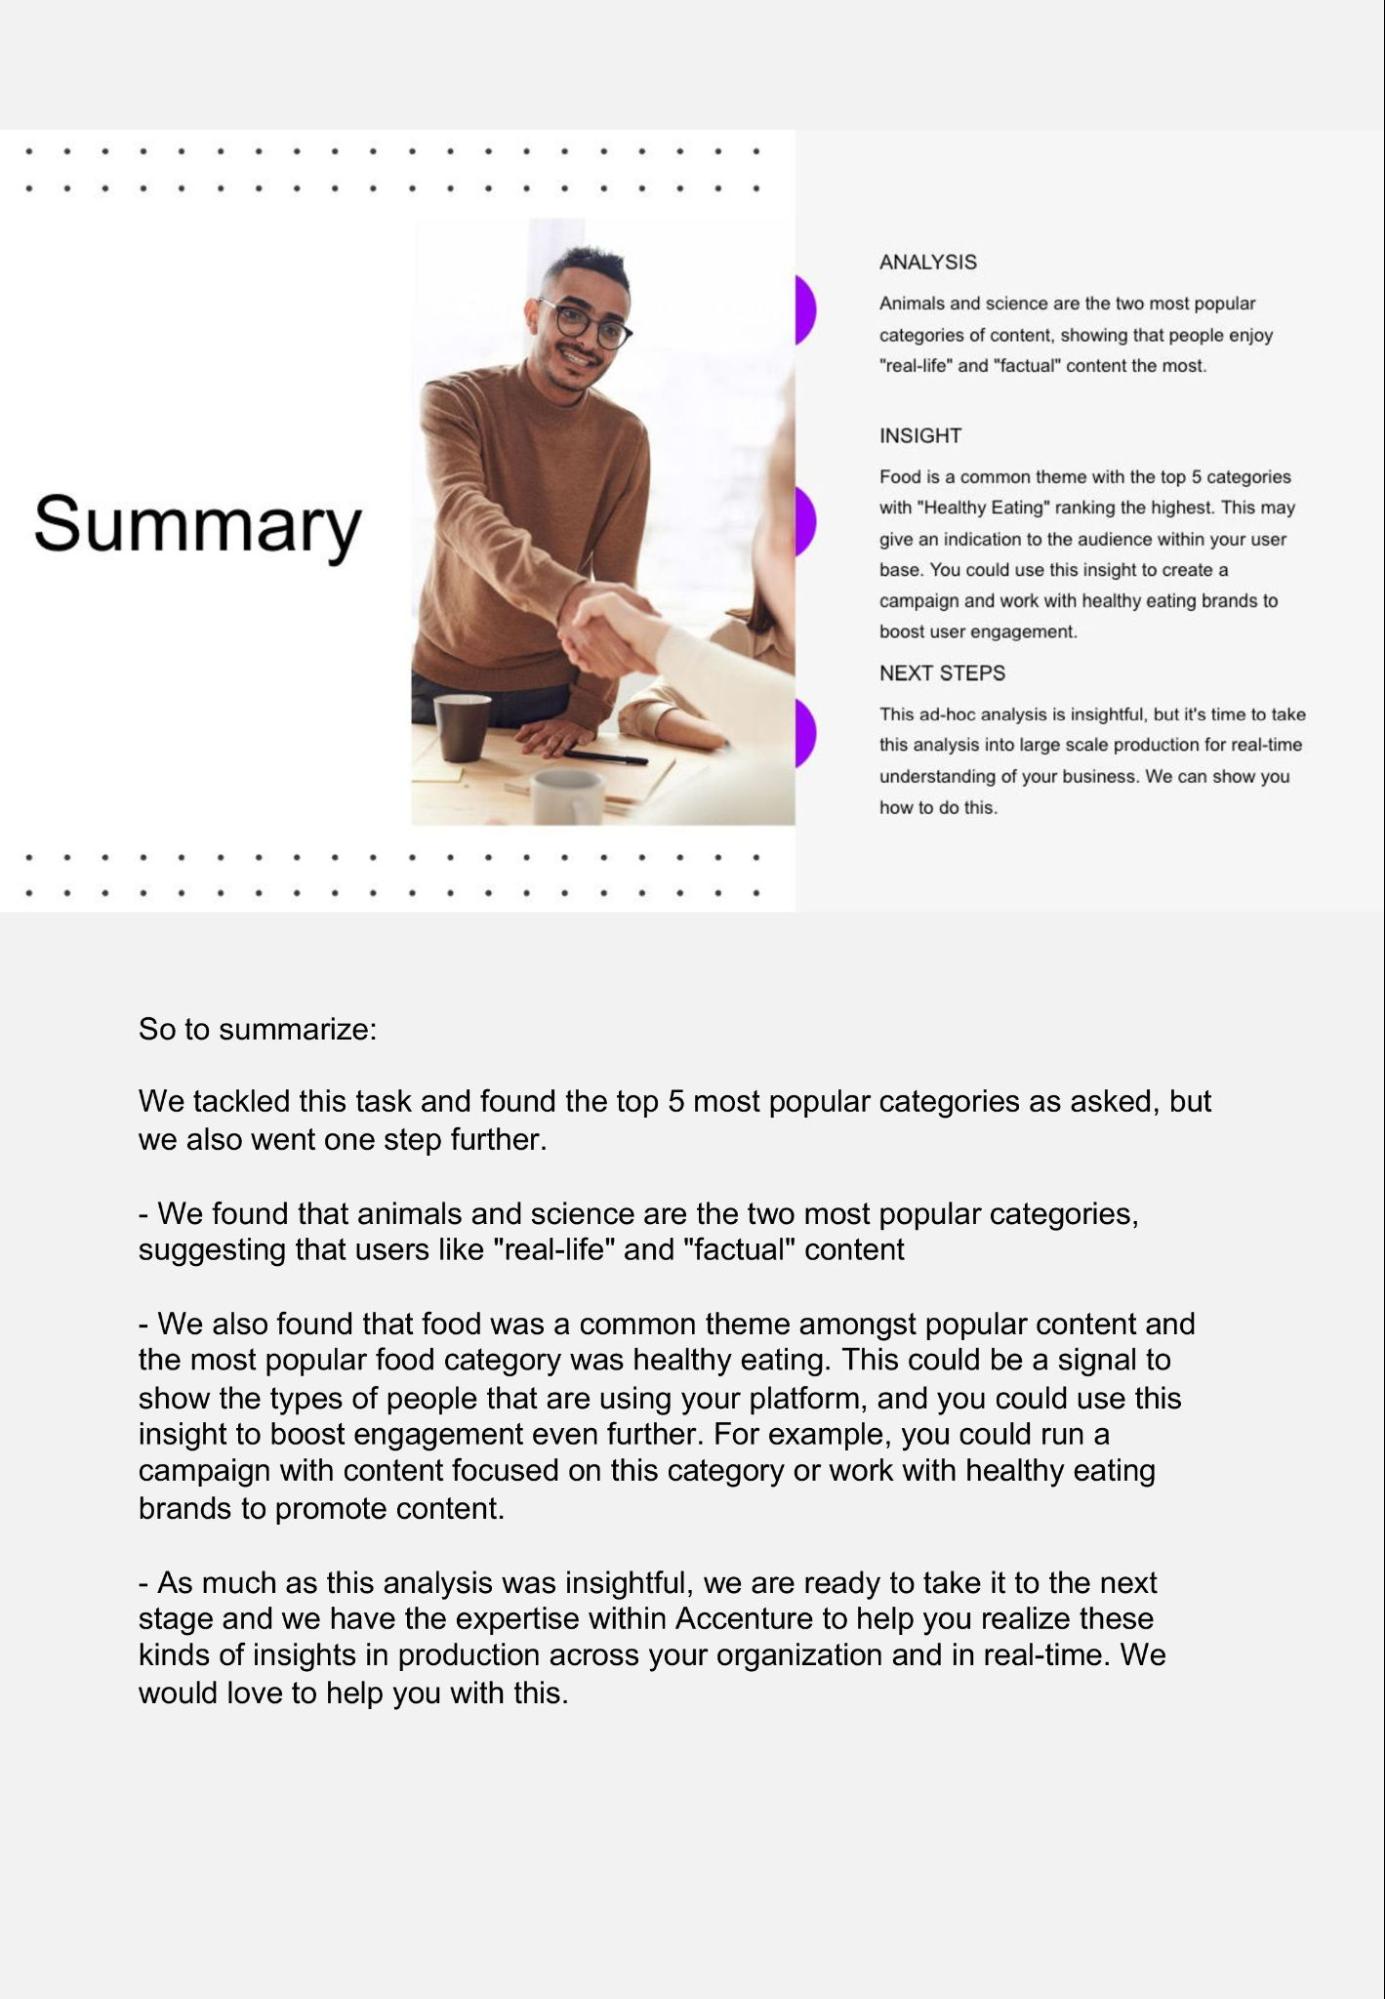
We’ve also attached a PDF with notes if you have trouble accessing the video.
Presentation with speaker notes Click to download file →
|
5 Completion | 
|
|
|
Finish Line: | Finish Line: Collect achievements |
1 Resume Snippet | Resume SnippetTake your updated resume and apply for Jobs , Programs , Events and Talent Networks . Accenture North America Data Analytics and Visualization Job Simulation on Forage - November 2024- Completed a simulation focused on advising a hypothetical social media client as a Data Analyst at Accenture
- Cleaned, modelled and analyzed 7 datasets to uncover insights into content trends to inform strategic decisions
- Prepared a PowerPoint deck and video presentation to communicate key insights for the client and internal stakeholders
Use our resume guidance here
|
2 Interview Tip | Interview TipIn a typical interview you’ll be asked “why are you interested in this role?” or “why are you interested in working at our company?”. Use this interview tip to explain why you want the job.“Why are you interested in this role?”I recently participated in Accenture’s Data Analytics & Visualization job simulation on the Forage platform, and it was incredibly useful to understand what it might be like to participate in a typical project team at Accenture, and to use Excel and data analytics and visualization skills in a realistic context. Through this program I realized that I really enjoy cleaning, modelling and analyzing client data, creating slides to communicate findings and presenting insights back to the client. I would love to apply what I've learned in a diverse project team at a company like Accenture.
|