(Forage Job Simulation)
Note Prepared by Mudalige Dona Jayoda Jithmini Kulatunga Undergraduate Student Pearson B.Tech Higher National Diploma (HND) in Computing - Software Engineering ESFOT Metro Campus Colombo, Sri Lanka. |
Check out the simulation here: https://www.theforage.com/simulations/pwc-ch/power-bi-cqxg |
nimbler - චාටු, Quick and light in movement or action. resilient - ප්රතිසාධක, Able to recover quickly from difficulties. intuitive - අන්තර්දෘෂ්ටිමත්, Based on instinct rather than reasoning. Accelerator - වේගකරු, A device or action that increases speed. omnipresent - සර්වවිප්රකෘත, Present everywhere at the same time. urbanites - නාගරිකයින්, People living in cities. abandoned - අත්හැර, Left behind or deserted. quadrant - කෝෂ්ඨයක්, A quarter of a circle or an area divided into four parts. inclusion - සම්මෙශ්රණය, The act of including or being included. heterogeneous - විවිධාකාර, Made up of different kinds or types. imperatives - අත්යවශ්යතා, Things that are absolutely necessary. |
Introduction | Power BIGet your Power BI skills in shape with PwC. Data Free 25400+ 5 Star Reviews Get Career ReadyComplete work that simulates life on the job. 5-6 hours and self-paced. Stand out in your application to PwC Switzerland. Show us you're a motivated candidate. |
Why complete our Job Simulation | Why complete our Job SimulationA risk-free way to experience work on the job with us at PwC Switzerland. Practice your skills with example tasks and build your confidence to ace your applications. Self-paced 5-6 hours No grades No assessments Intermediate Fiddling around in Excel sheets just doesn’t suit a digital jedi. In Switzerland, PwC’s Digital Upskilling Academy helps our people move from zero to digital hero. PwC is upskilling 284,000 people because the right digital skills make us agile, adaptable and fit for the future. We use powerful Data Analytics tools to help solve business problems for our clients. Learning to master Power BI is a good first step. By empowering you to identify patterns, risks and opportunities in data, you will work more efficiently. You will be able to clearly visualise the value of data and turn it into convincing, actionable insights. |
Skills you will learn and practice: | Skills you will learn and practice:Self-Reflection, Defining KPIs, Power BI Dashboard, Power BI, Insights and Actions, Calculating Measures, Insight and Actions |
How it works | How it worksComplete tasks guided by pre-recorded videos and example answers from our team at PwC Switzerland. No live sessions, all self-paced. Earn a certificate and add it to your resume and LinkedIn as an extra curricular activity. Stand out in applications. Confidently answer interview questions and explain why you’re a good fit for our team. |
Tasks in this program | Task One: Introduction30-60 mins Intermediate What you'll learn
What you'll do
Task Two: Call Centre Trends1-2 hours Intermediate Visualising customer and agent behaviour. What you'll learn
What you'll do
Task Three: Customer Retention1-2 hours Intermediate Customer demographics and insights. What you'll learn
What you'll do
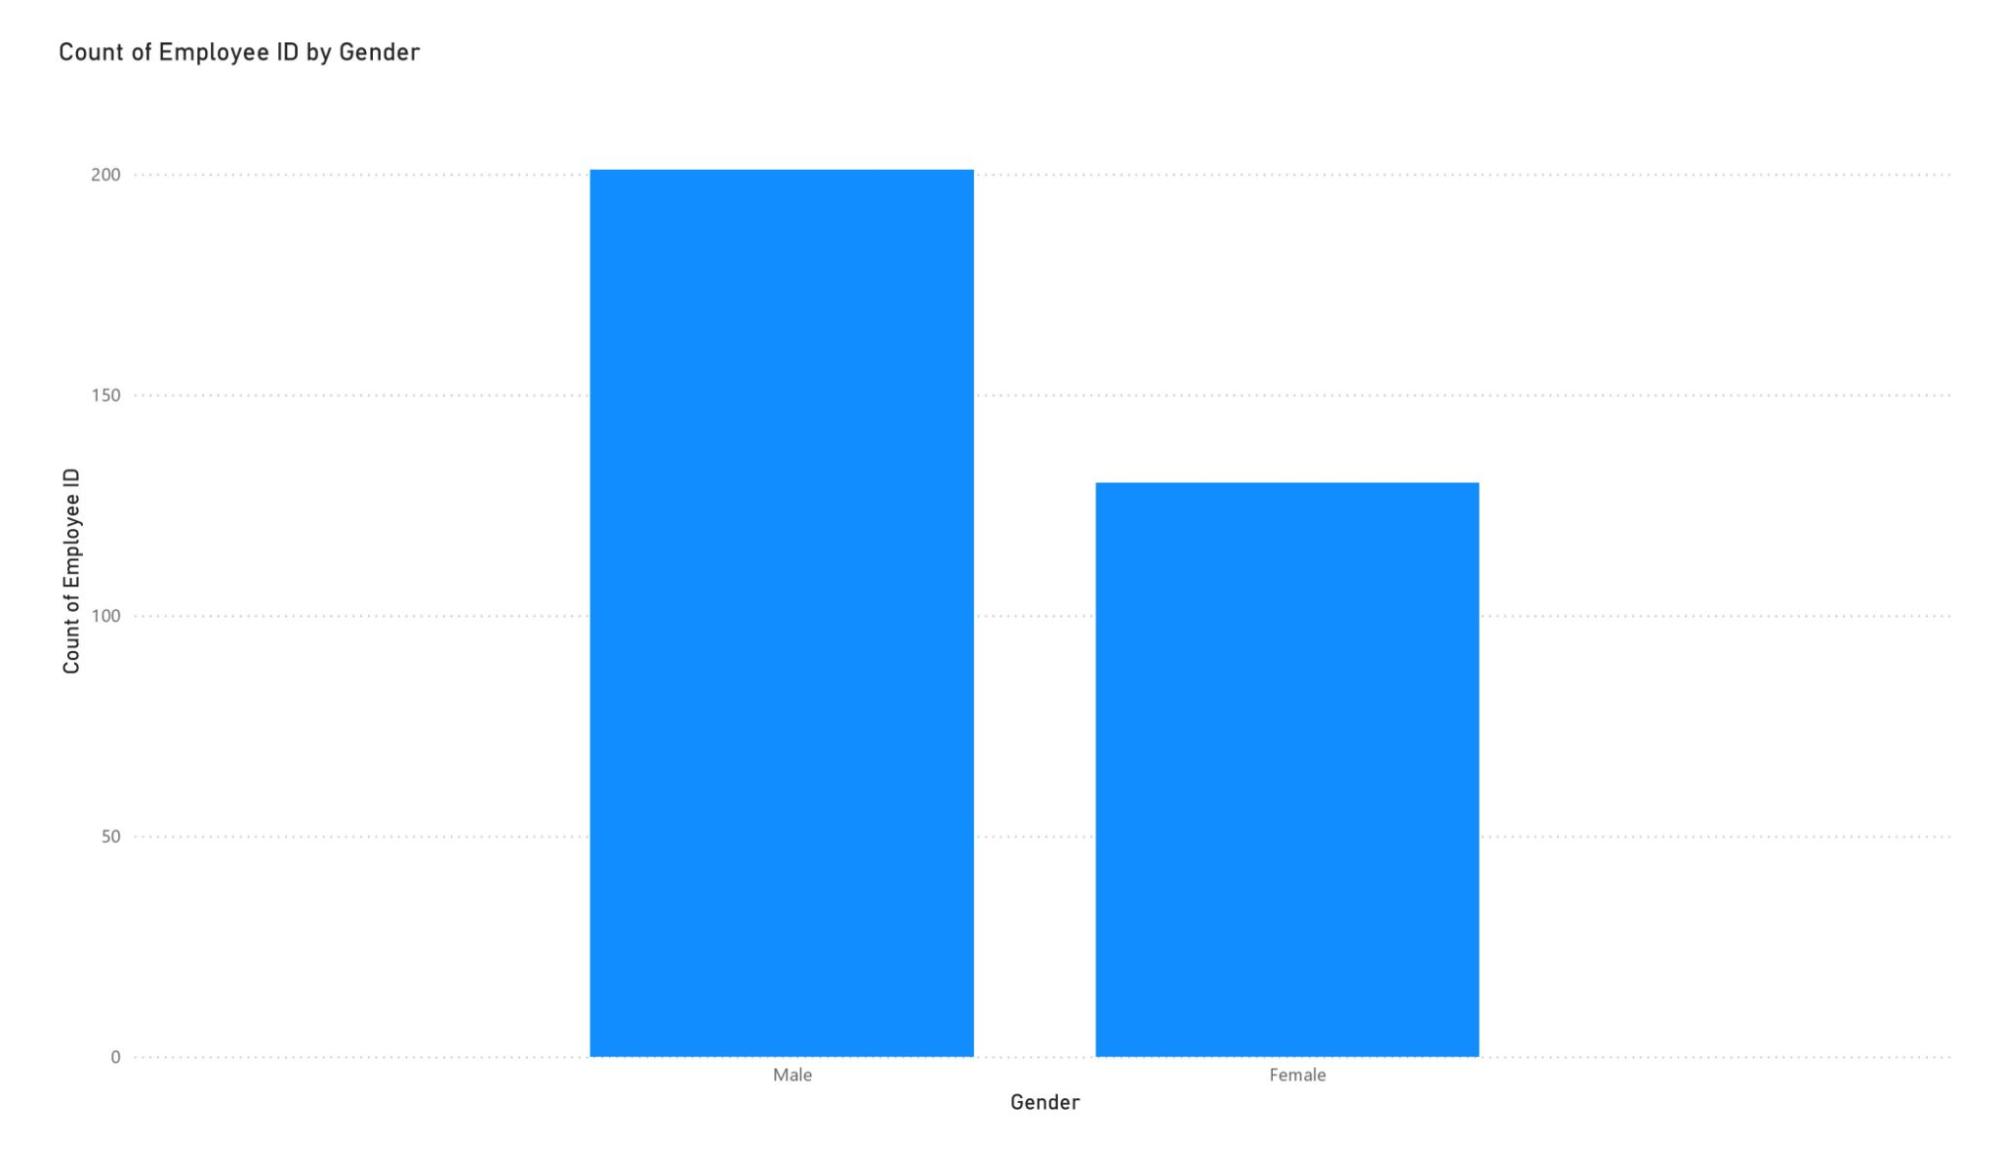
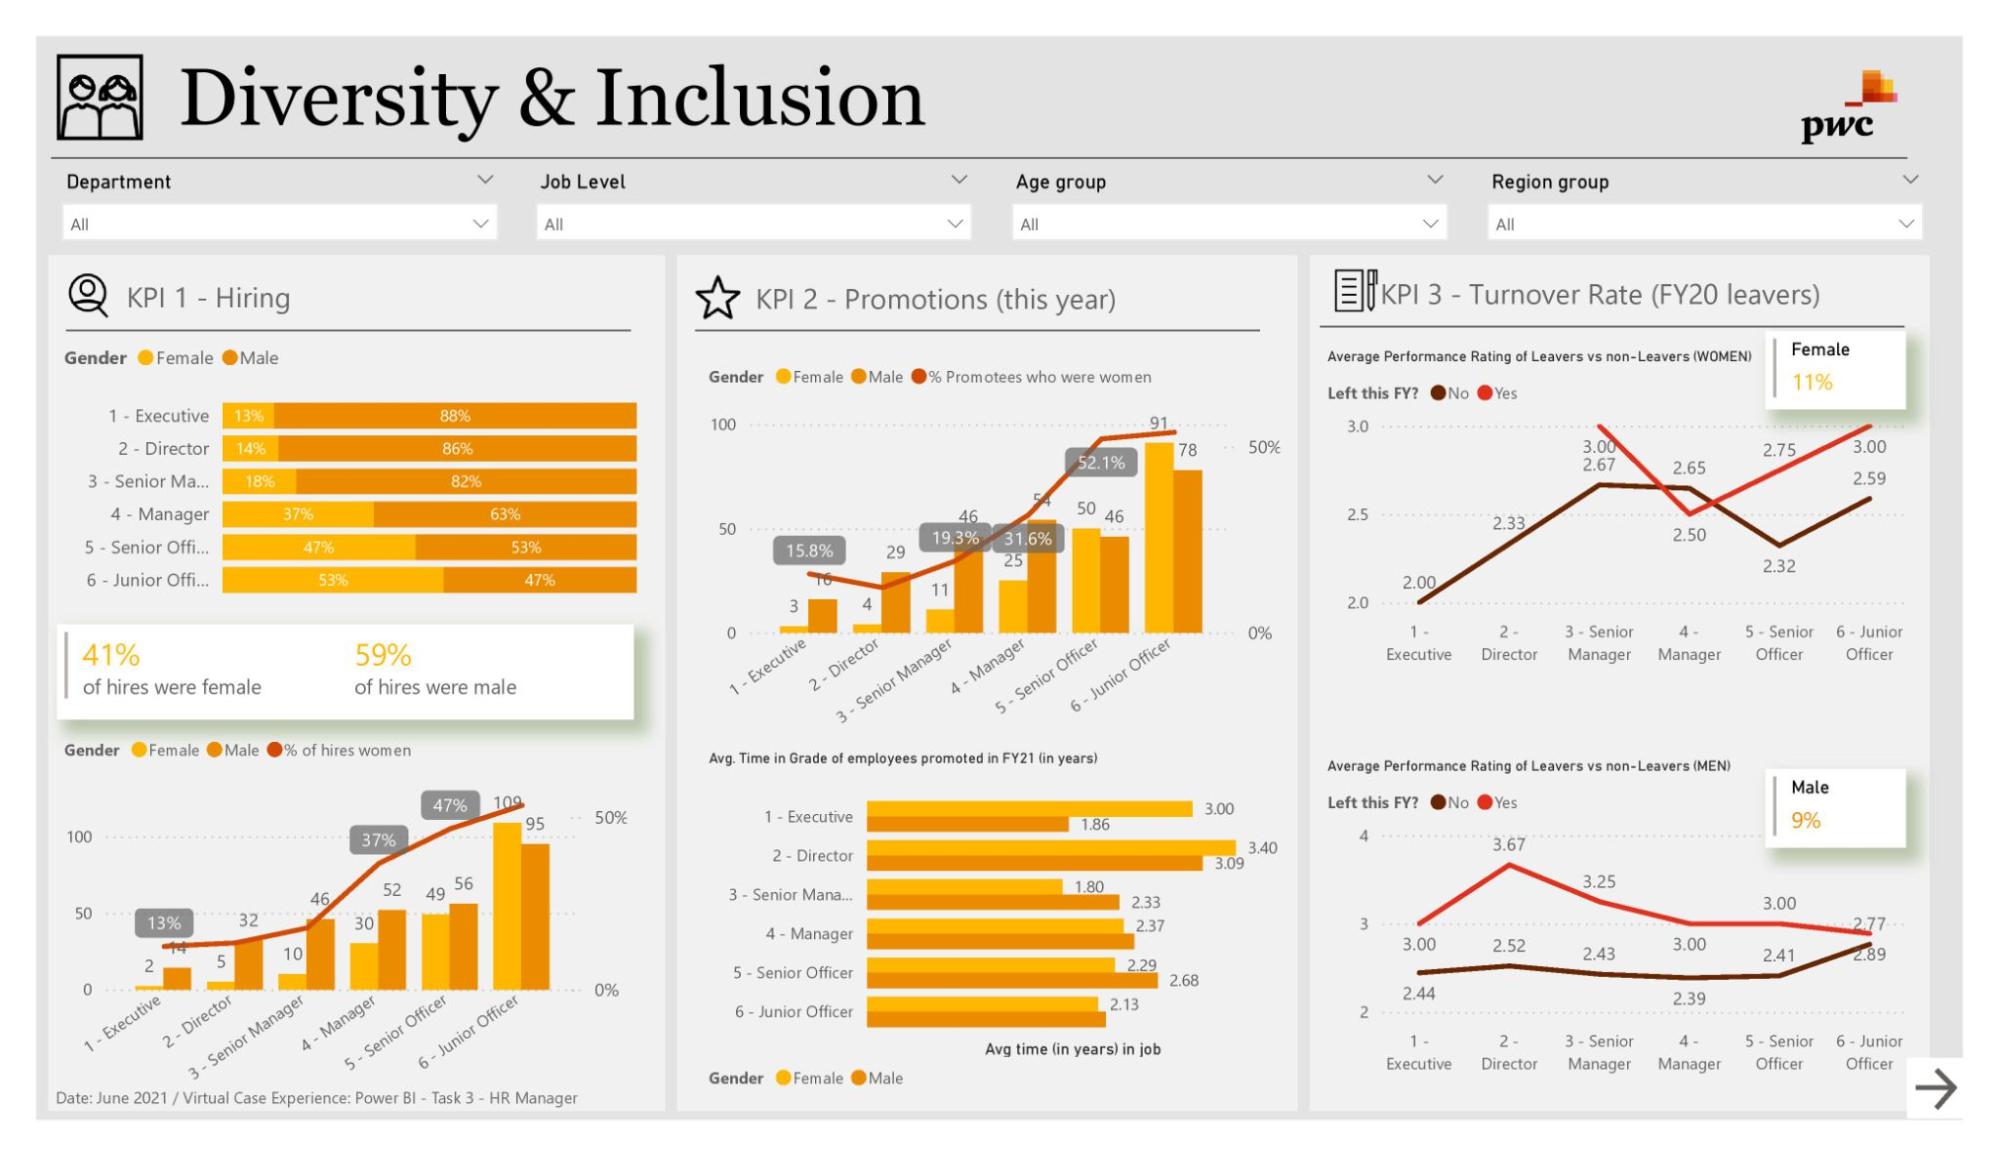
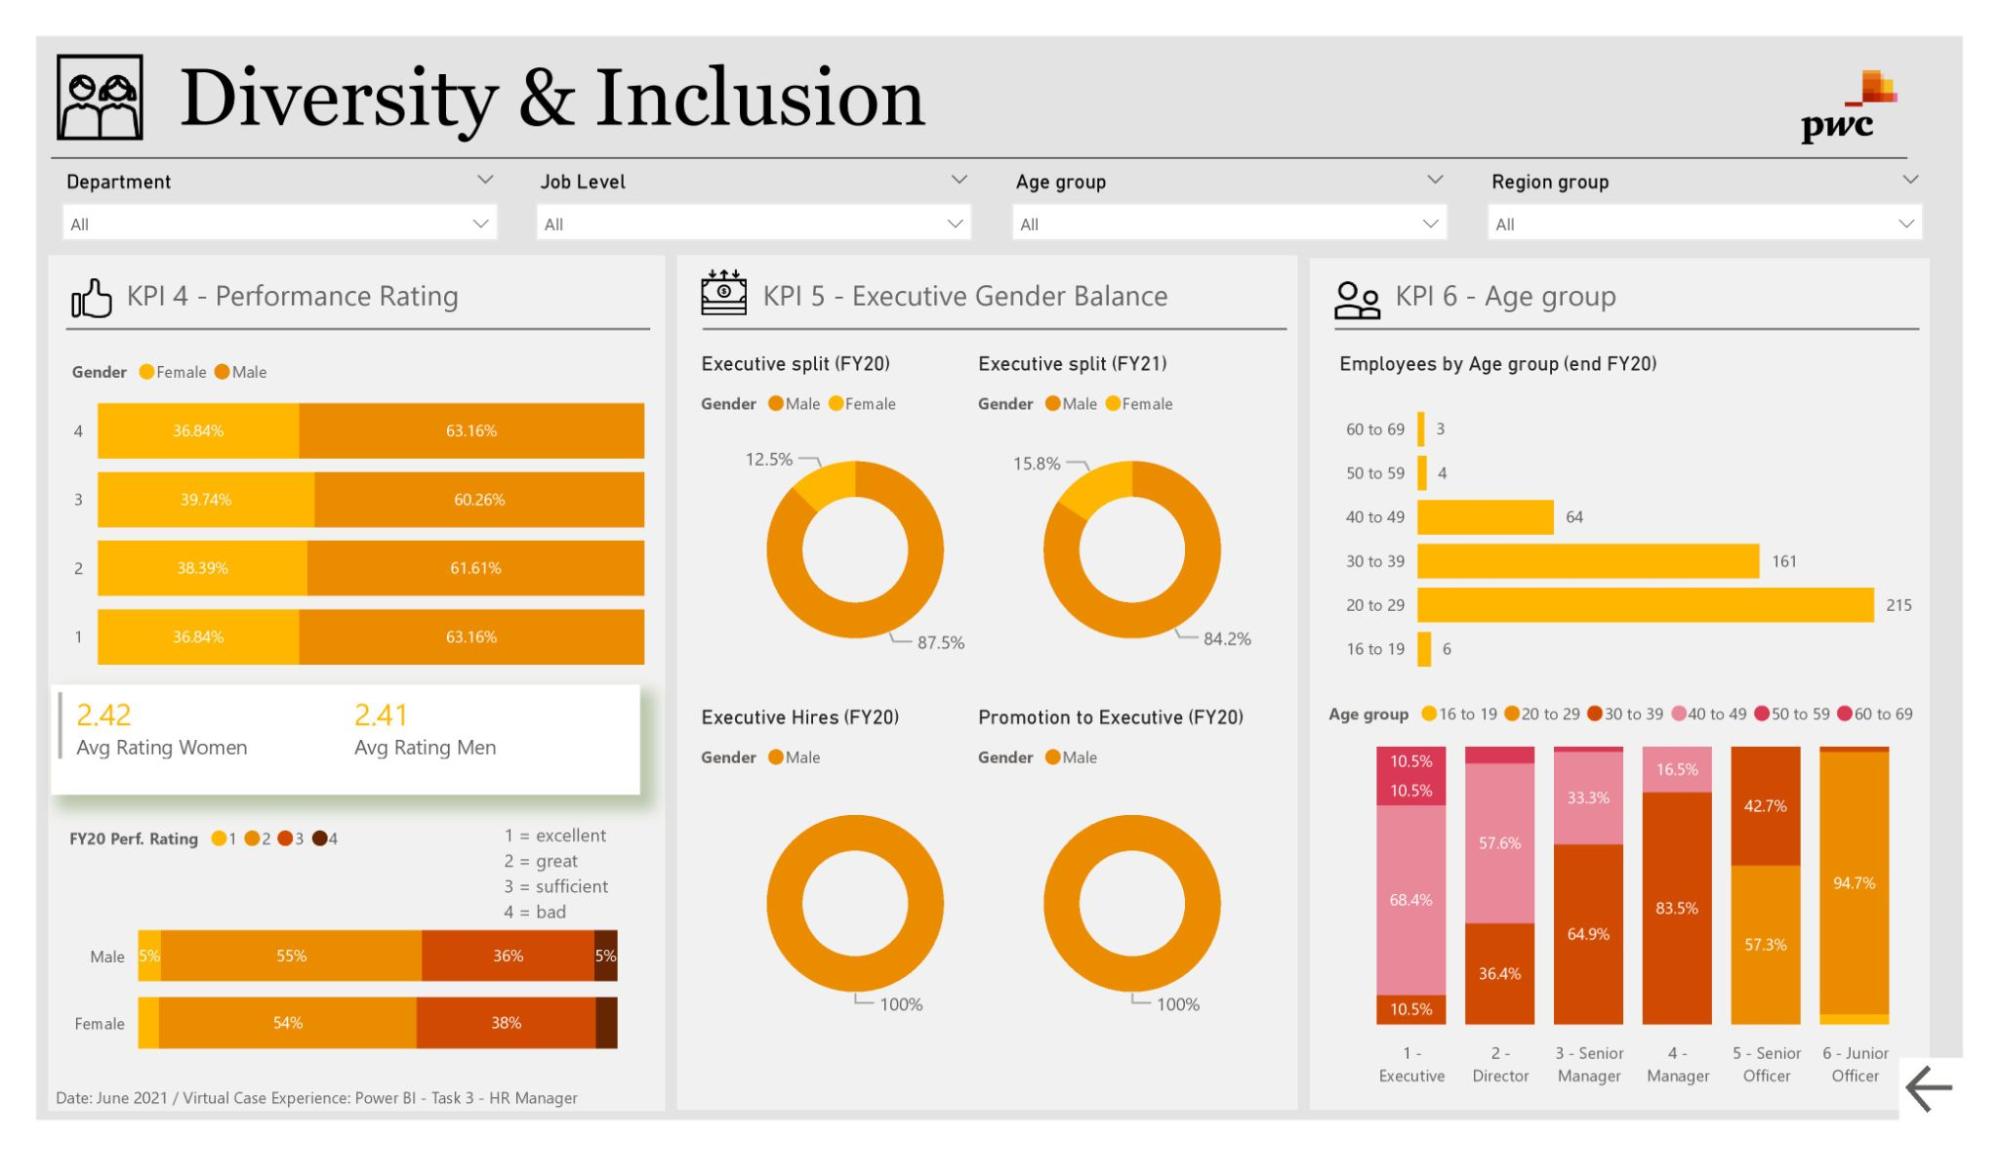
Task Four: Diversity & Inclusion1-2 hours Intermediate Gender balance in the executive suite. What you'll learn
Finish LineCollect these achievements and tips to help you stand out in your job search.Interview TipsHow to talk about this experience in your interviews.Resume SnippetA summary ready for your resume. |
Task One: Introduction | |
1 Task Overview | Task OverviewWhat you'll learn
What you'll do
|
2 Here is the background information on your task | Here is the background information on your taskAll in on digital transformation: Creating a stronger, nimbler, more resilient future! We aim to build innovative technology solutions that differentiate us from our competitors and digitise the business. Part of that included a strategic decision to invest in upskilling programmes so our people could learn how to use digital tools for data visualisation as well as automation, data cleansing and more. If our people could use these tools to solve common problems, they’d help us become more efficient and growth-oriented now and more innovative later in Business Services and beyond. Now, employees are learning to build bots – over 2,400 have been created so far – to automate workflows. We continue to invest to make processes more intuitive using machine learning, PowerBI and eventually artificial intelligence (AI). These are key to working faster and solving problems differently for ourselves and our clients. This is why you're here! Our Digital Accelerator programme is an internal chance that takes groups of our employees out of their day jobs and puts them through trainings that teaches them skills in technology such as automation, machine learning, design thinking, and digital storytelling. PowerBI is an important part of it as visualising data helps to handle and understand clients. So, become a Digital Accelerator yourself and start your PowerBI journey with us! |
3 Here is your task | Here is your taskBut before you start, we would love to hear from you. Let’s set the mood to start your experience in Power BI. First, watch the video ‘New world. New skills. PwC's journey to drive a digital mindset’ for inspiring insight on Digital Upskilling and the next video to hear from our Global Chairman, before kick-starting your journey through this program. Next, navigate to the next page and respond to the self-reflection question by filling out the provided text field. No additional resources are required. |
4 Question | Tell us, what do you hope to learn during this experience with us?We're so excited for you to start your Job Simulation!
|
5 Completion | |
Task Two: Call Centre Trends | |
1 Task Overview | Task OverviewWhat you'll learn
What you'll do
|
2 Here is the background information on your task | Here is the background information on your taskThe digital revolution and our fast-changing world requires a skills revolution. And it’s not just about the digital skills. The skills revolution is about helping people build their digital awareness, emotional intelligence and creativity to fully participate in the digital future workplace — and it needs to start now. At PwC, we are working with other organisations across the world, building on our work with clients and on upskilling our 276,000 people. Still, more must be done if we are to ensure everyone has the opportunity to learn, work and participate in the digital world. This is at the heart of our purpose. We are enabling employees who are motivated to further accelerate their skills to do so by offering them a “career pivot” to become what we call “Digital Accelerators”. Accelerators rapidly deepen their skills in digital specialties, such as data, automation, AI, and digital storytelling by learning a variety of self-service tools and coding languages and applying these skills across our business. We're happy you joined us, welcome to the team! Giulia is your manager and helps you through your upskilling journey in PowerBI - your step to become a true data jedi and Digital Accelerator. But wait no more, word spreads fast and an important client reached out to you to help him visualising their data. |
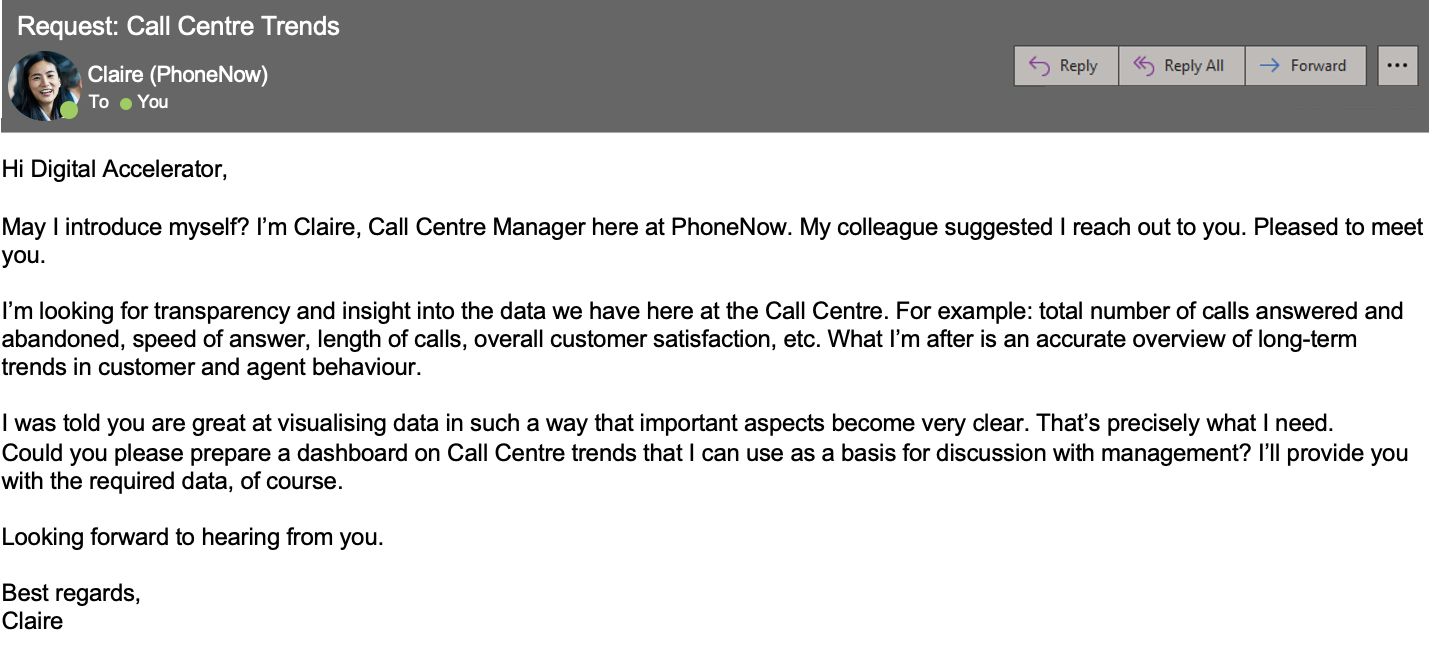
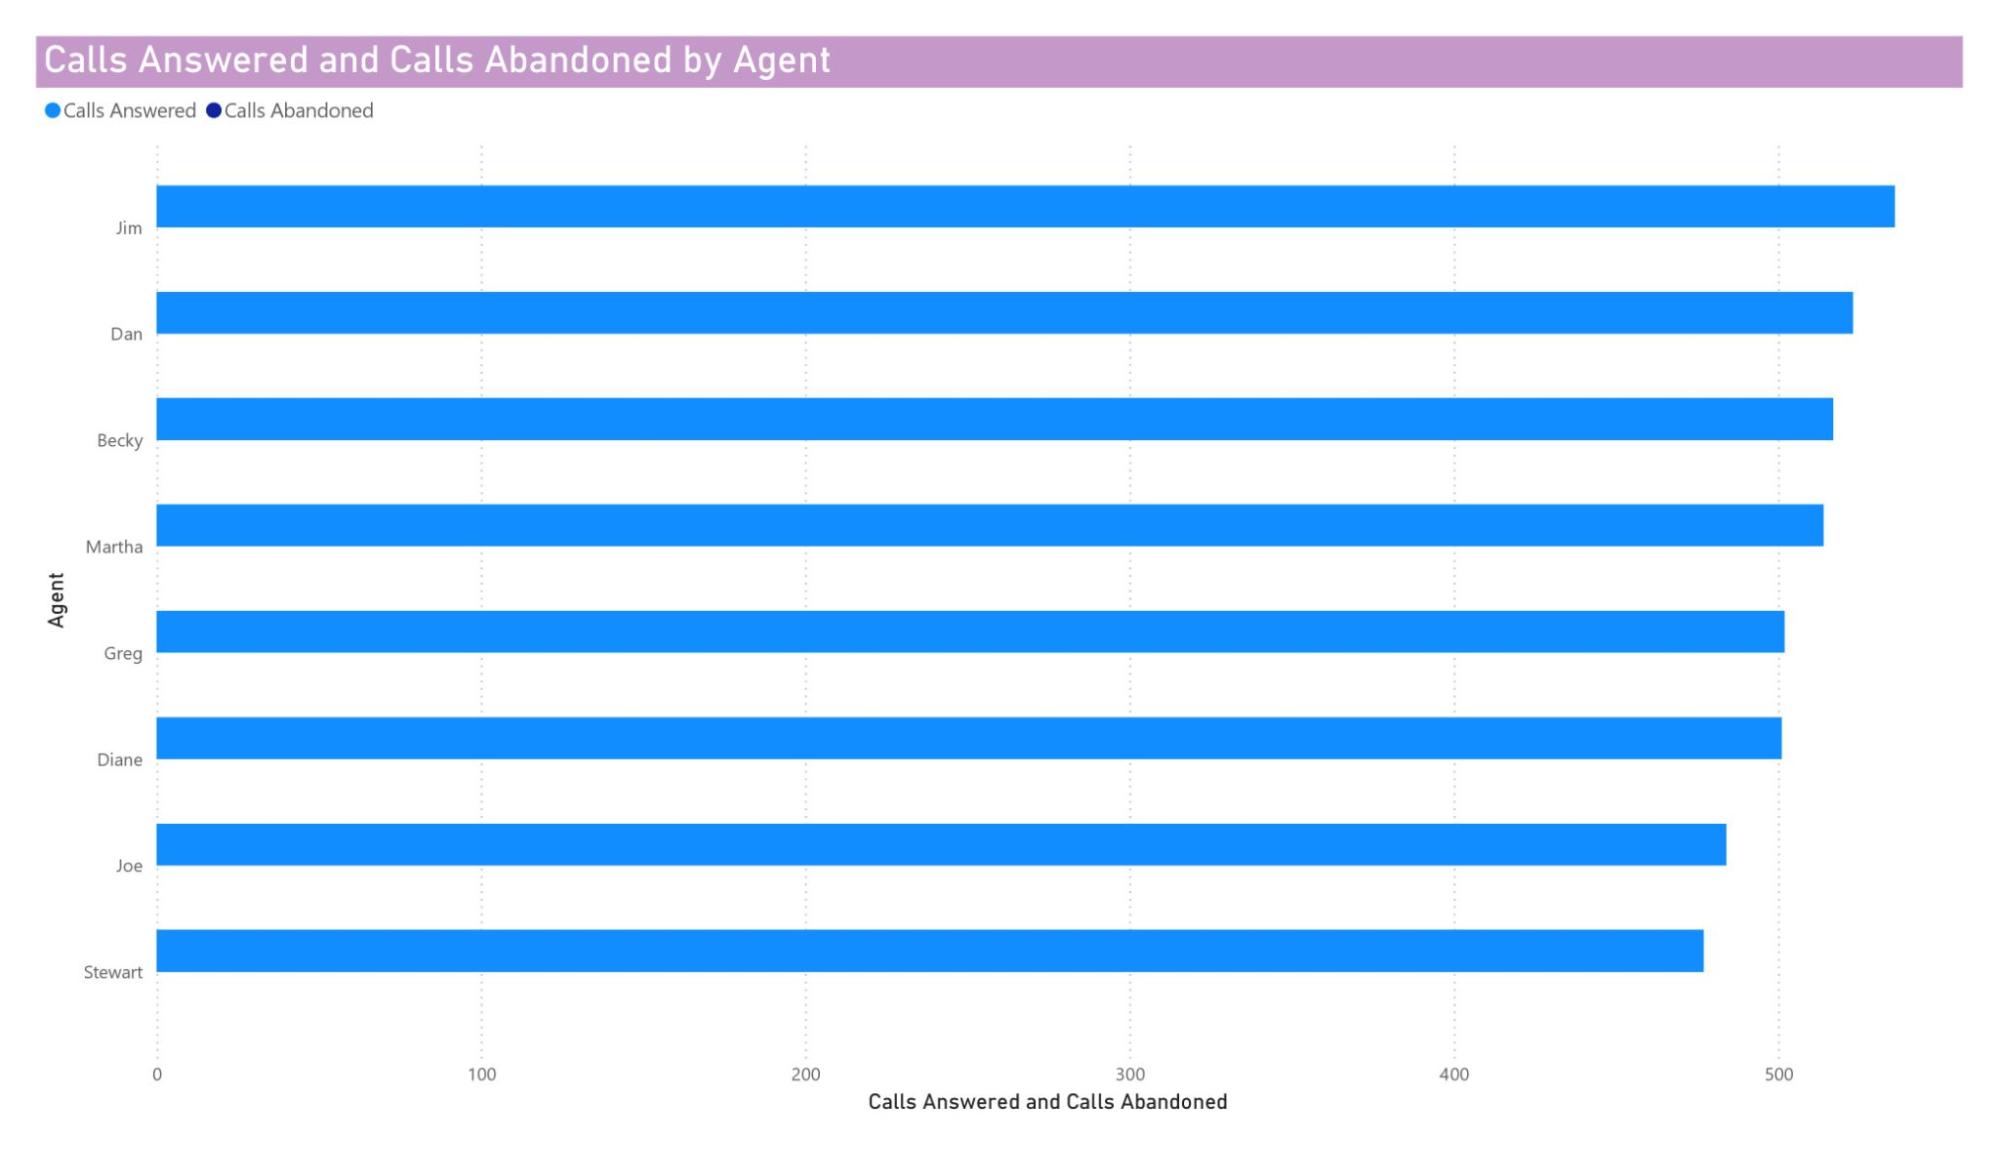
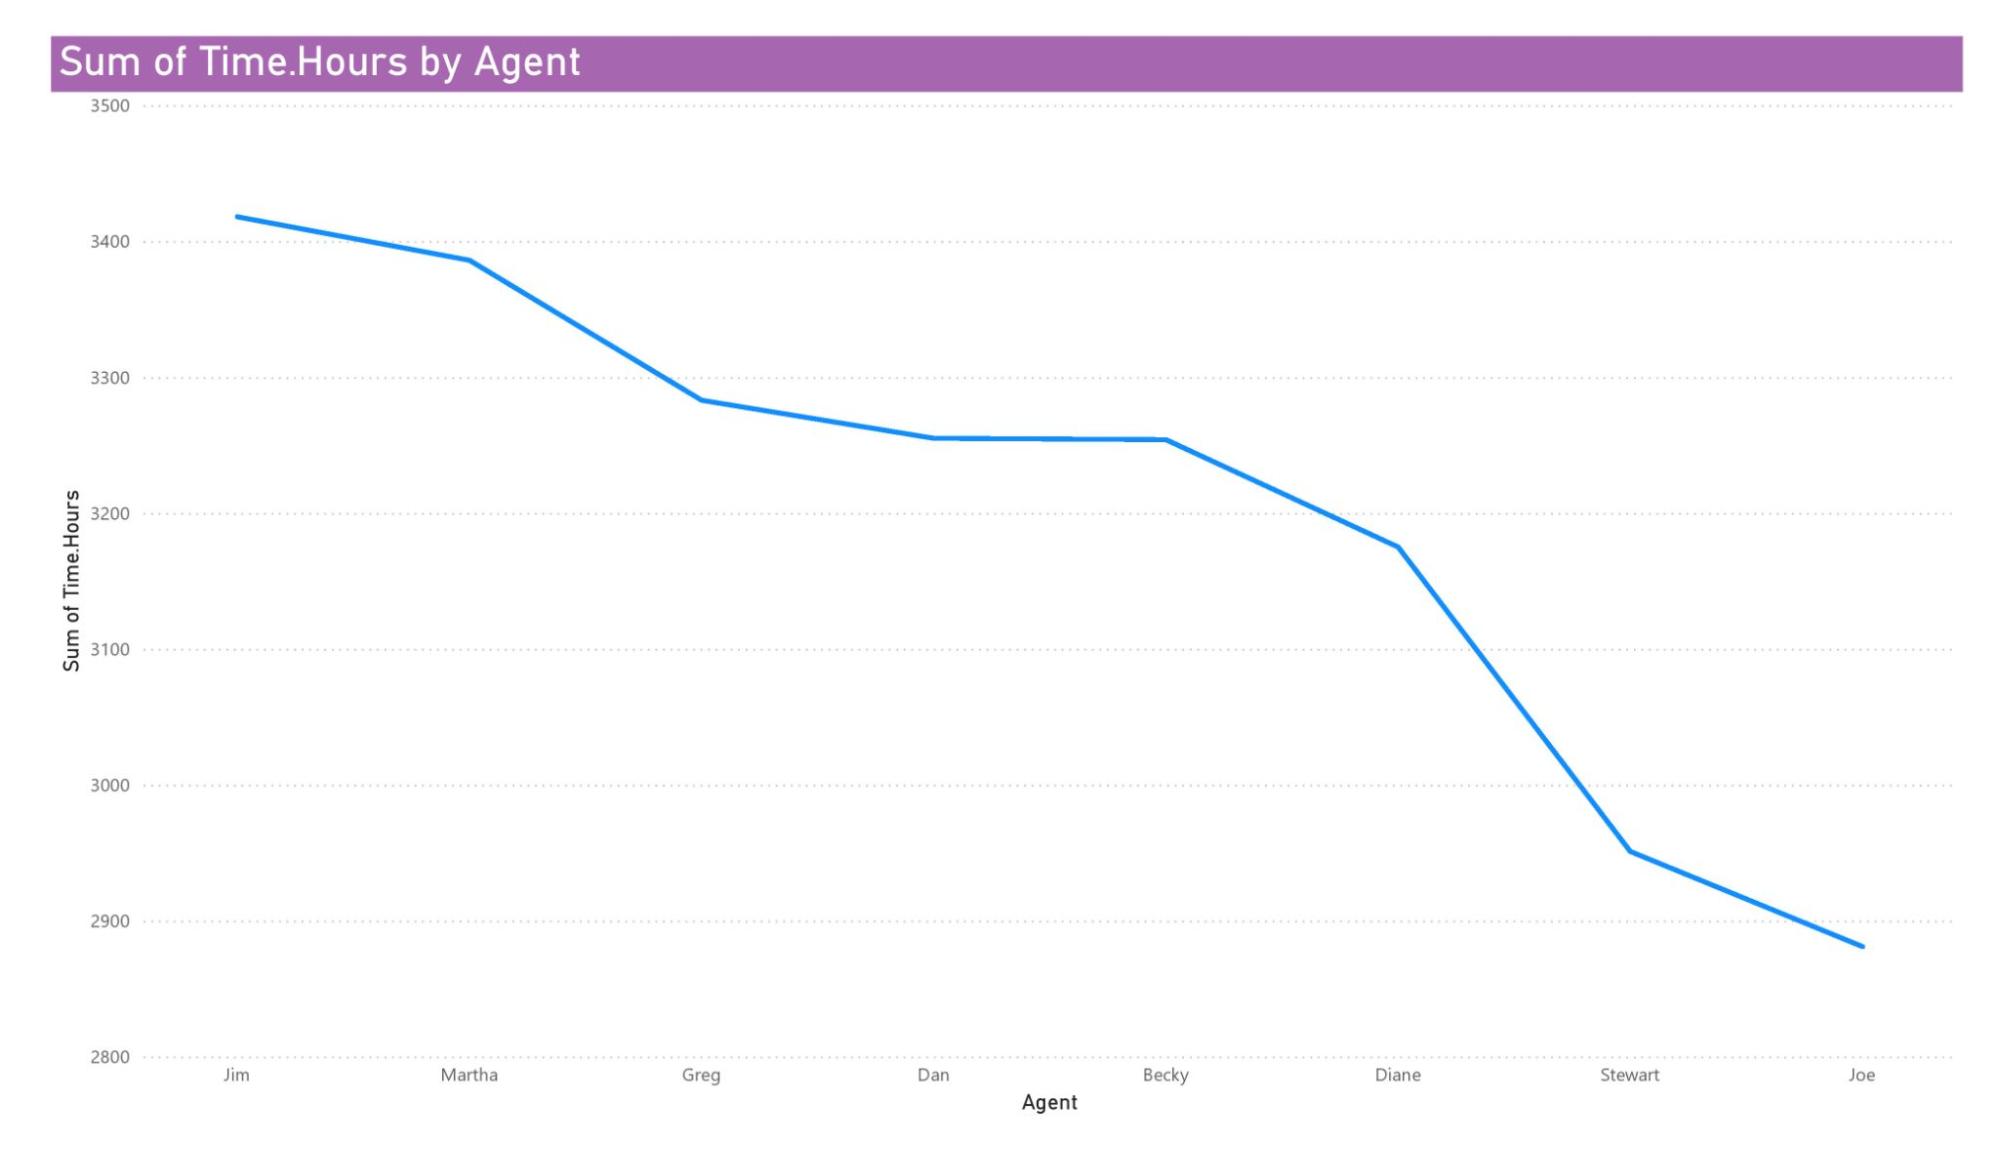
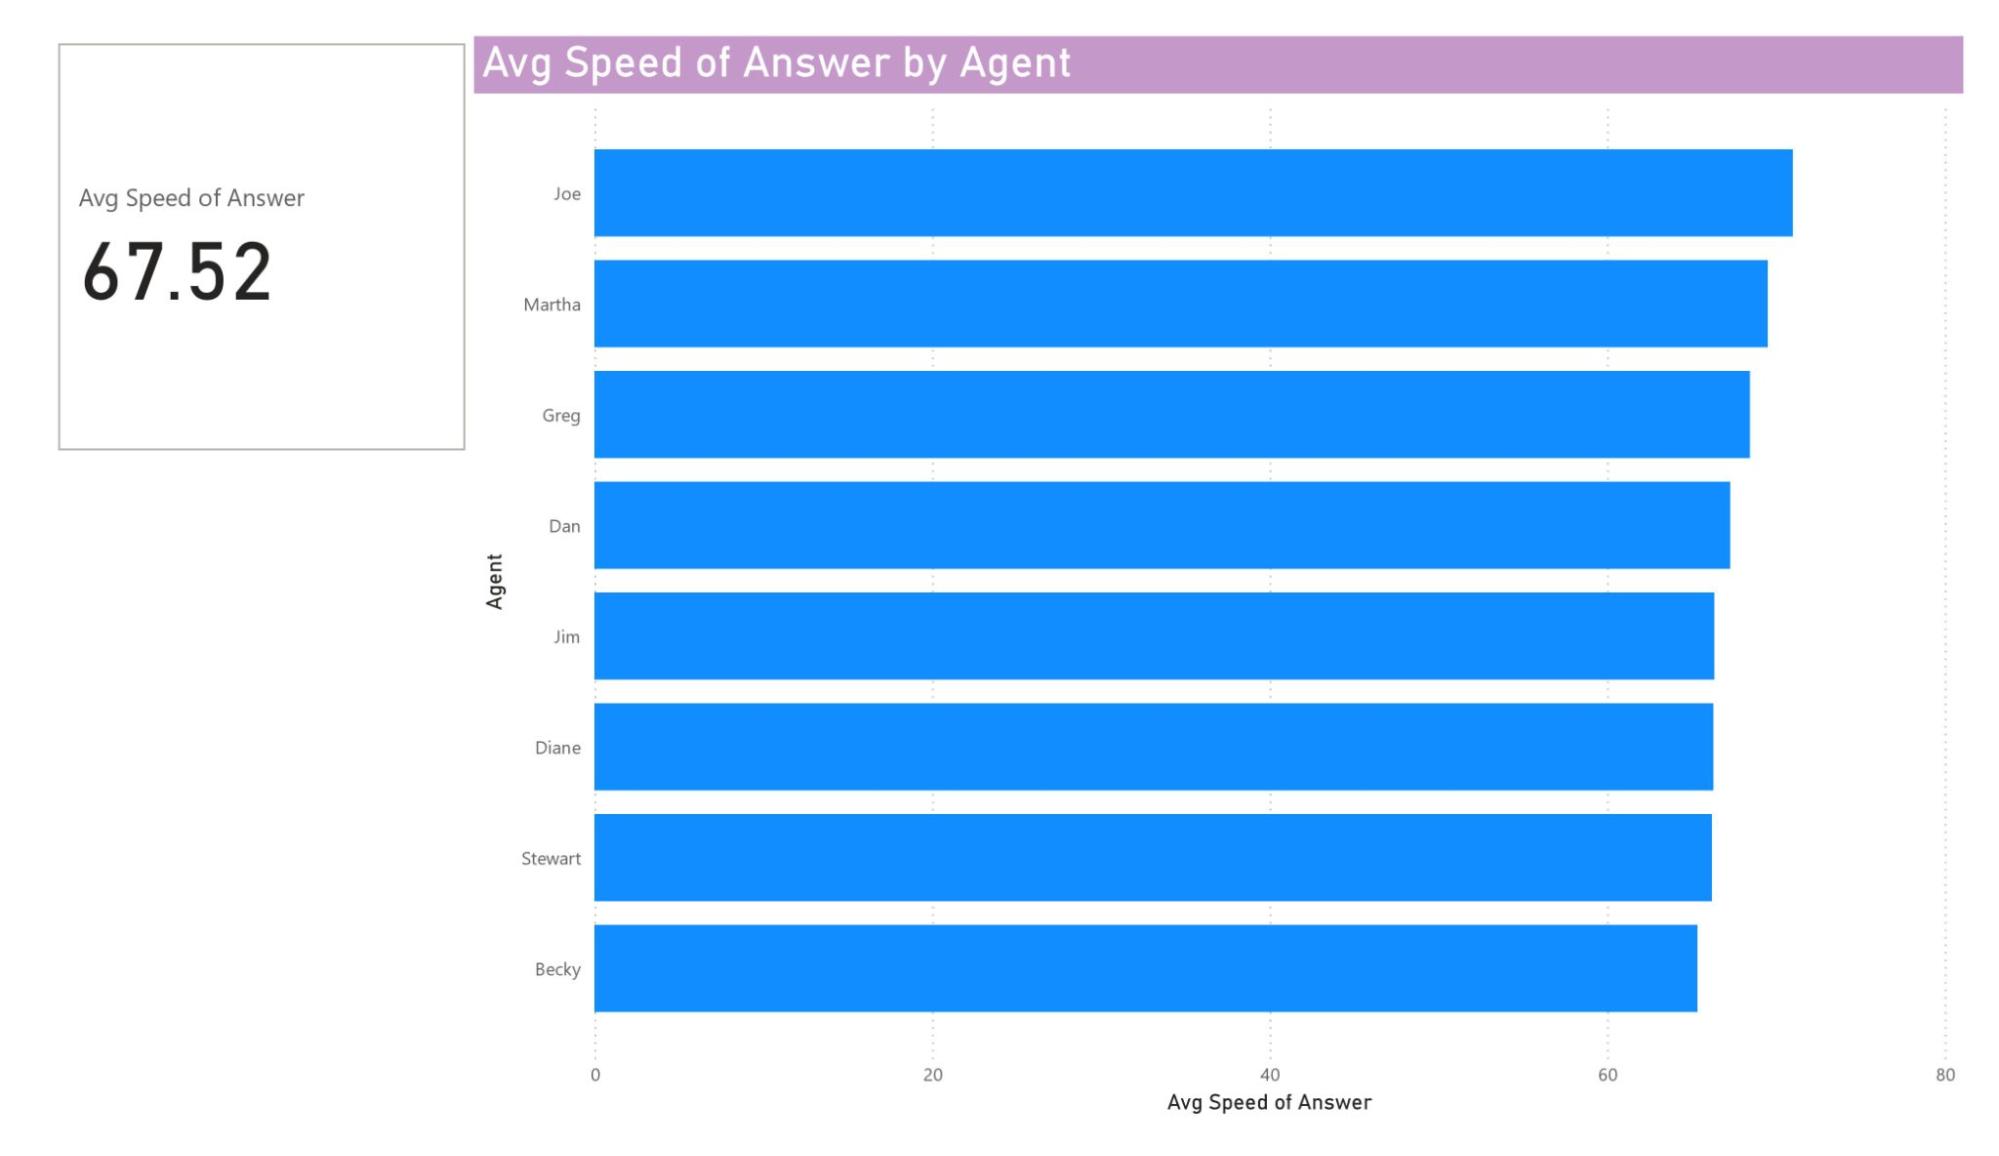
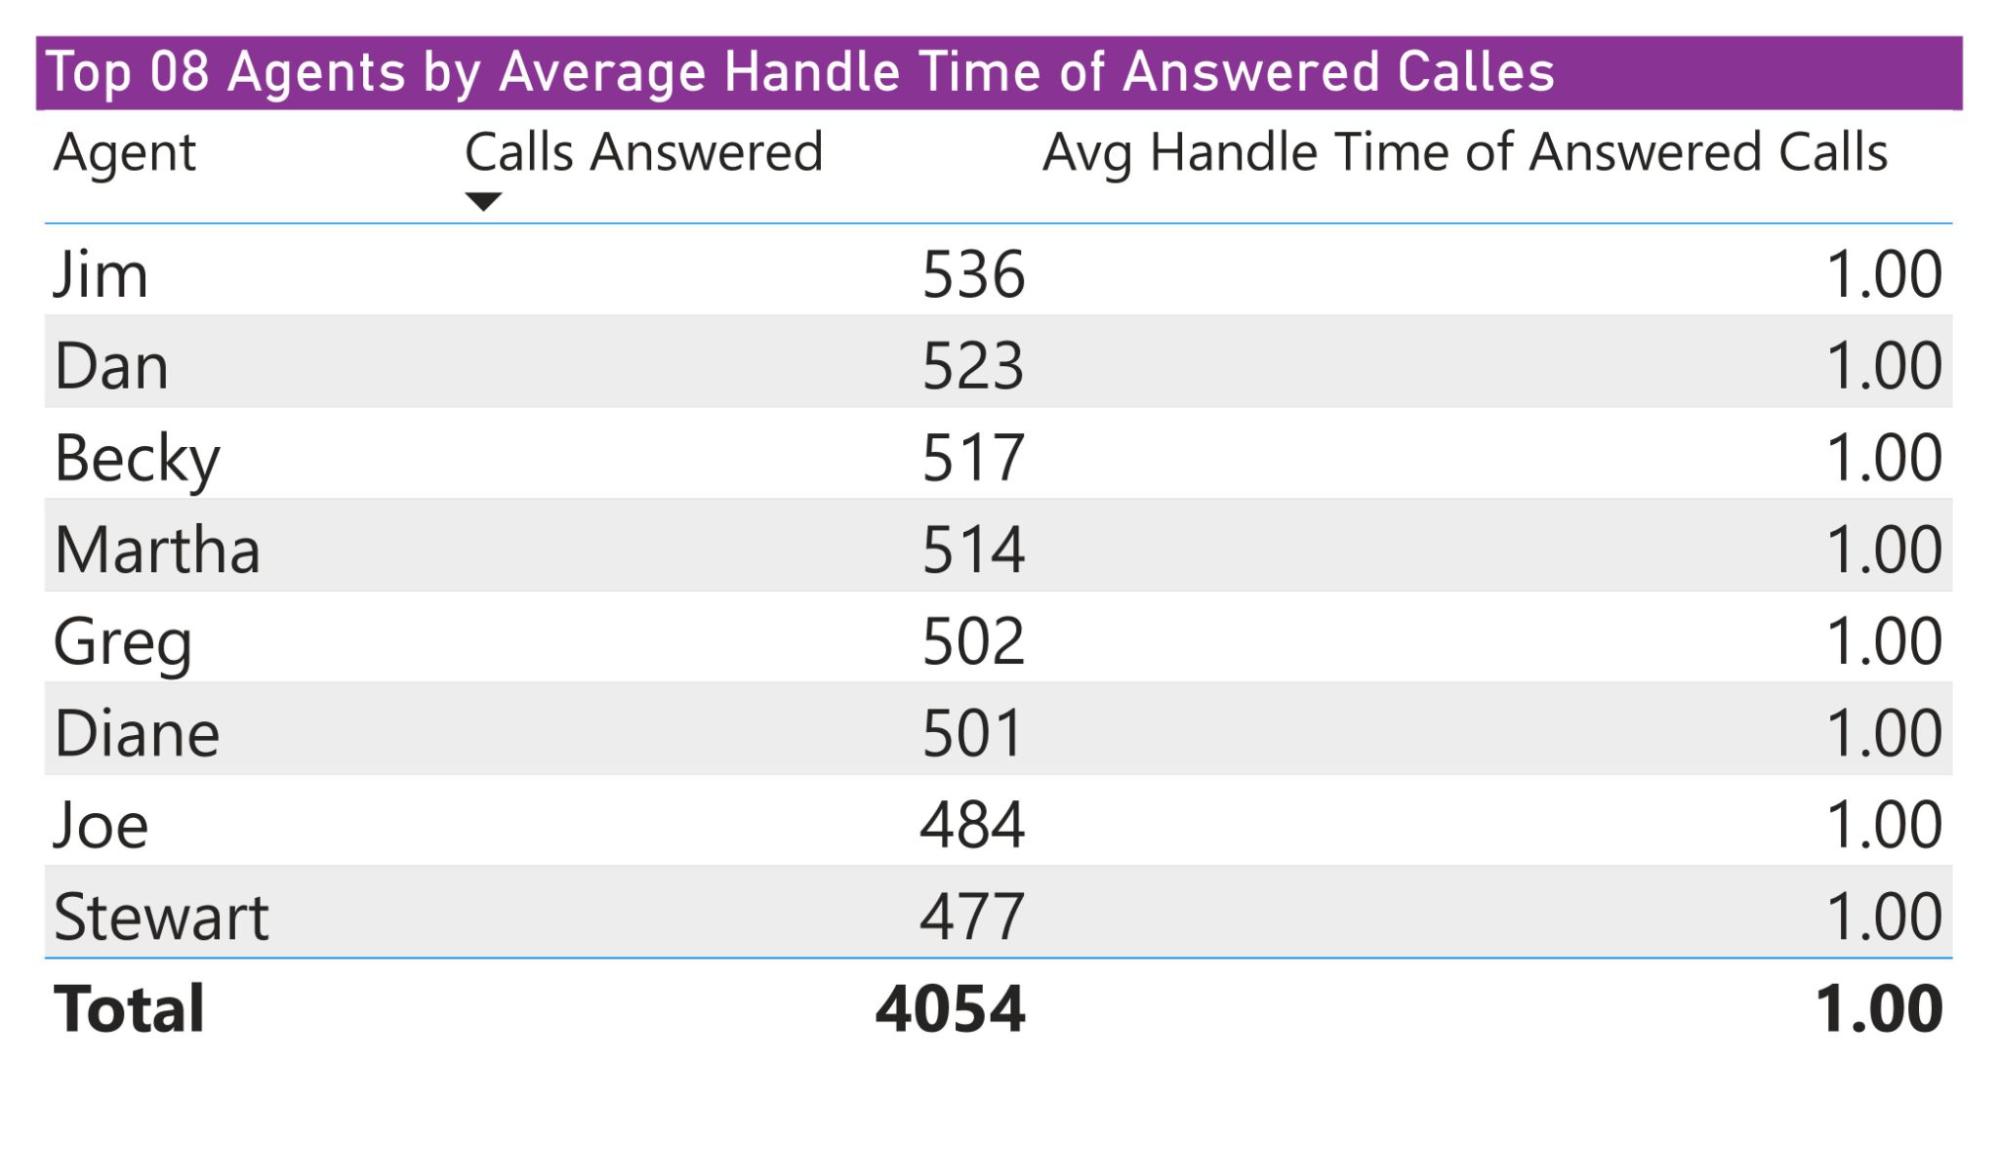
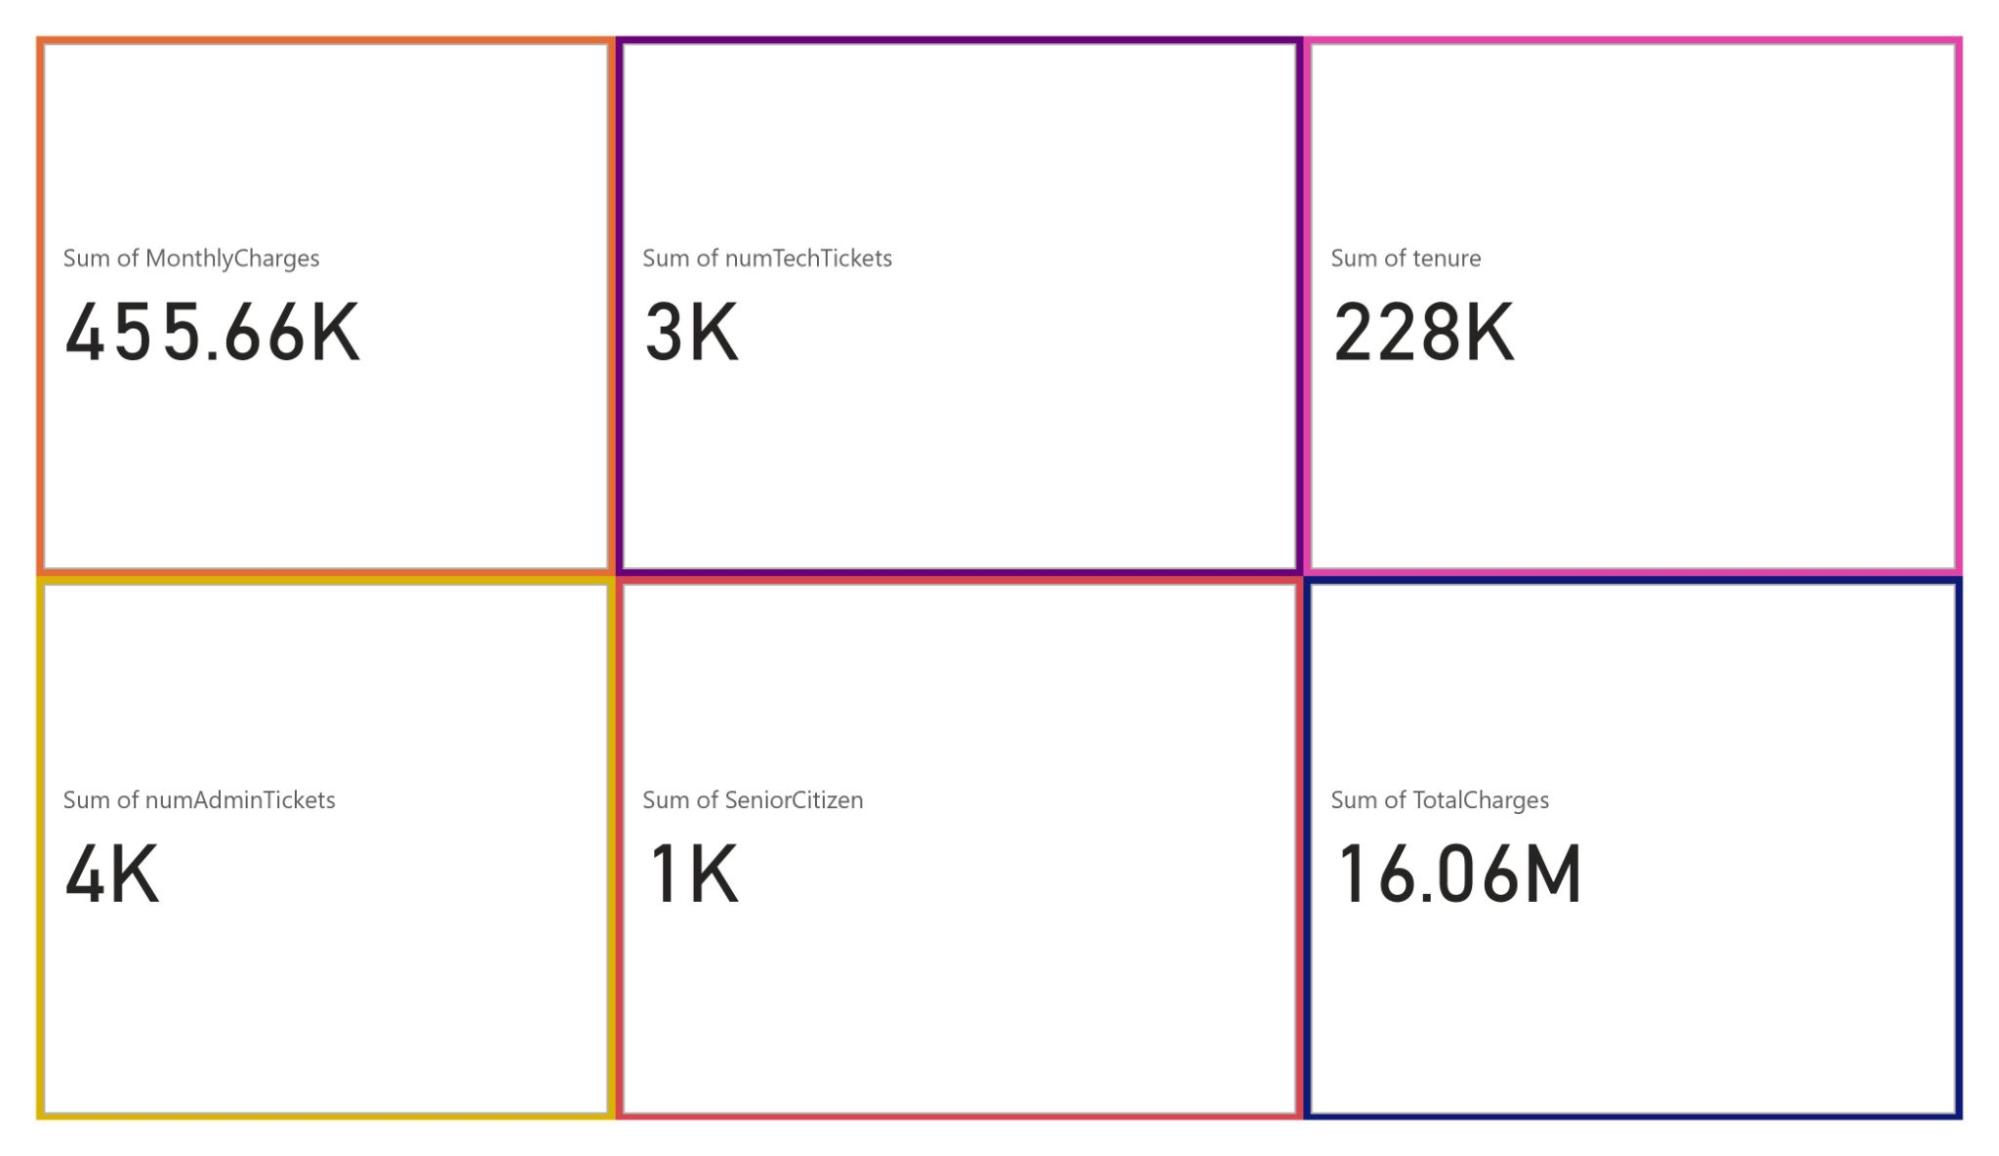
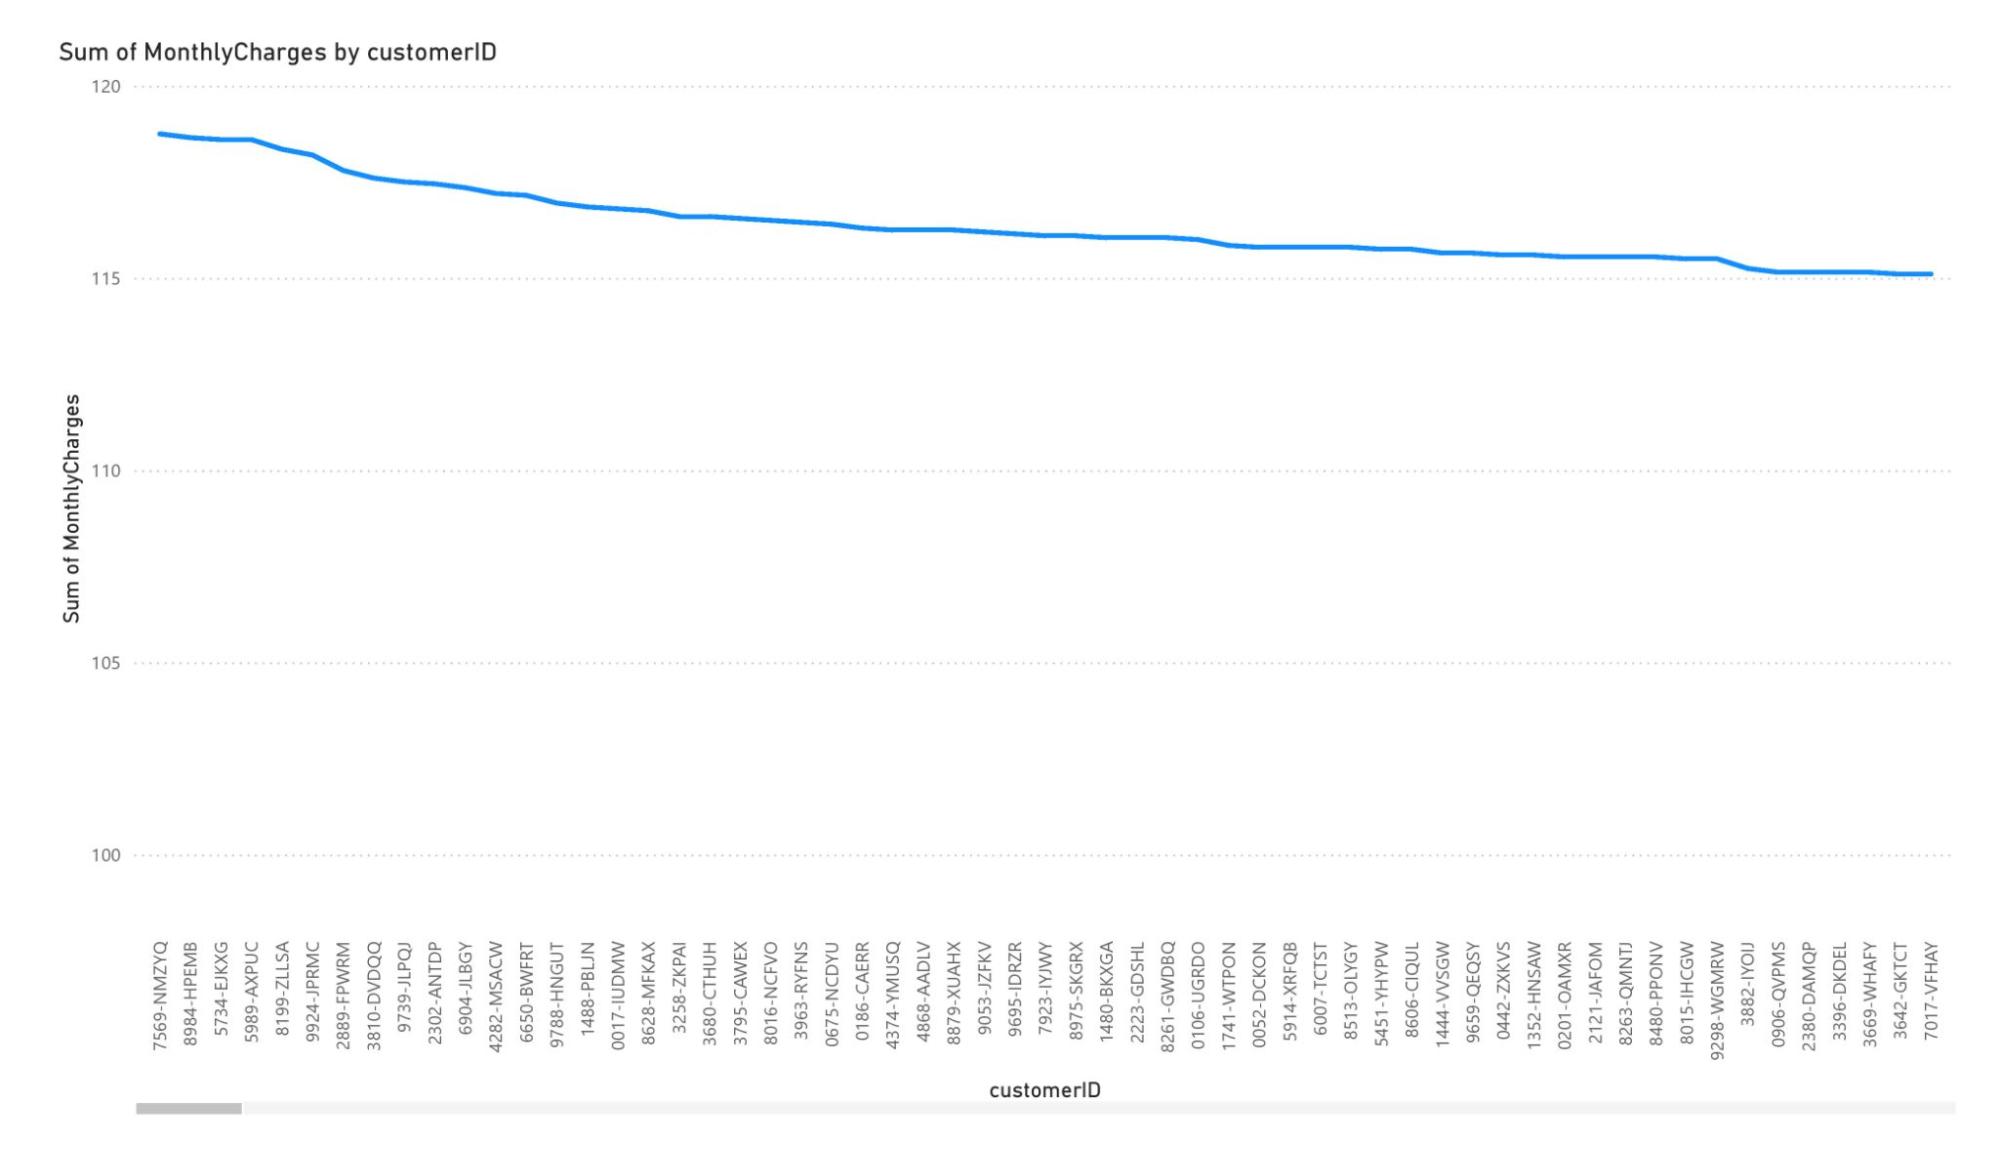
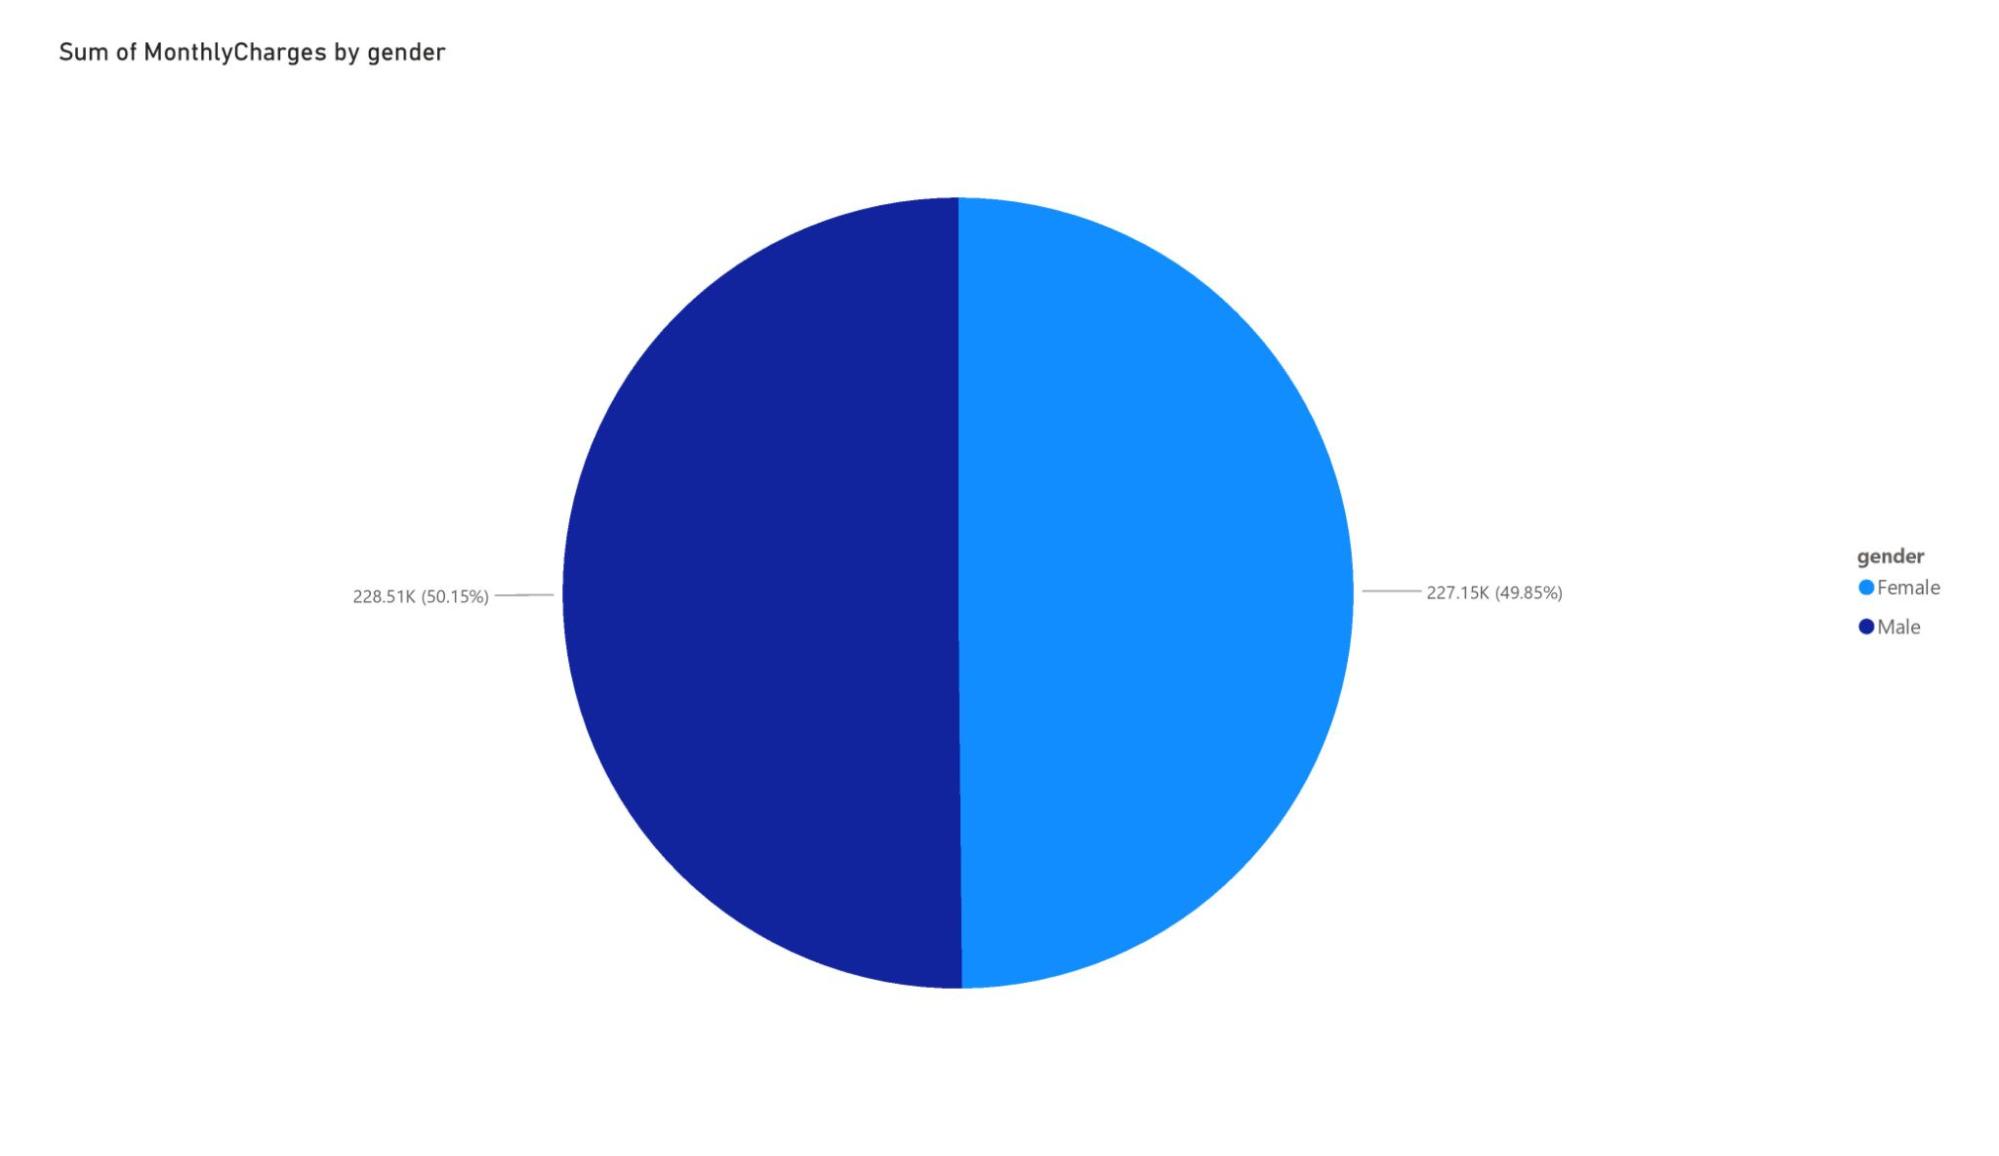
3 Here is your task | Here is your taskIt’s omnipresent: telecom marketing. Better price here. Better service there. Best for small businesses here. Best for young urbanites there. But what do customers really want? Our client, a big telecom company needs to know. This email just arrived for you: Create a dashboard in Power BI for Claire that reflects all relevant Key Performance Indicators (KPIs) and metrics in the dataset. Get creative! Possible KPIs include (to get you started, but not limited to):
Here are some resources to help youUse the linked resources for helpful guidance on completing your task. Be aware, that you need a Windows Software to download Power BI Desktop. Here's a link to download PowerBI to your desktop for free! Do you want to learn more? Level up by listening to a portion (or all!) of our podcasts linked below and read our articles. Podcasts
Further information
Upload your Dashboard |
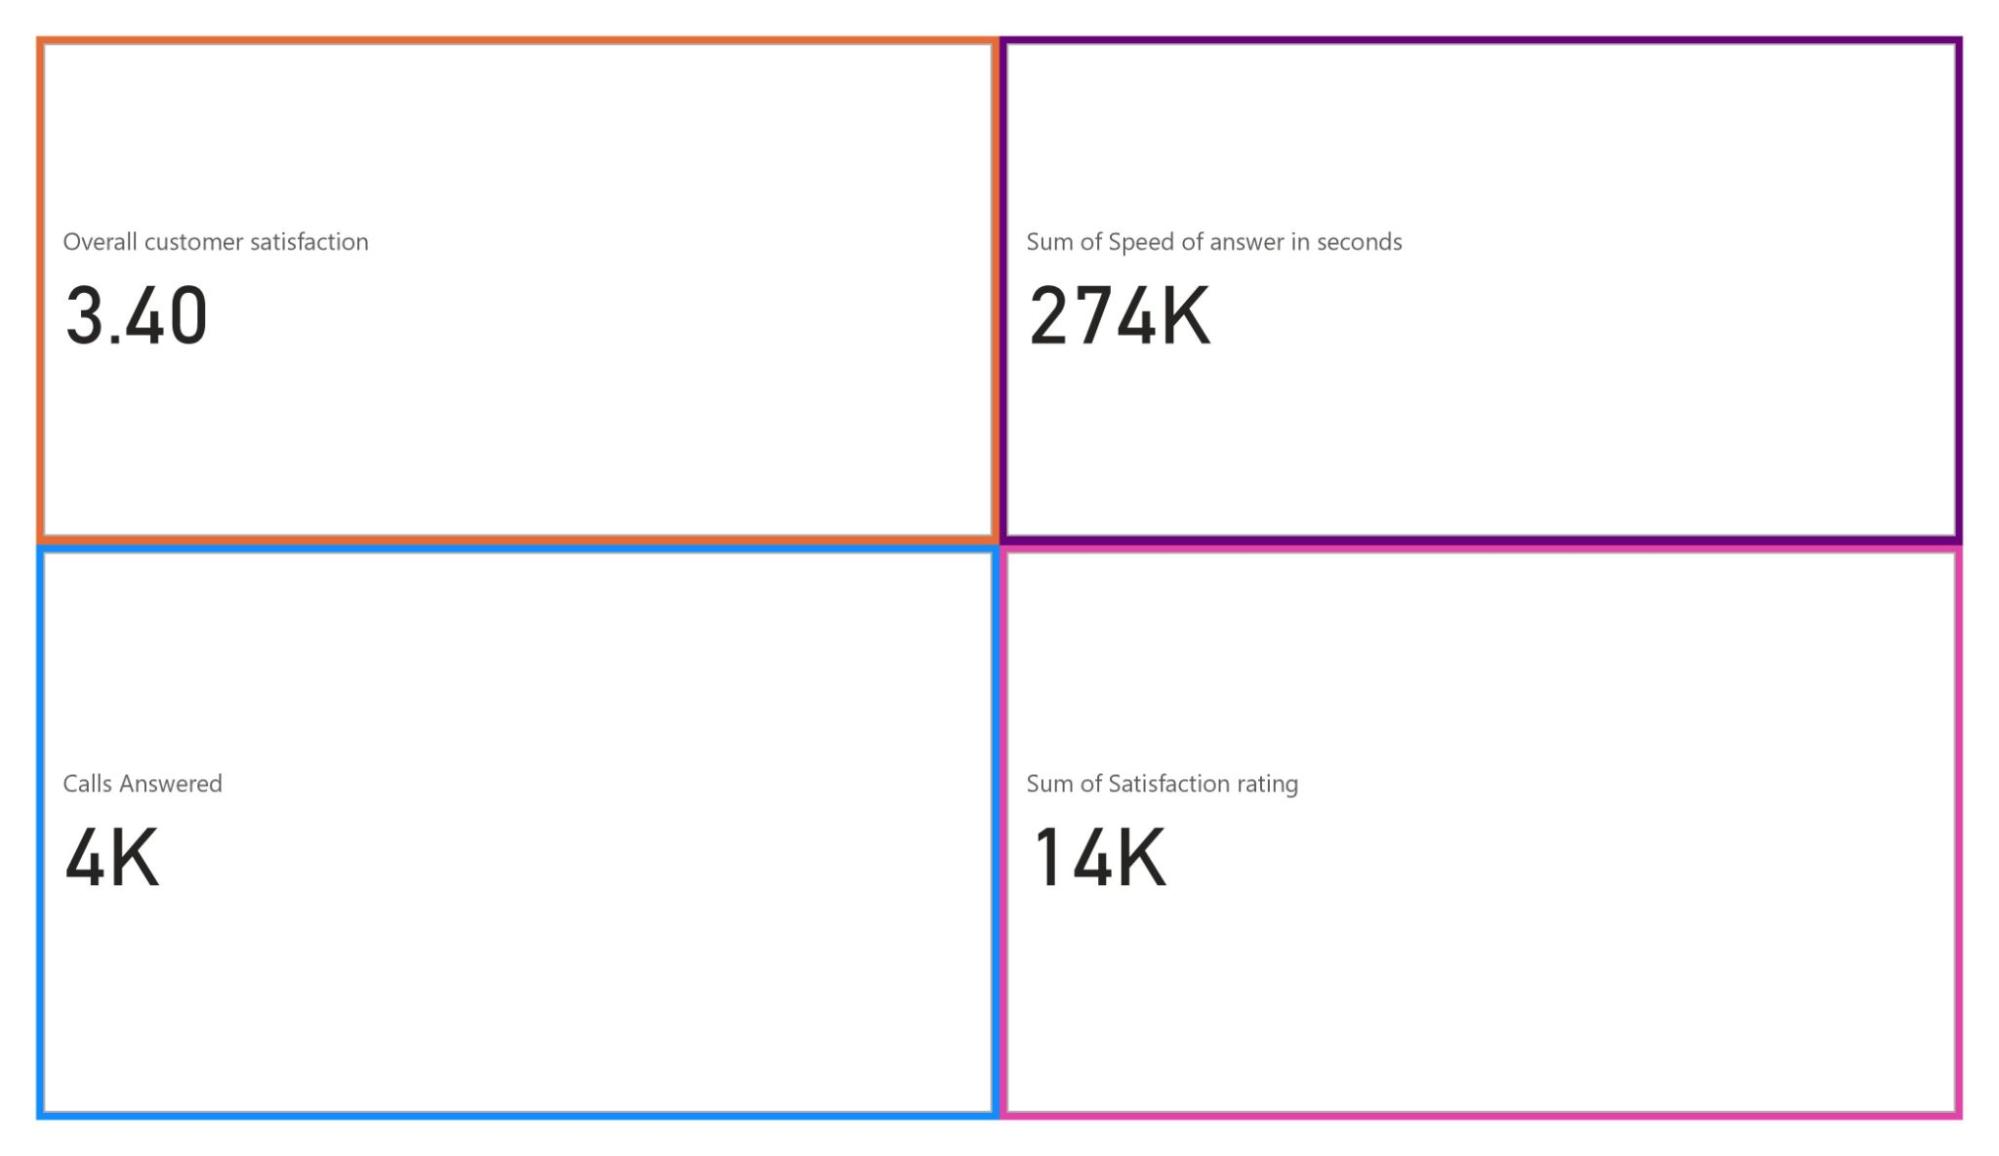
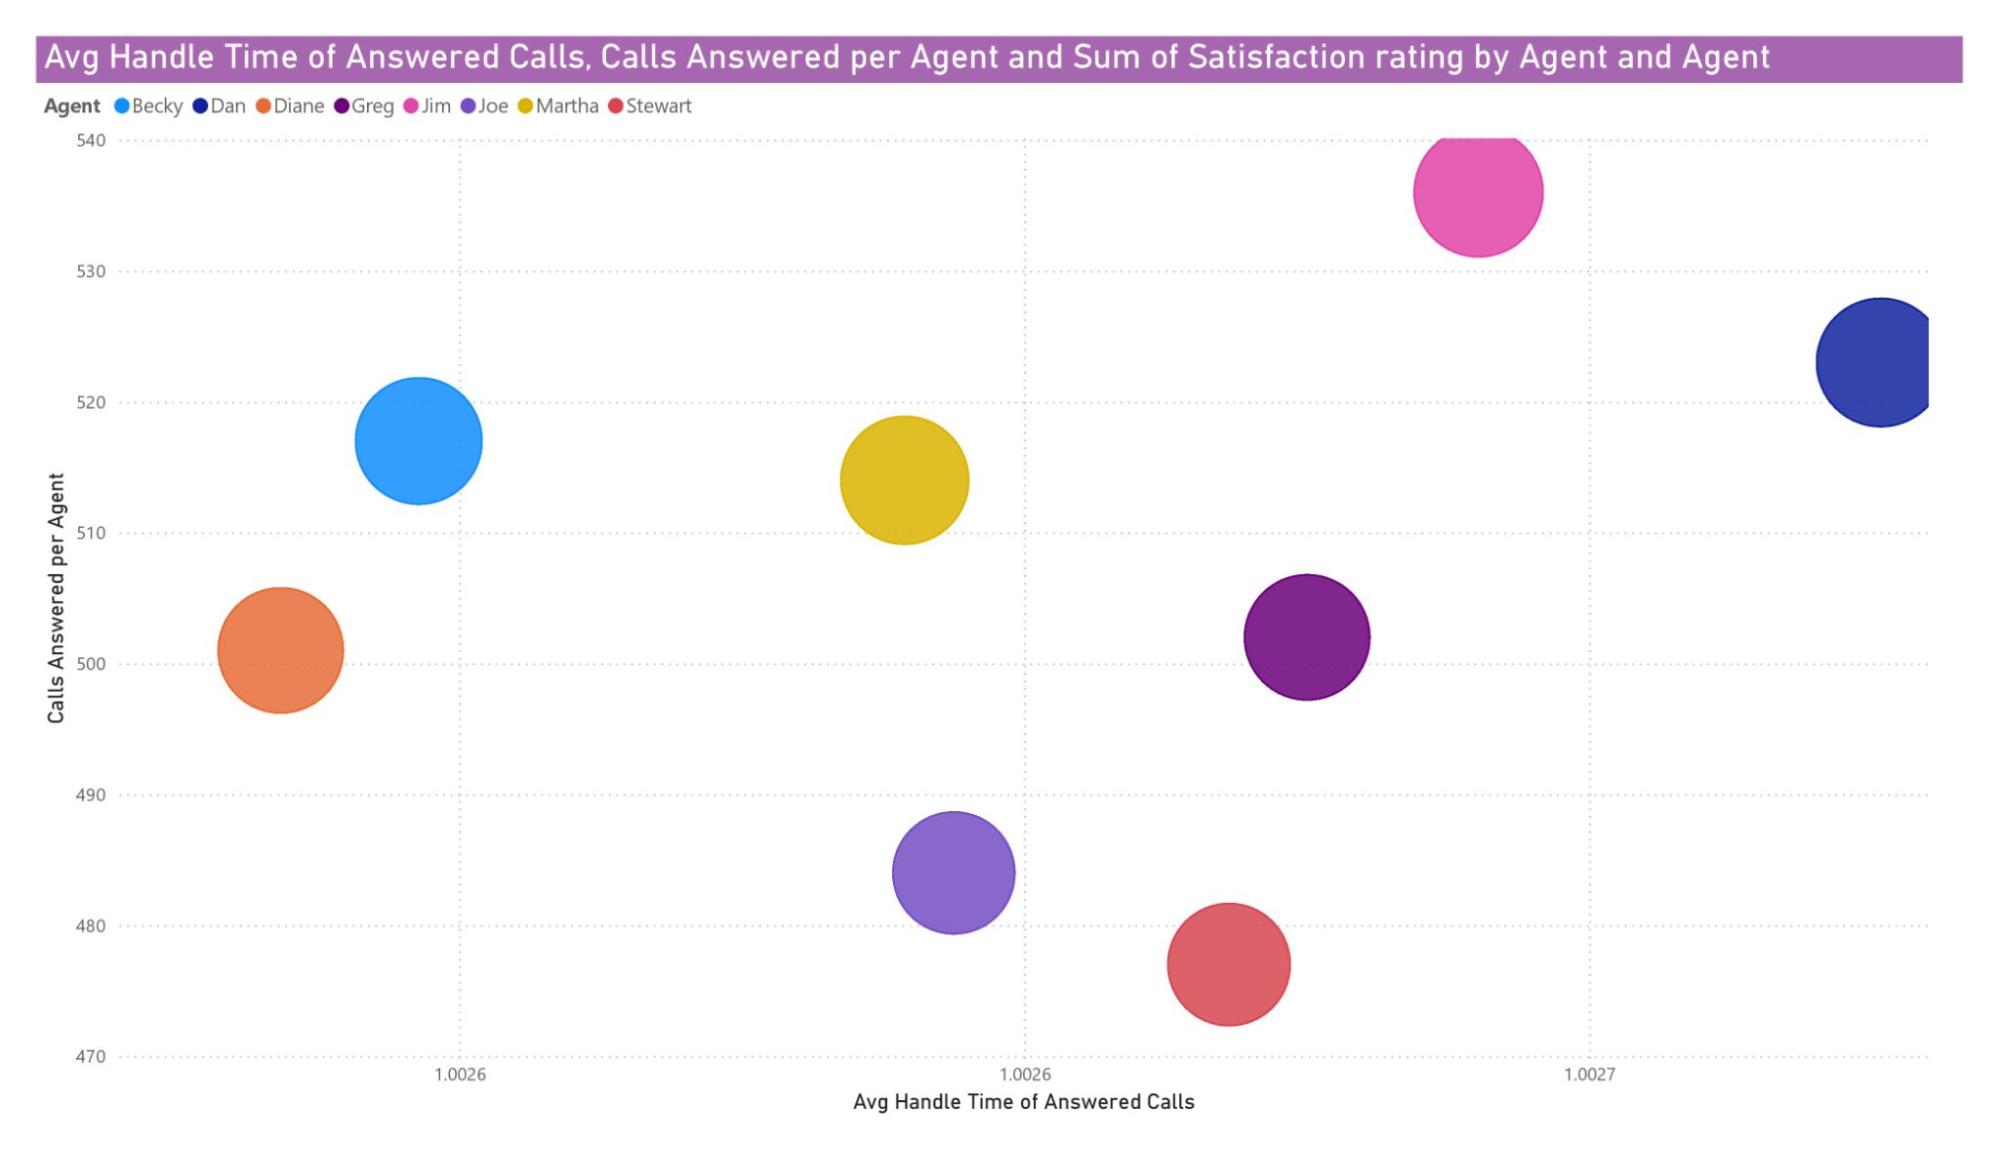
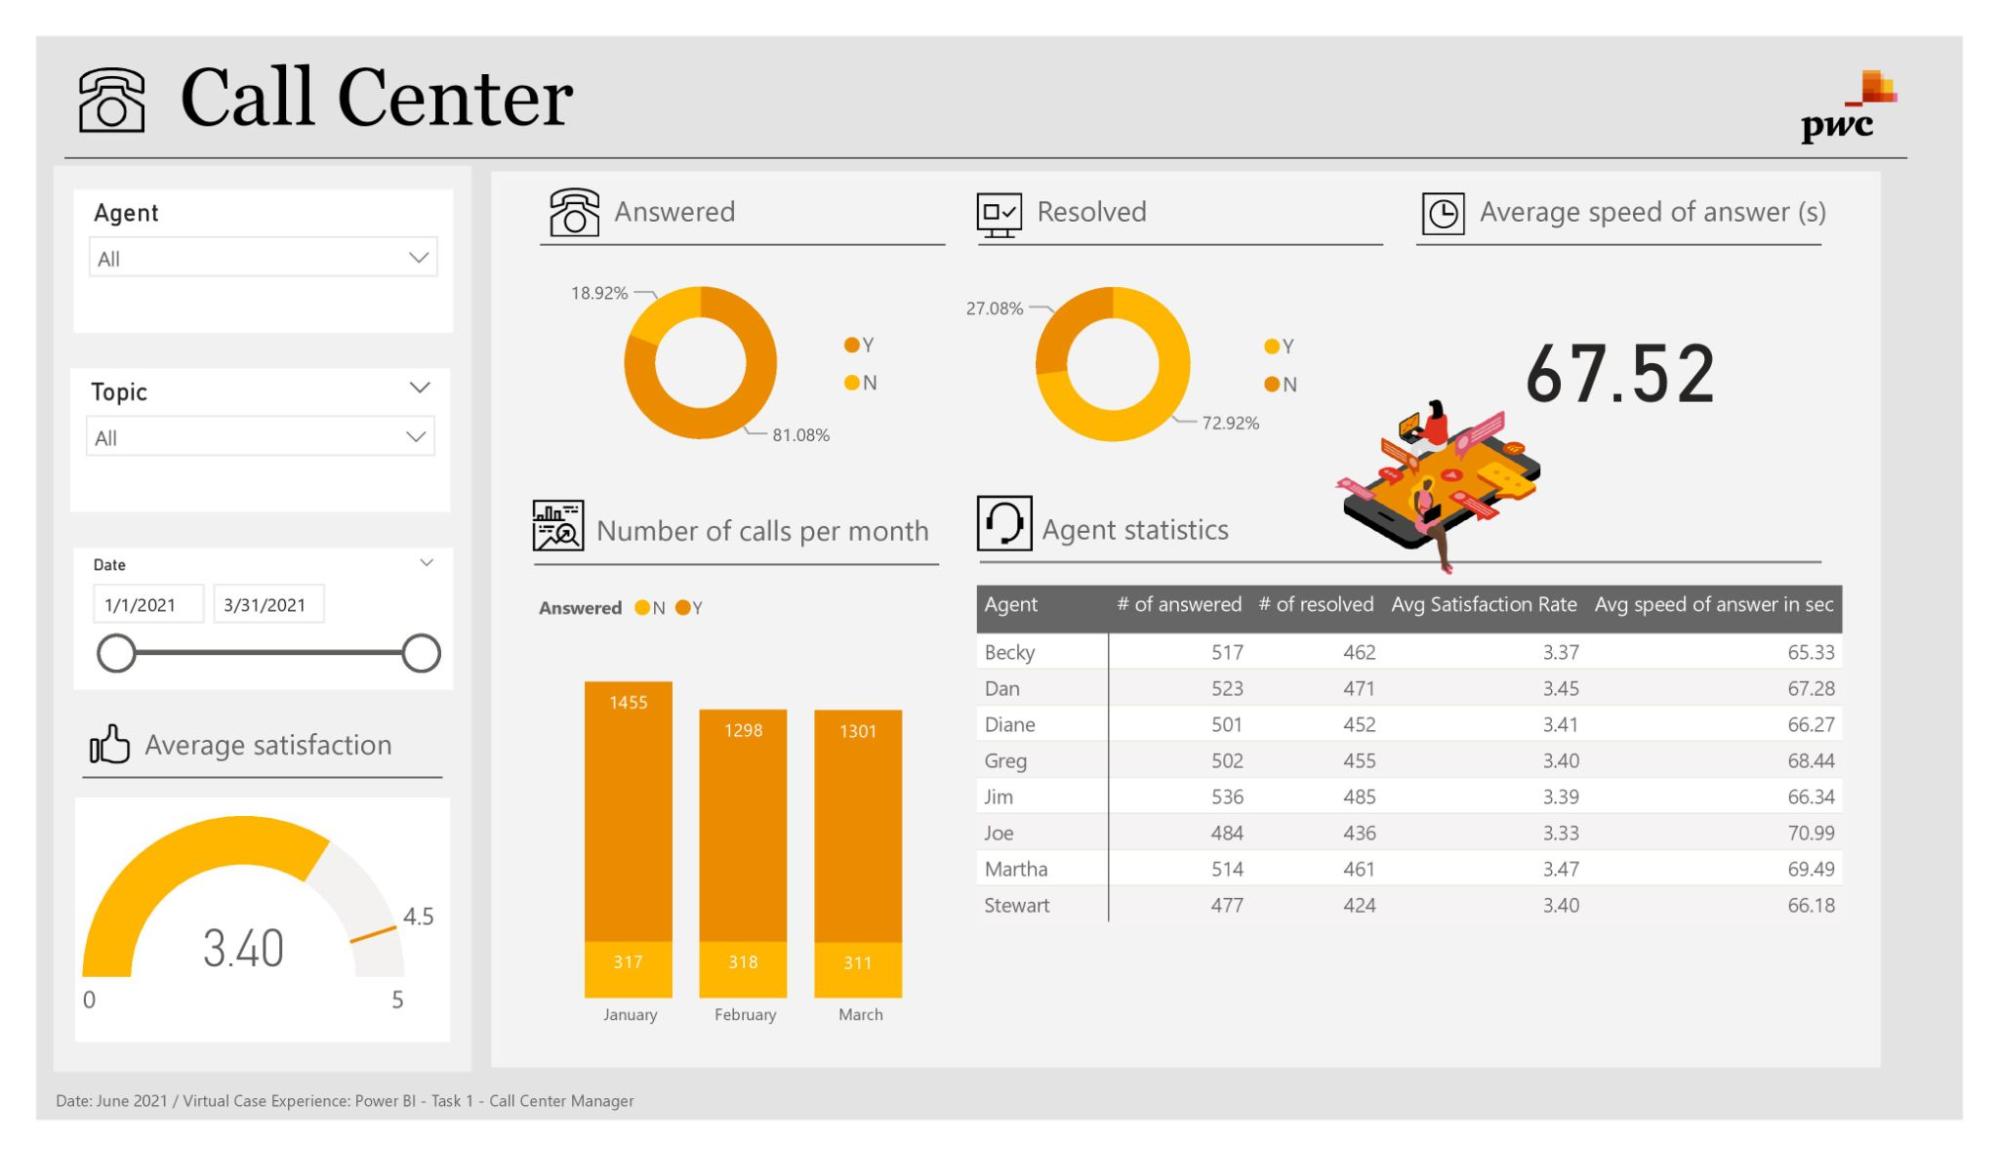
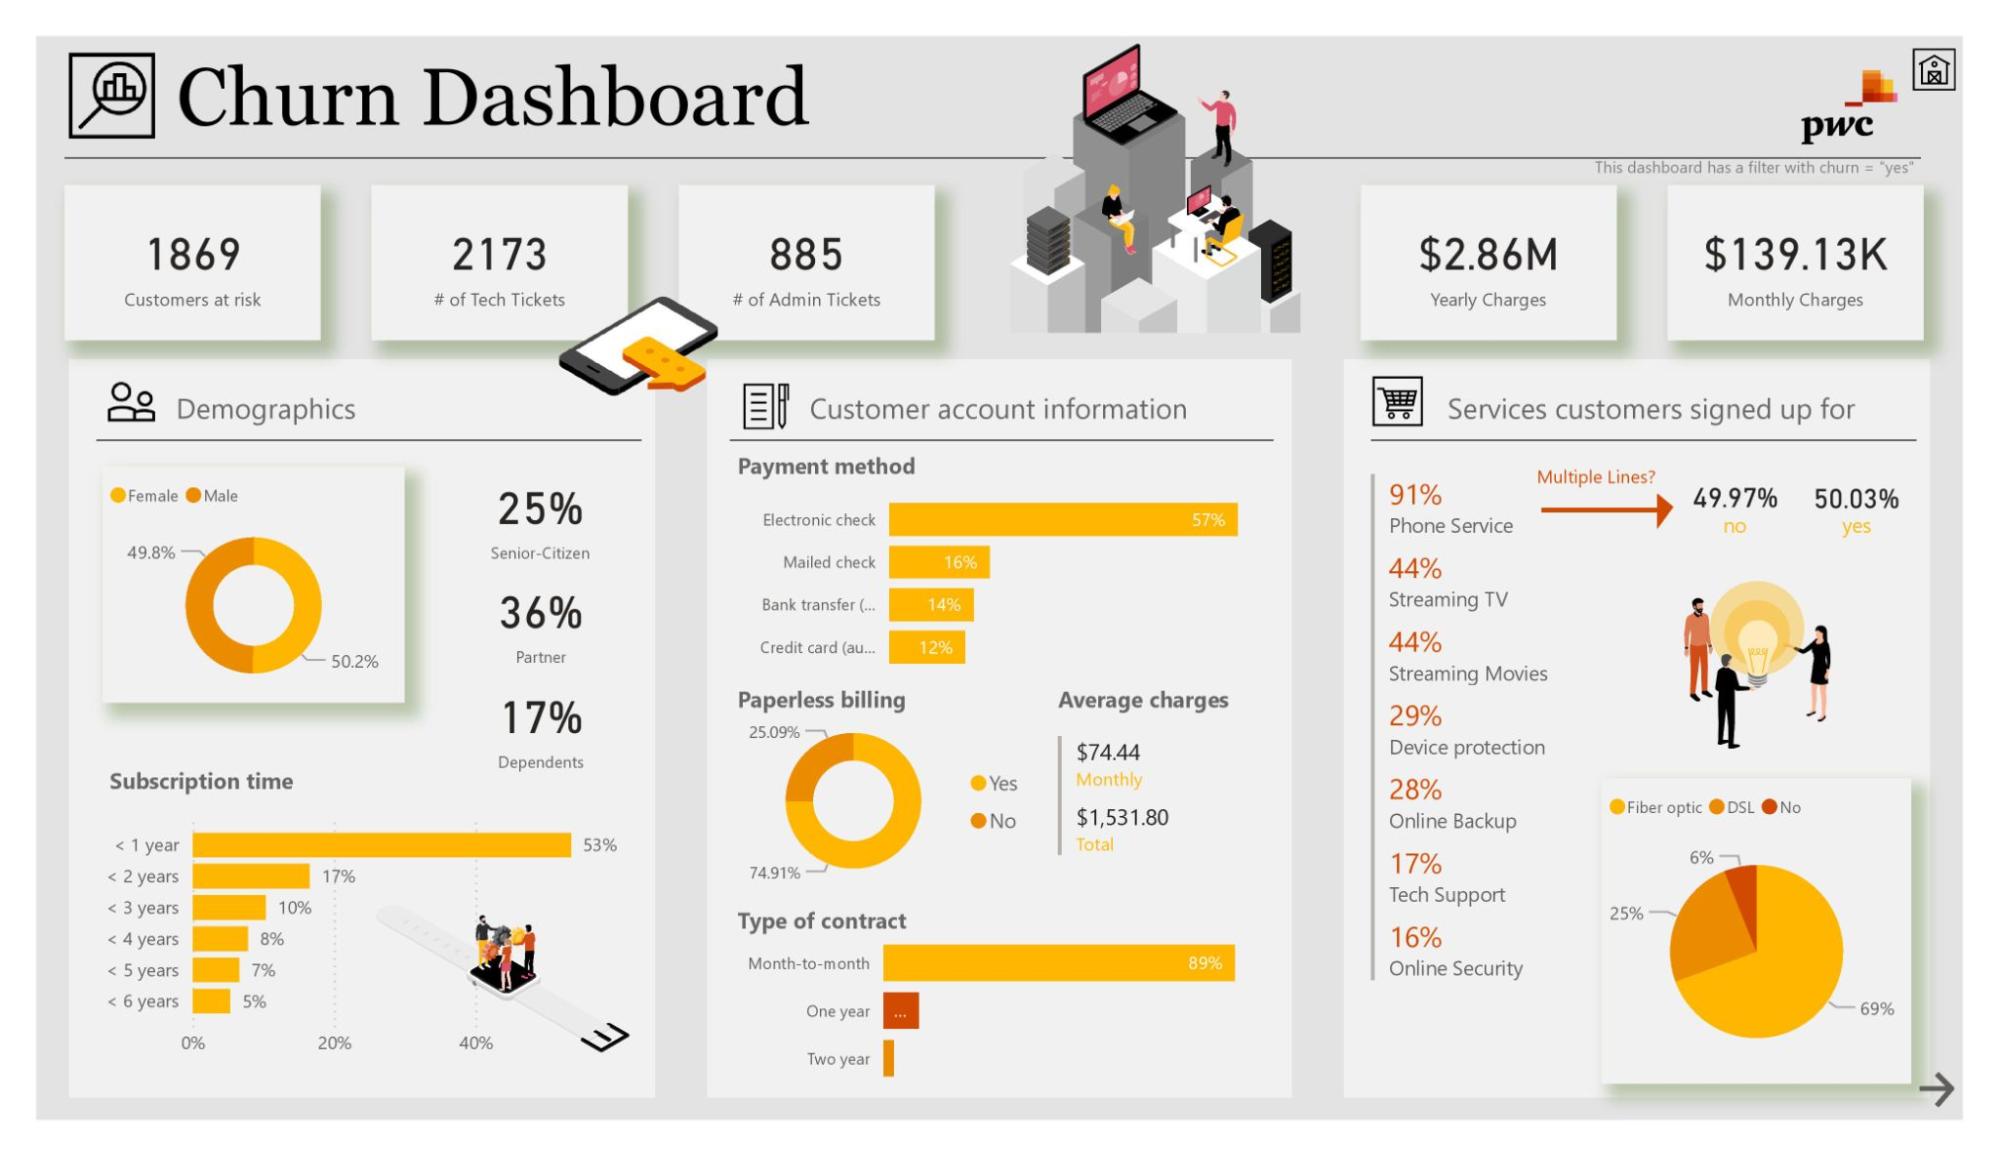
4 Example Answer | Example AnswerGreat work! Take a look at the example answer below to see how a professional would have attempted this task. Think about what you did well and how you can improve. |
5 Completion | |
Task Three: Customer Retention | |
1 Task Overview | Task OverviewWhat you'll learn
What you'll do
|
2 Here is the background information on your task | Here is the background information on your taskA few weeks after presenting your dashboard to the management, the Retention Manager from the telecom reaches out to you directly. He was impressed by your work and asked if you can put together a dashboard about customer retention. In addition, to better understand the data, the telecom Retention Manager has scheduled a meeting with the engagement partner at PwC to cover these points:
The Retentions Manager has provided some information in the resources. |
3 Here is your task | Here is your taskYour colleague, the engagement partner, asks you to do the following tasks:
Here are some resources to help youUse the linked resource for helpful guidance on completing your task. |
4 Write a short email to the engagement partner | Write a short email to the engagement partnerWrite a short email to the engagement partner, explaining your findings, and include suggestions as to what needs to be changed Subject: Customer Retention Dashboard Overview Dear Retention Manager, I hope this email finds you well. I have prepared the requested customer retention dashboard for the Retention Manager, Janet. Findings:
Suggestions:
Let me know if there are areas you’d like to discuss or if further refinement is needed. Best regards, |
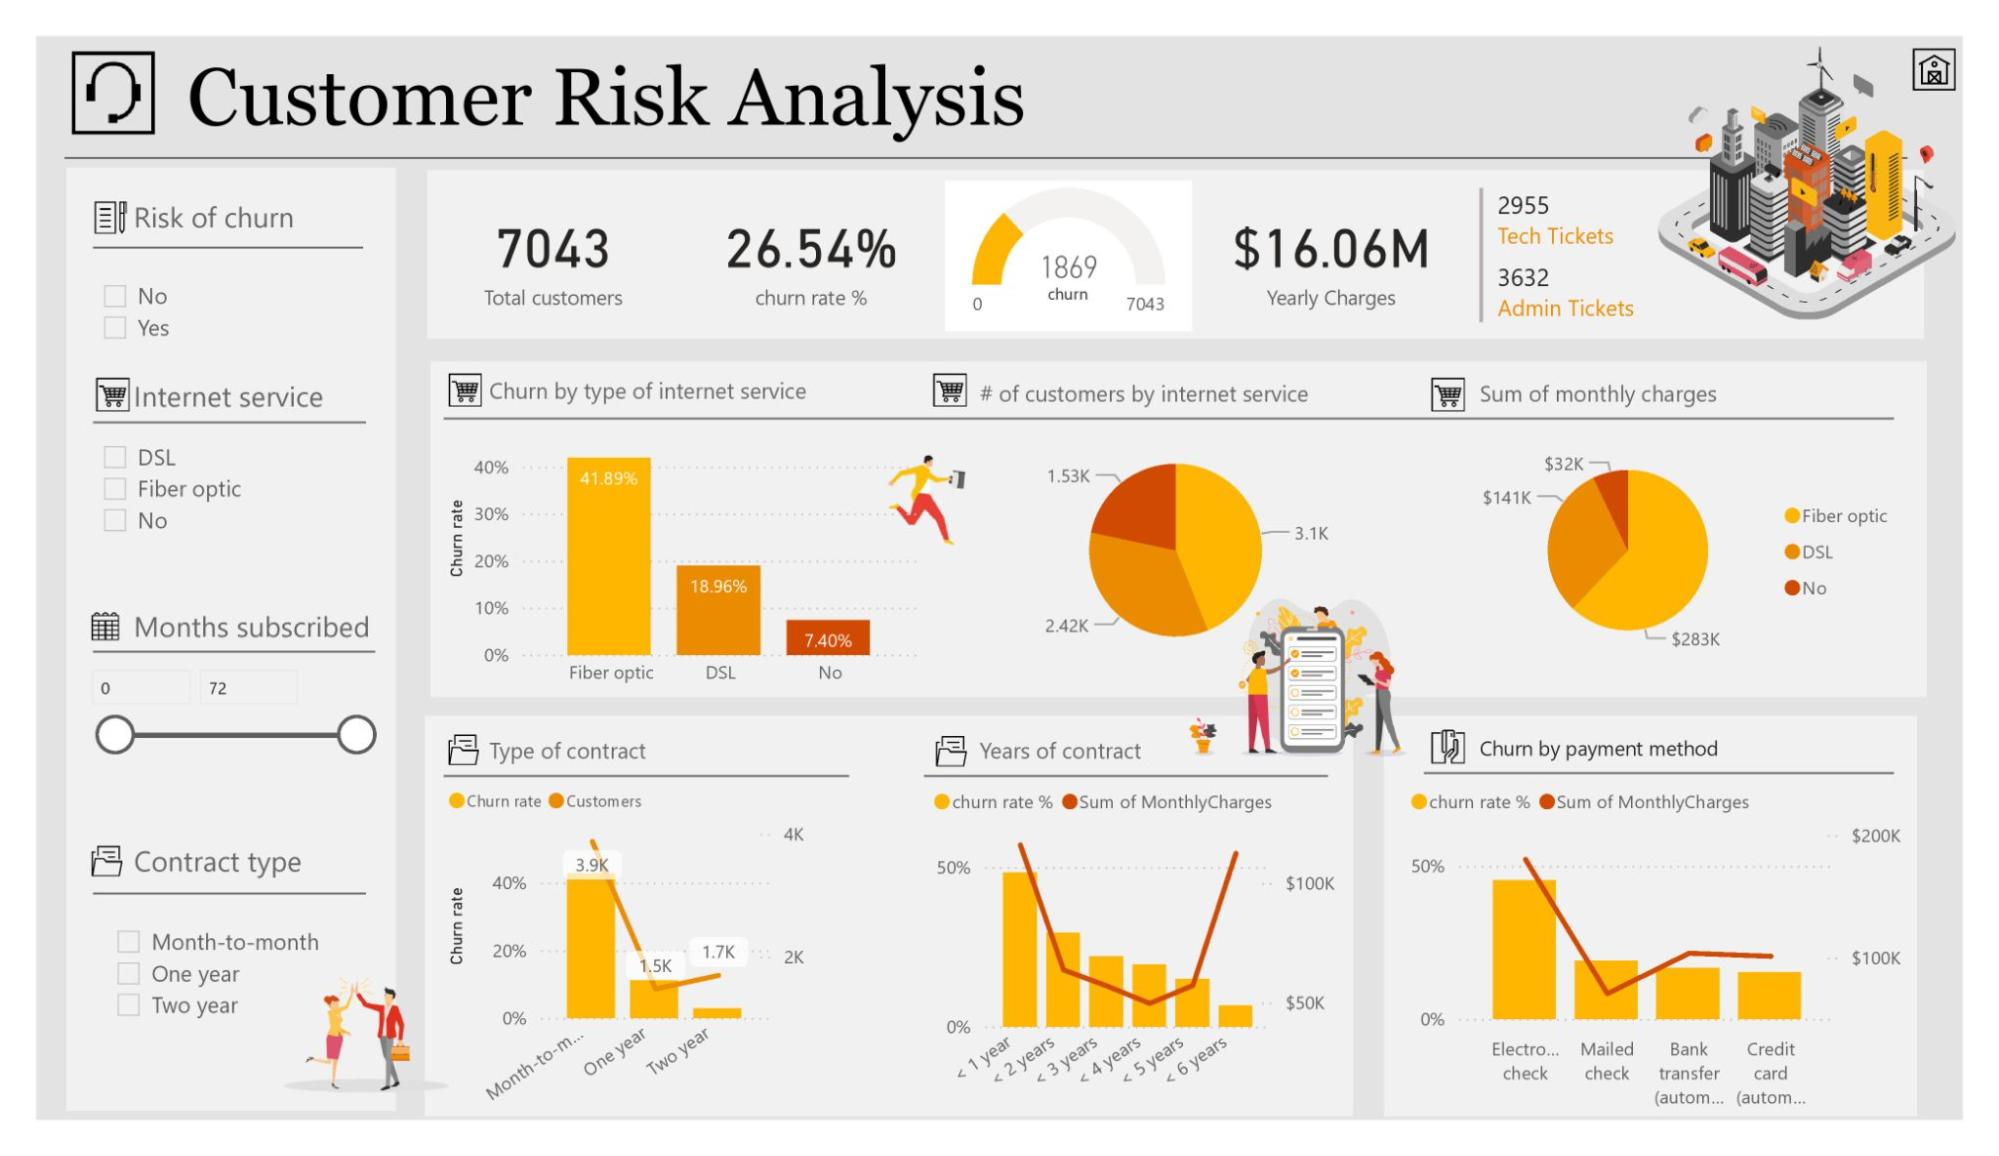
5 Example Answer | Example AnswerGreat work! Take a look at the example answer below to see how a professional would have attempted this task. Think about what you did well and how you can improve. |
6 Completion | |
Task Four: Diversity & Inclusion | |
1 Task Overview | Task OverviewWhat you'll learn
|
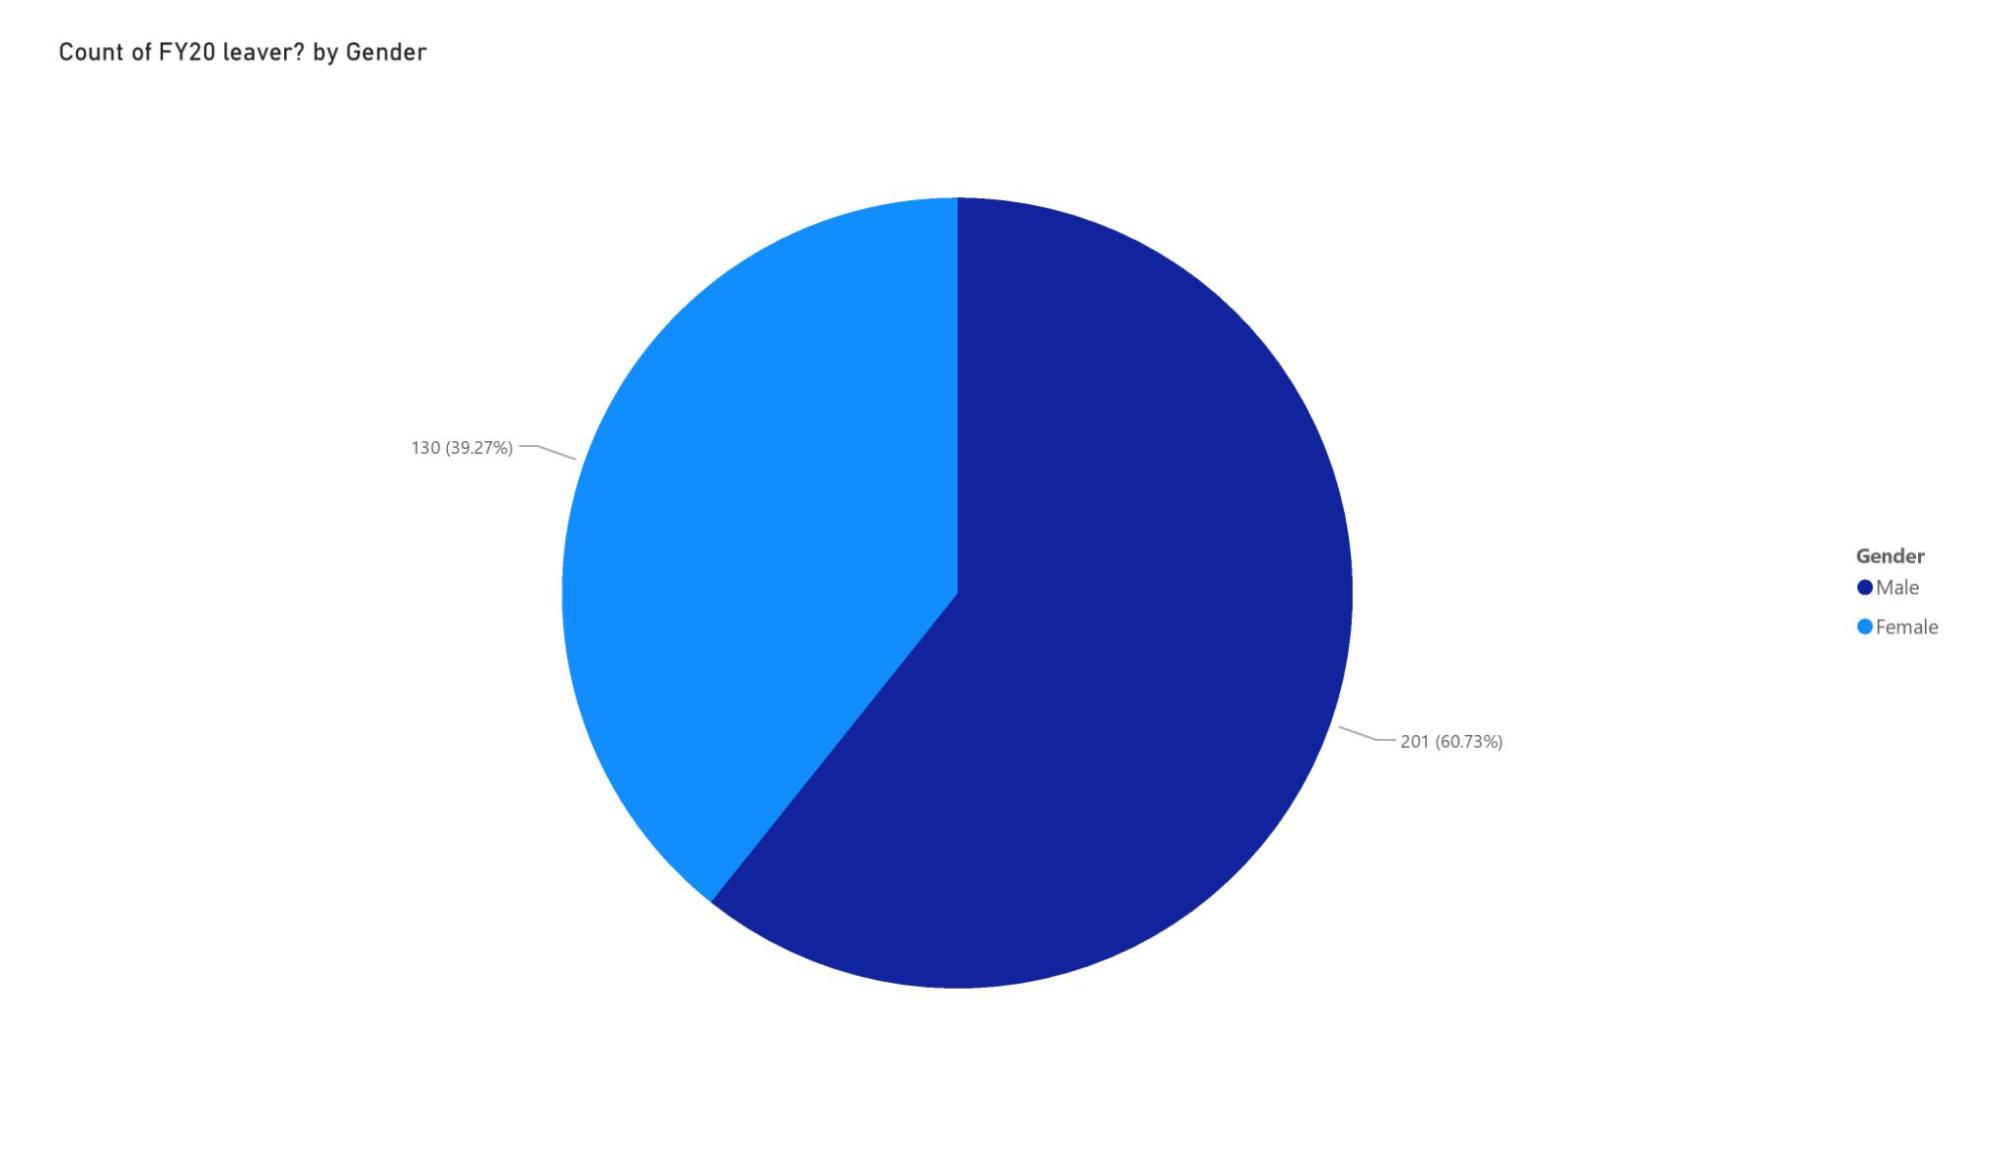
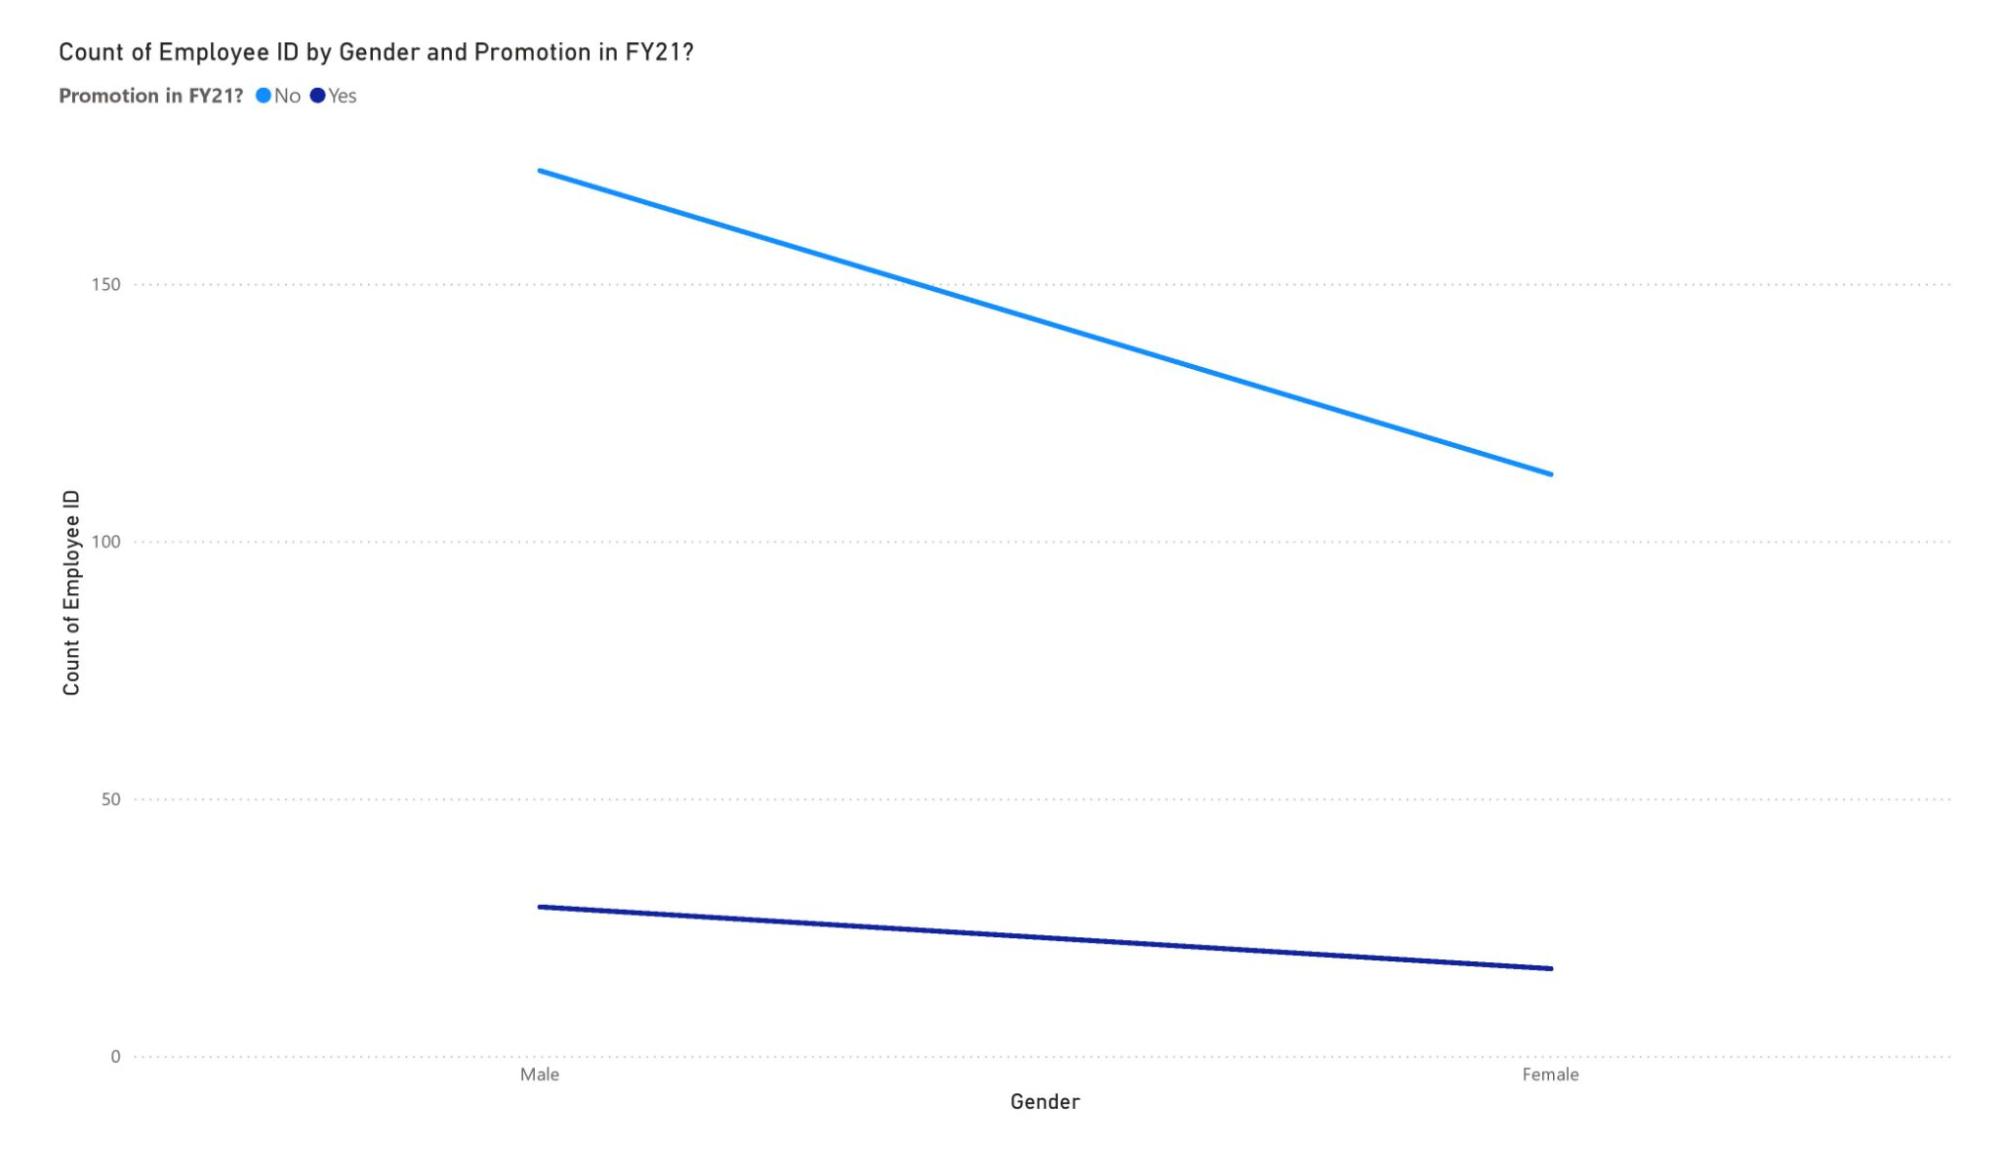
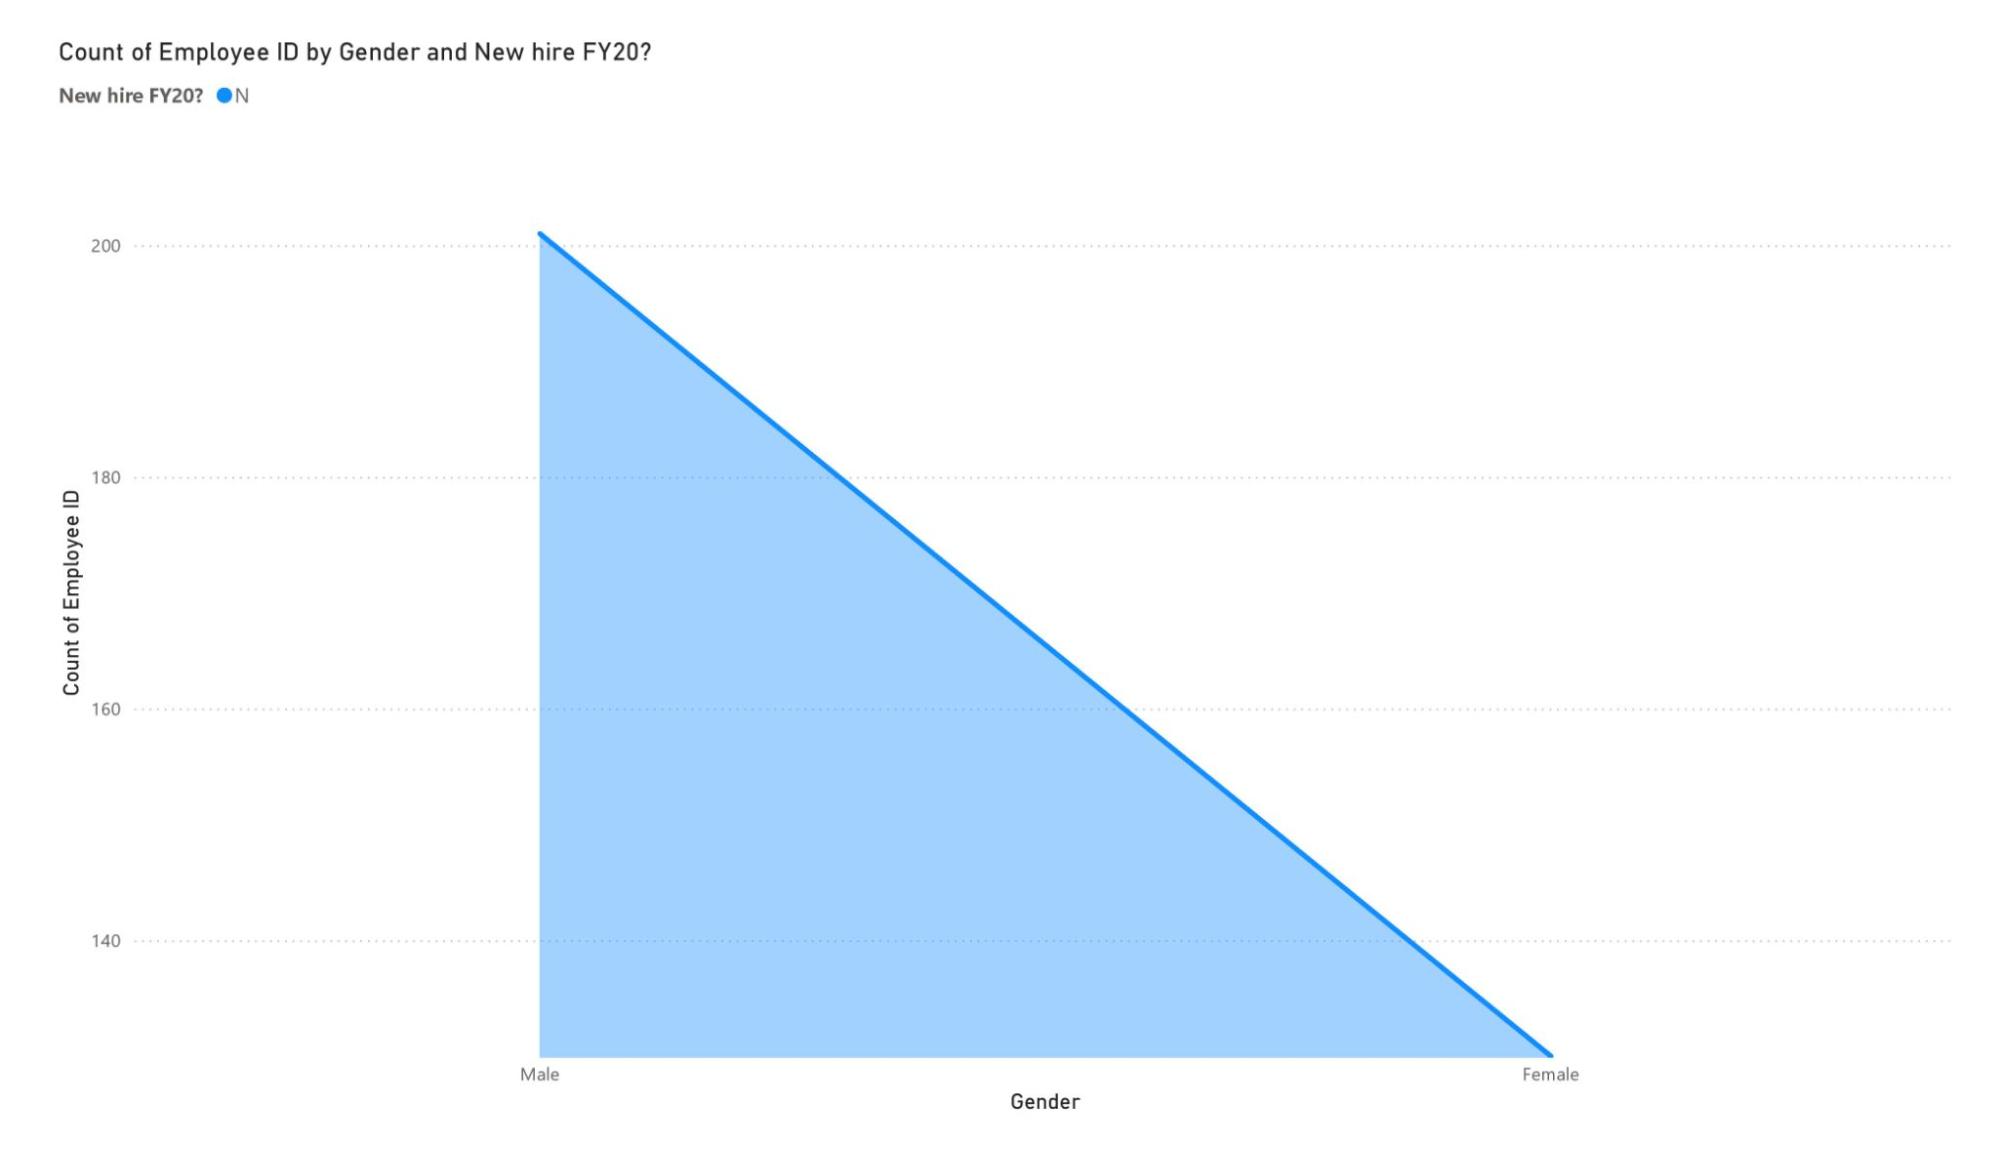
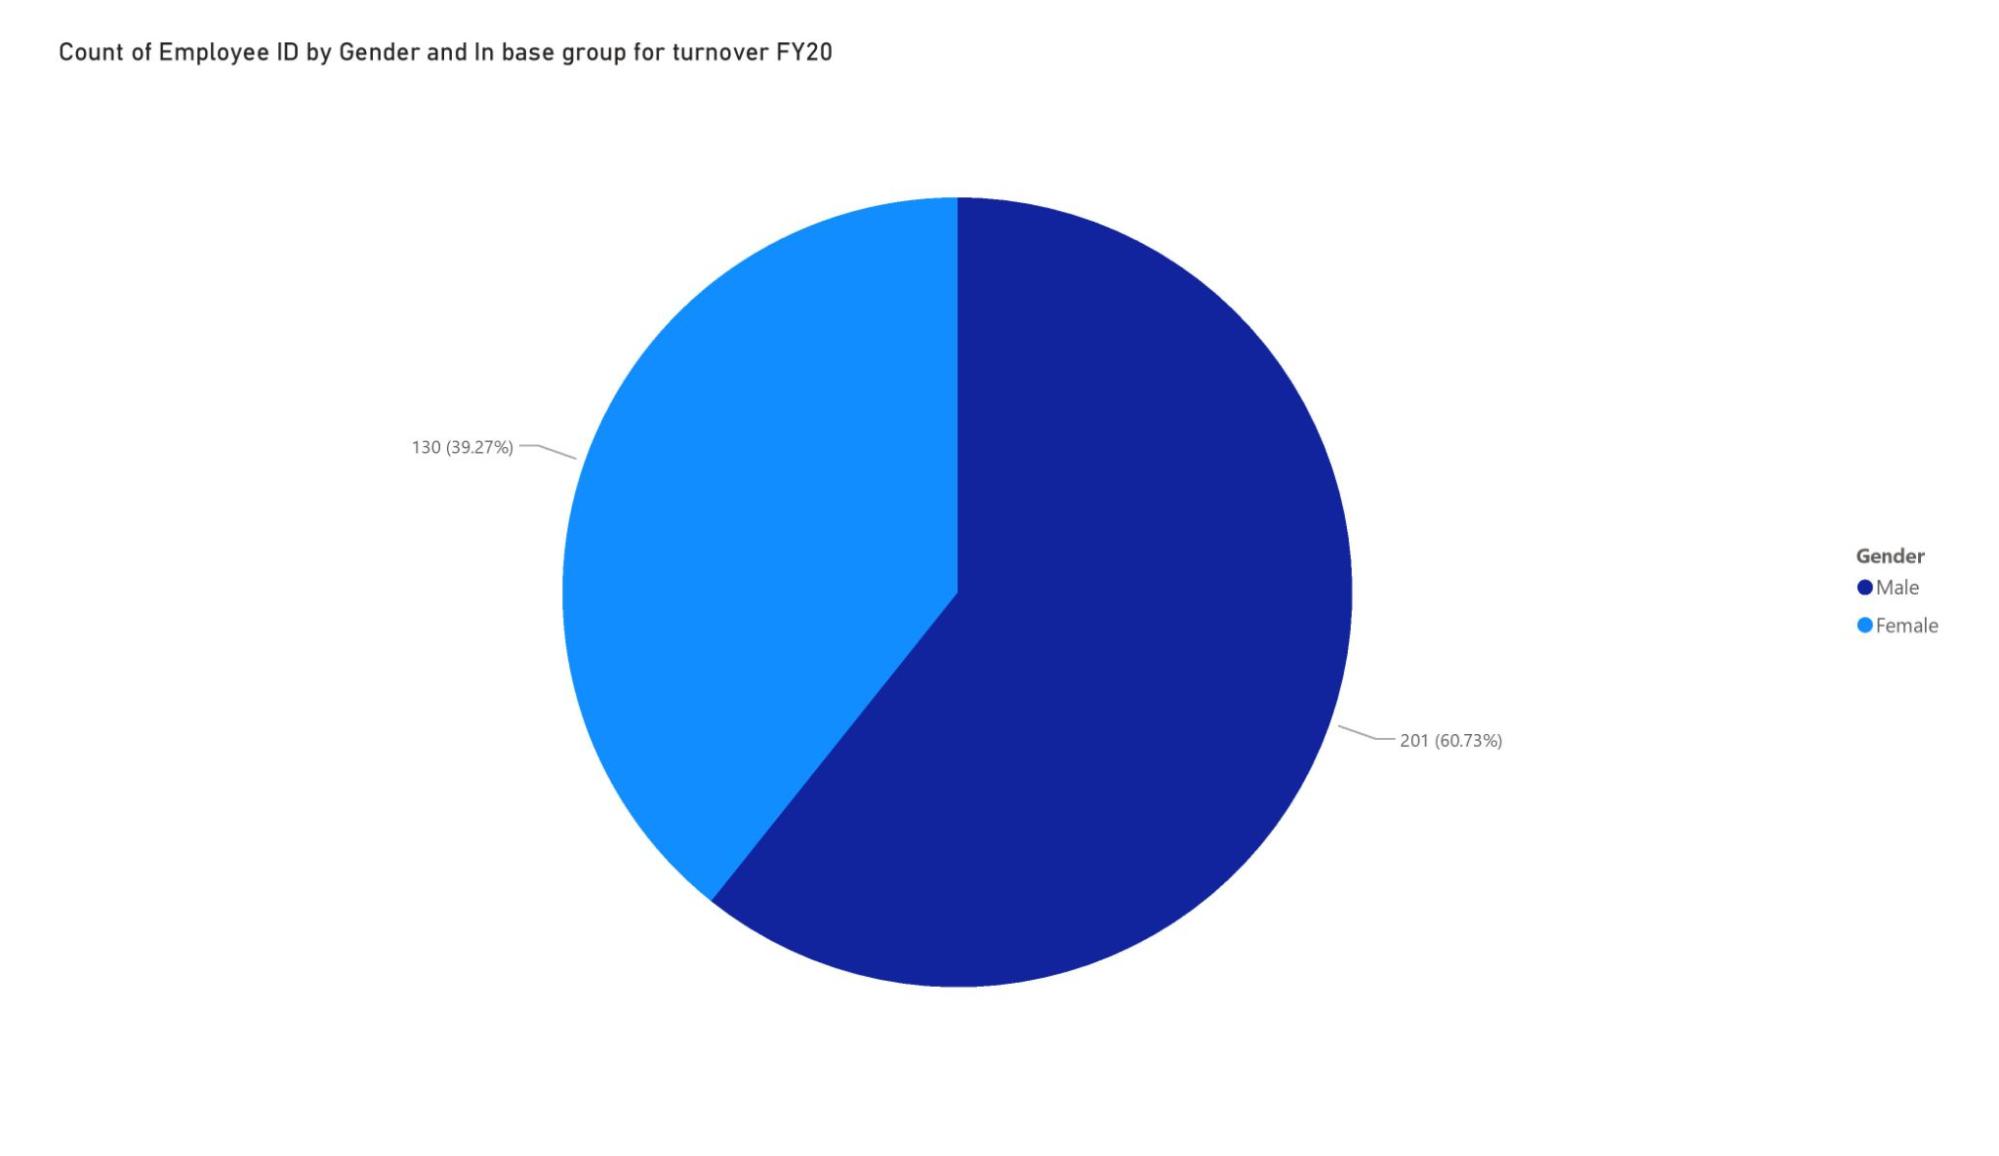
2 Here is the background information on your task | Here is the background information on your taskHuman Resources at our telecom client is highly into diversity and inclusion. They’ve been working hard to improve gender balance at the executive management level, but they’re not seeing any progress. They’re reaching out to us for help. At PwC Switzerland we are often approached by clients seeking support with diversity and inclusion. Companies need a workforce of diverse talents and backgrounds to succeed in an increasingly complex and heterogeneous world. To us, diversity and inclusion are business imperatives, not just nice-to-haves. We aim for all of our teams to feel welcome and appreciated. But actually achieving this and unlocking its potential involves a whole set of practical challenges. Why is this so? Think about the importance of strategy, awareness and education, analytics and inspiration. Here is a hint: Calculating the following measures could help to define proper KPIs:
|
3 Here is your task | Here is your taskYour task is to do the following:
"That’s it, you’re done. Hope this taste of futureproofing yourself with Job Simulation Experience in Power BI as a Digital Accelerator at PwC Switzerland was good. Here are some resources to help youUse the linked resources for helpful guidance on completing your task. Video: How to calculate measures in Power BI Written Instructions: How to calculate measures in Power BI
Podcasts Blog post |
4 Example Answer | Example AnswerGreat work! Take a look at the example answer below to see how a professional would have attempted this task. Think about what you did well and how you can improve. |
5 Completion | |
Finish Line: | |
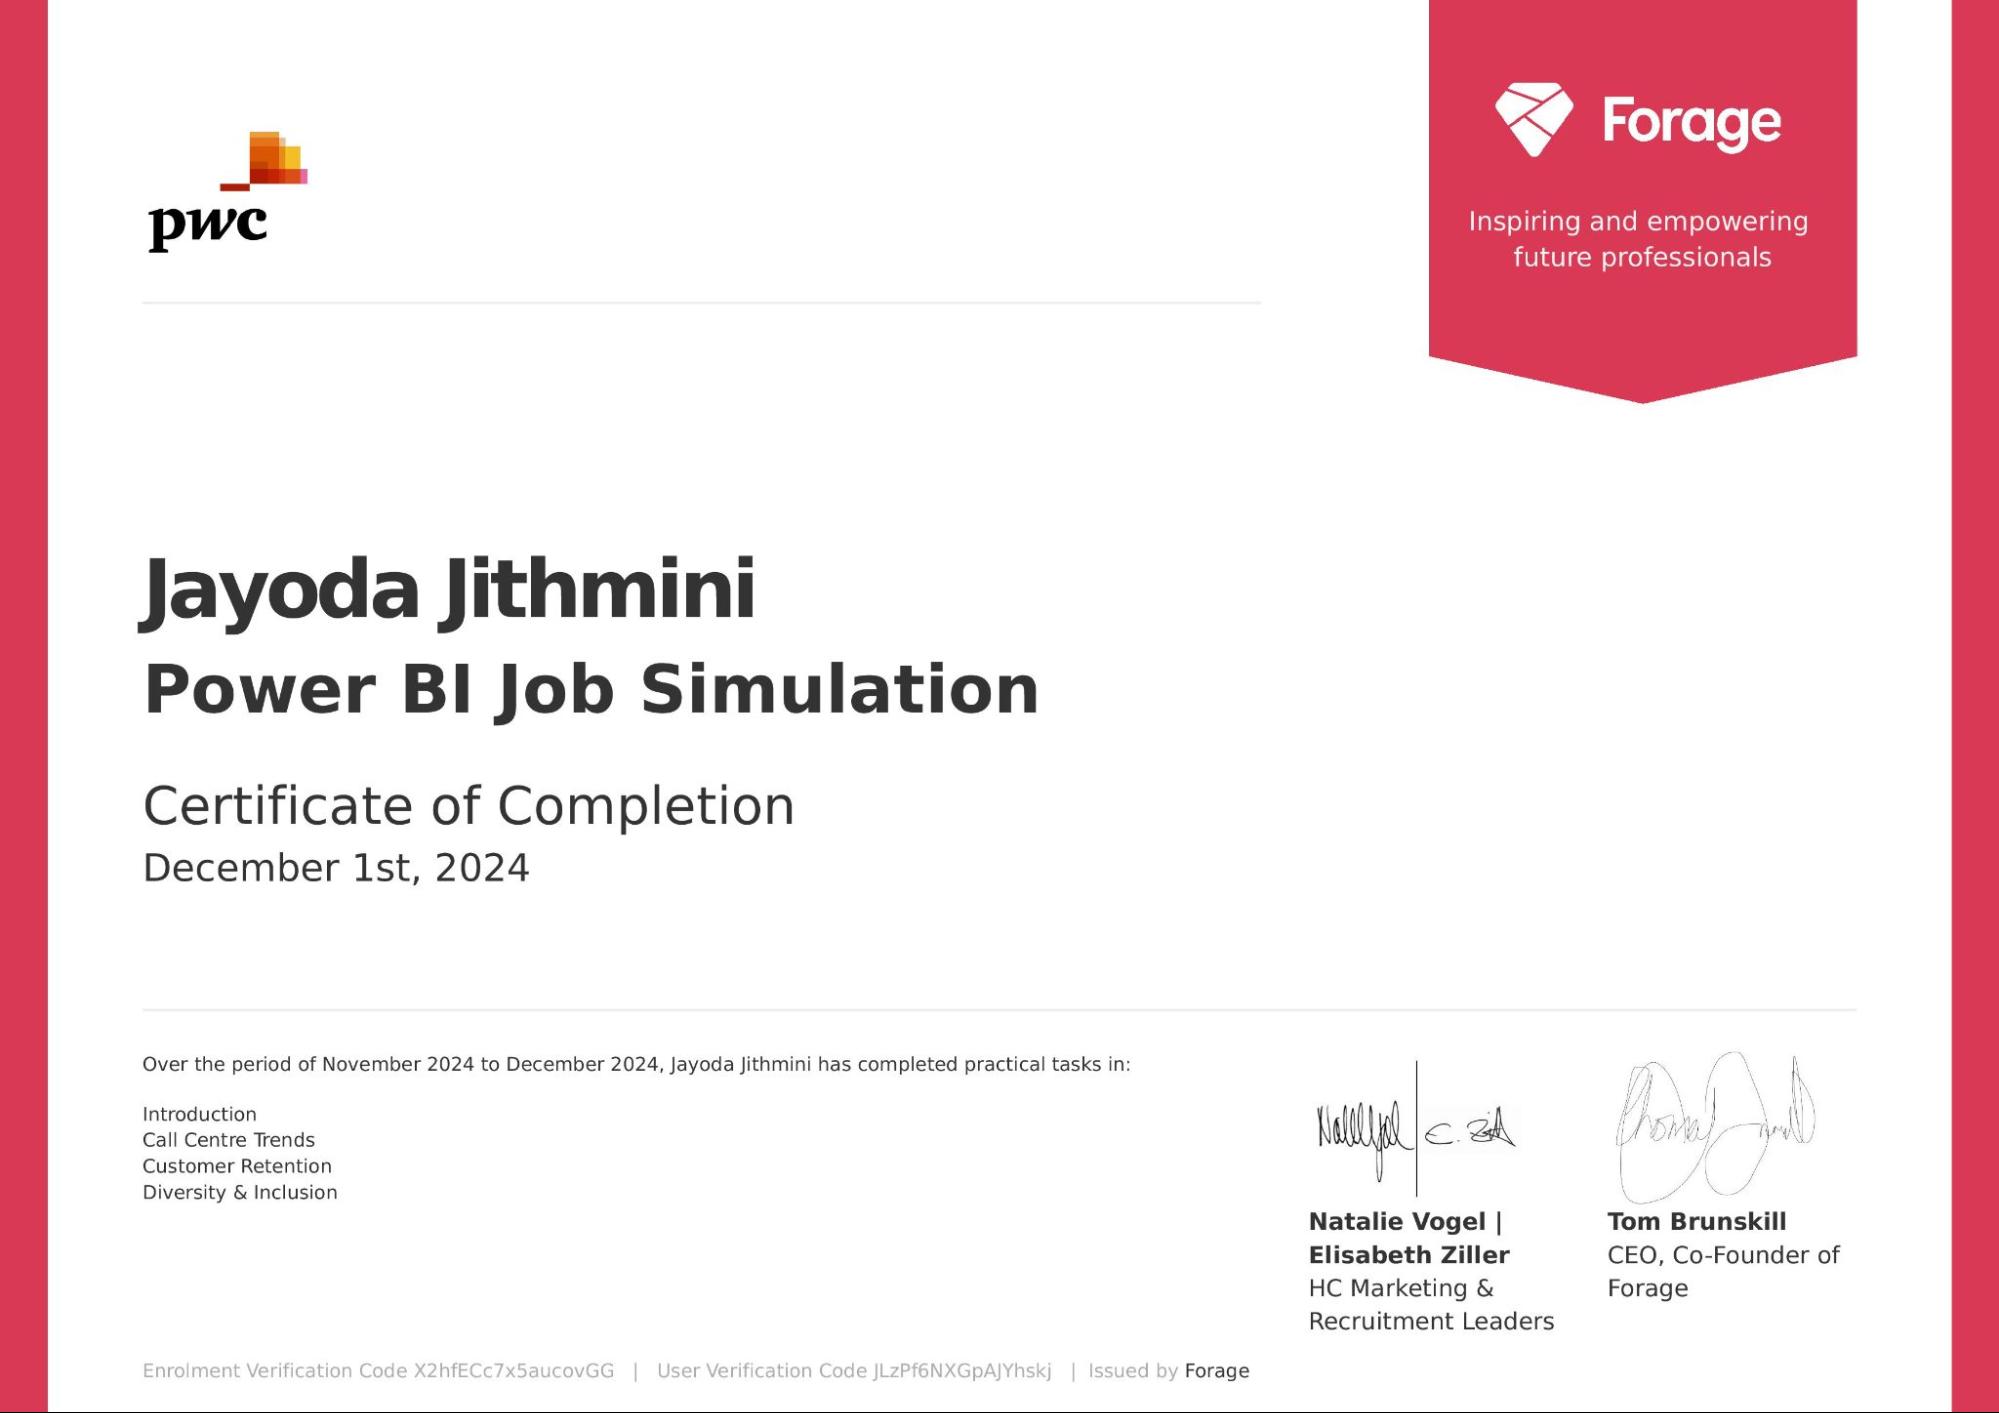
1 Resume Snippet | Resume SnippetTake your updated resume and apply for Jobs , Programs , Events and Talent Networks . PwC Switzerland Power BI Job Simulation on Forage - December 2024
|
2 Interview Tip | Interview TipIn a typical interview you’ll be asked “why are you interested in this role?” or “why are you interested in working at our company?”. Use this interview tip to explain why you want the job. “Why are you interested in this role?”I recently participated in PwC's virtual job simulation on the Forage platform, and it was incredibly useful to learn about how to use PowerBI more effectively. I practiced creating a Power BI dashboard for visualizing key performance indicators (KPIs) and metrics. Doing this program confirmed that I really enjoy working with data visualization using Microsoft PowerBI for diversity and inclusion in the corporate world, and I’m excited to apply these skills at a company like PwC. |