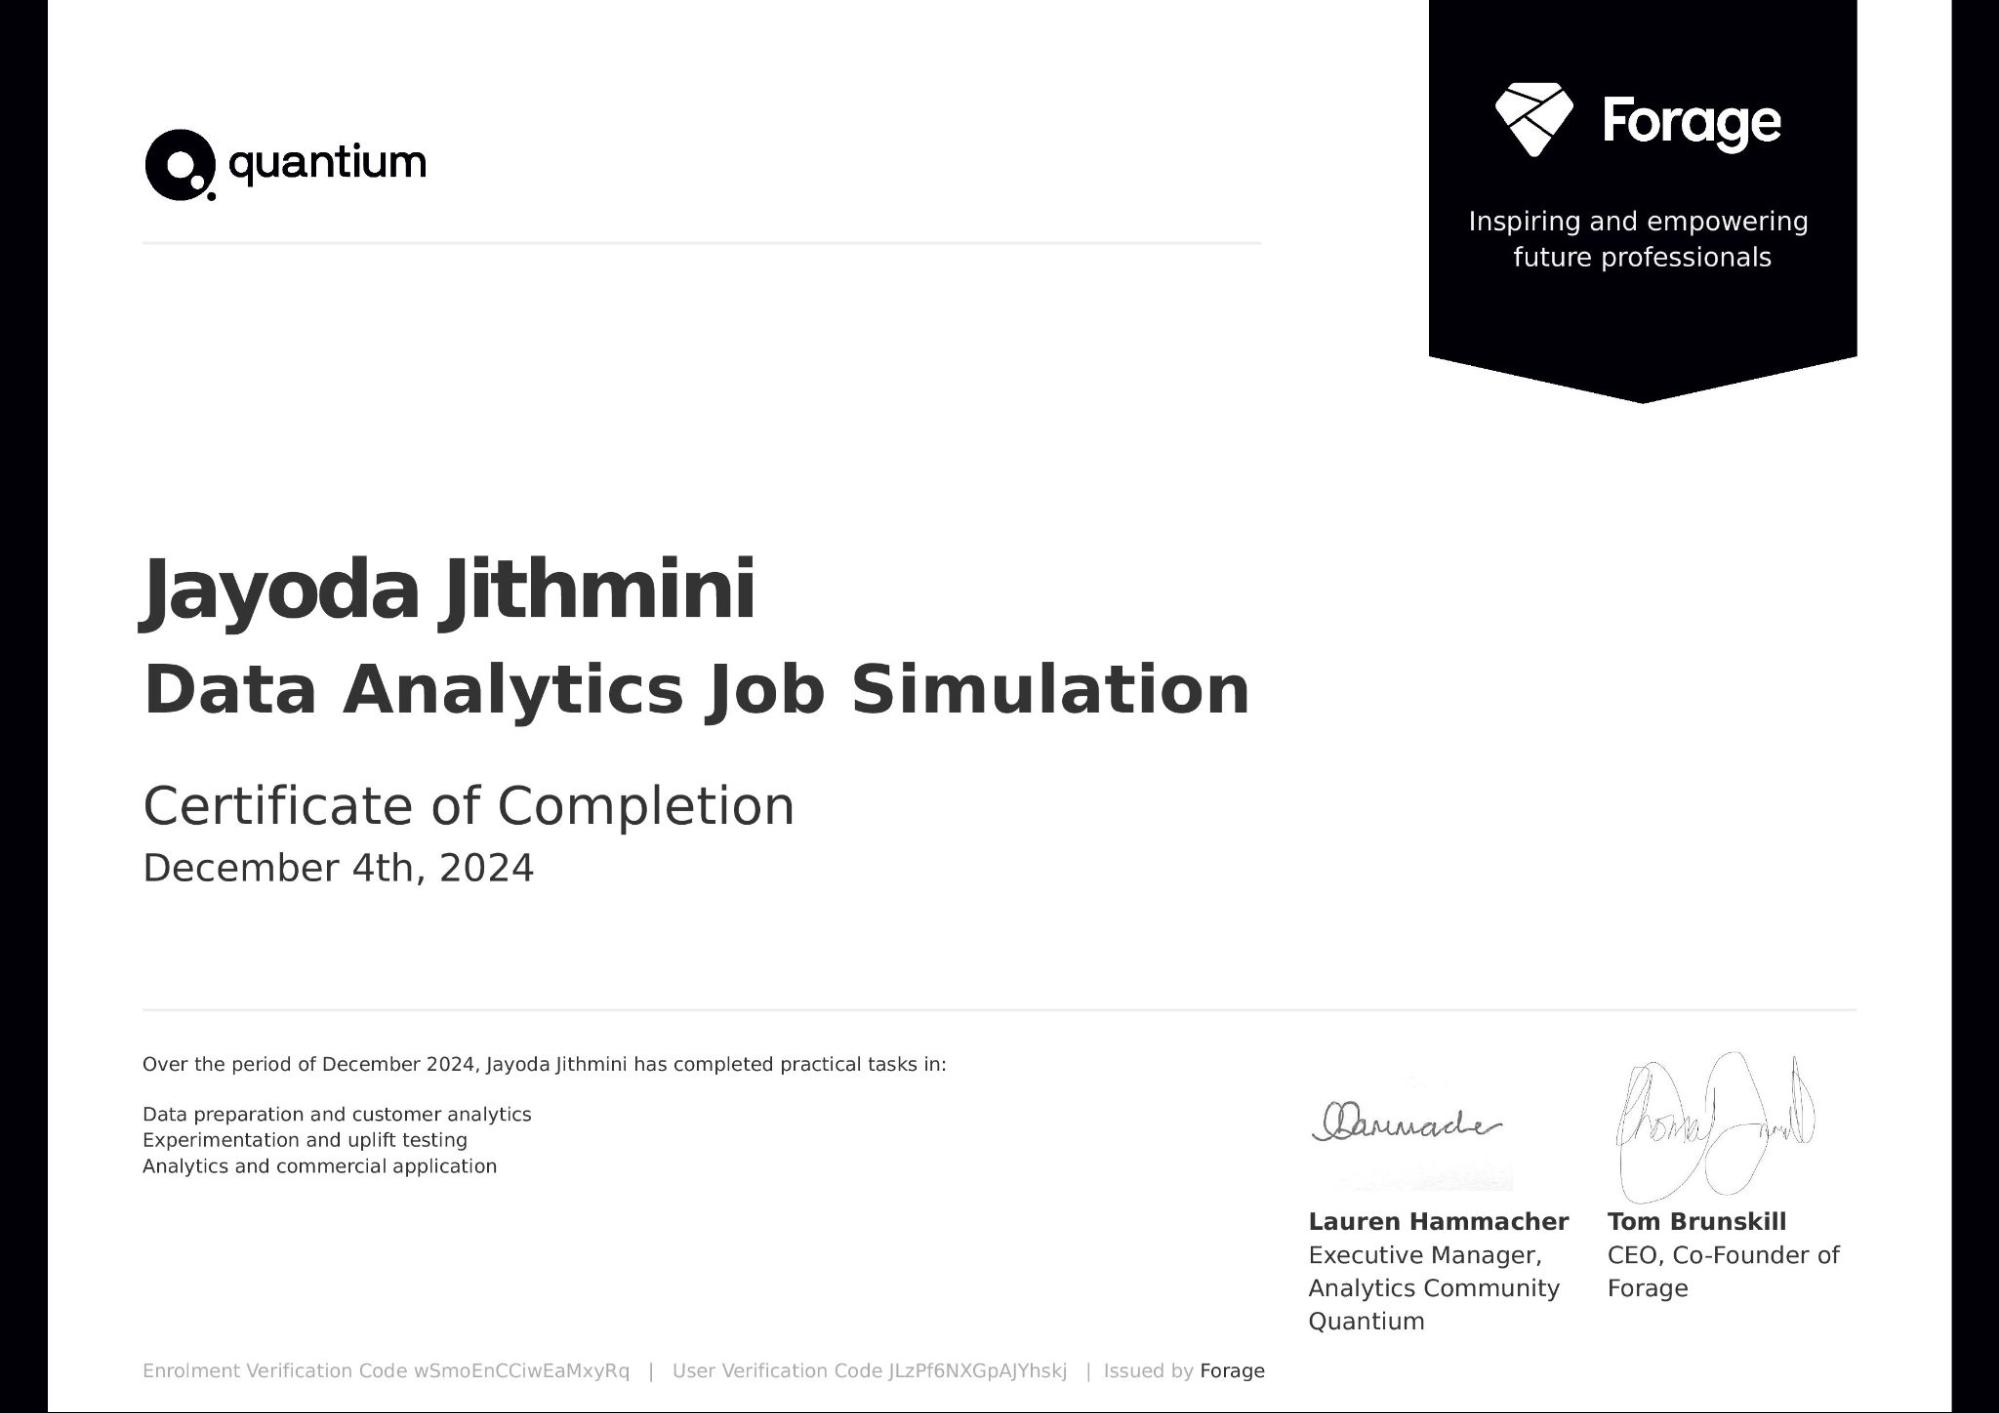
(Forage Job Simulation)
Note Prepared by Mudalige Dona Jayoda Jithmini Kulatunga Undergraduate Student Pearson B.Tech Higher National Diploma (HND) in Computing - Software Engineering ESFOT Metro Campus Colombo, Sri Lanka. |
Check out the simulation here: https://www.theforage.com/simulations/quantium/data-analytics-rqkb |
Task 01 R solution: https://jithminijayoda.github.io/TutorialNotes/Data%20Analytics%20Job%20Simulations/Quantium:%20Data%20Analytics/R-Solution-Task-01.html |
Task 02 R solution: https://jithminijayoda.github.io/TutorialNotes/Data%20Analytics%20Job%20Simulations/Quantium:%20Data%20Analytics/R-Solution-Task-02.html |
Task 03 R solution: https://jithminijayoda.github.io/TutorialNotes/Data%20Analytics%20Job%20Simulations/Quantium:%20Data%20Analytics/R-Solution-Task-03.html |
anomalies - අසාමාන්යතා | Unusual occurrences Whilst - සමඟ | While or during derive - ලබන්න | Obtain or extract jargon - වෘත්තීය භාෂාව | Specialized terms or language |
Introduction | Data AnalyticsExplore the power of data and its ability to power breakthrough possibilities for individuals, organisations and societies with Quantium. Data Free 6900+ 5 Star Reviews | ||||||||||||||
Why complete our Job Simulation | Why complete our Job SimulationA risk-free way to experience work on the job with us at Quantium. Practice your skills with example tasks and build your confidence to ace your applications. Self-paced 4-5 hours No grades No assessments Advanced Founded in 2002, Quantium has a long history of innovation in data science across all sectors of the economy. As a rapidly growing global leader in data science and AI, we are dedicated to growing our team of ambitious, diverse, and fun employees! Our team of employees work together to harness the power of data to drive revolutionary change that benefits us all and deliver the best results for our clients. | ||||||||||||||
Skills you will learn and practice: | Skills you will learn and practice:Data validation, Data visualisation, Data wrangling, Programming, Data analysis, Commercial thinking, Statistical testing, Presentation skills, Communication skills | ||||||||||||||
How it works | How it worksComplete tasks guided by pre-recorded videos and example answers from our team at Quantium. No live sessions, all self-paced. Earn a certificate and add it to your resume and LinkedIn as an extra curricular activity. Stand out in applications. Confidently answer interview questions and explain why you’re a good fit for our team. | ||||||||||||||
Tasks in this program | Task One: Data preparation and customer analytics1-2 hours Advanced Conduct analysis on your client's transaction dataset and identify customer purchasing behaviours to generate insights and provide commercial recommendations. What you'll learn
What you'll do
Task Two: Experimentation and uplift testing1-2 hours Advanced Extend your analysis from Task 1 to help you identify benchmark stores that allow you to test the impact of the trial store layouts on customer sales. What you'll learn
What you'll do
Task Three: Analytics and commercial application1-2 hours Advanced Use your analytics and insights from Task 1 and 2 to prepare a report for your client, the Category Manager. What you'll learn
What you'll do
Finish LineCollect these achievements and tips to help you stand out in your job search. Interview Tips How to talk about this experience in your interviews. Resume Snippet A summary ready for your resume. | ||||||||||||||
Task One: Data preparation and customer analytics | |||||||||||||||
1 Task Overview | Task OverviewWhat you'll learn
What you'll do
| ||||||||||||||
2 Here is the background information on your task | Here is the background information on your taskYou are part of Quantium’s retail analytics team and have been approached by your client, the Category Manager for Chips, who wants to better understand the types of customers who purchase Chips and their purchasing behaviour within the region. The insights from your analysis will feed into the supermarket’s strategic plan for the chip category in the next half year. You have received the following email from your manager, Zilinka.
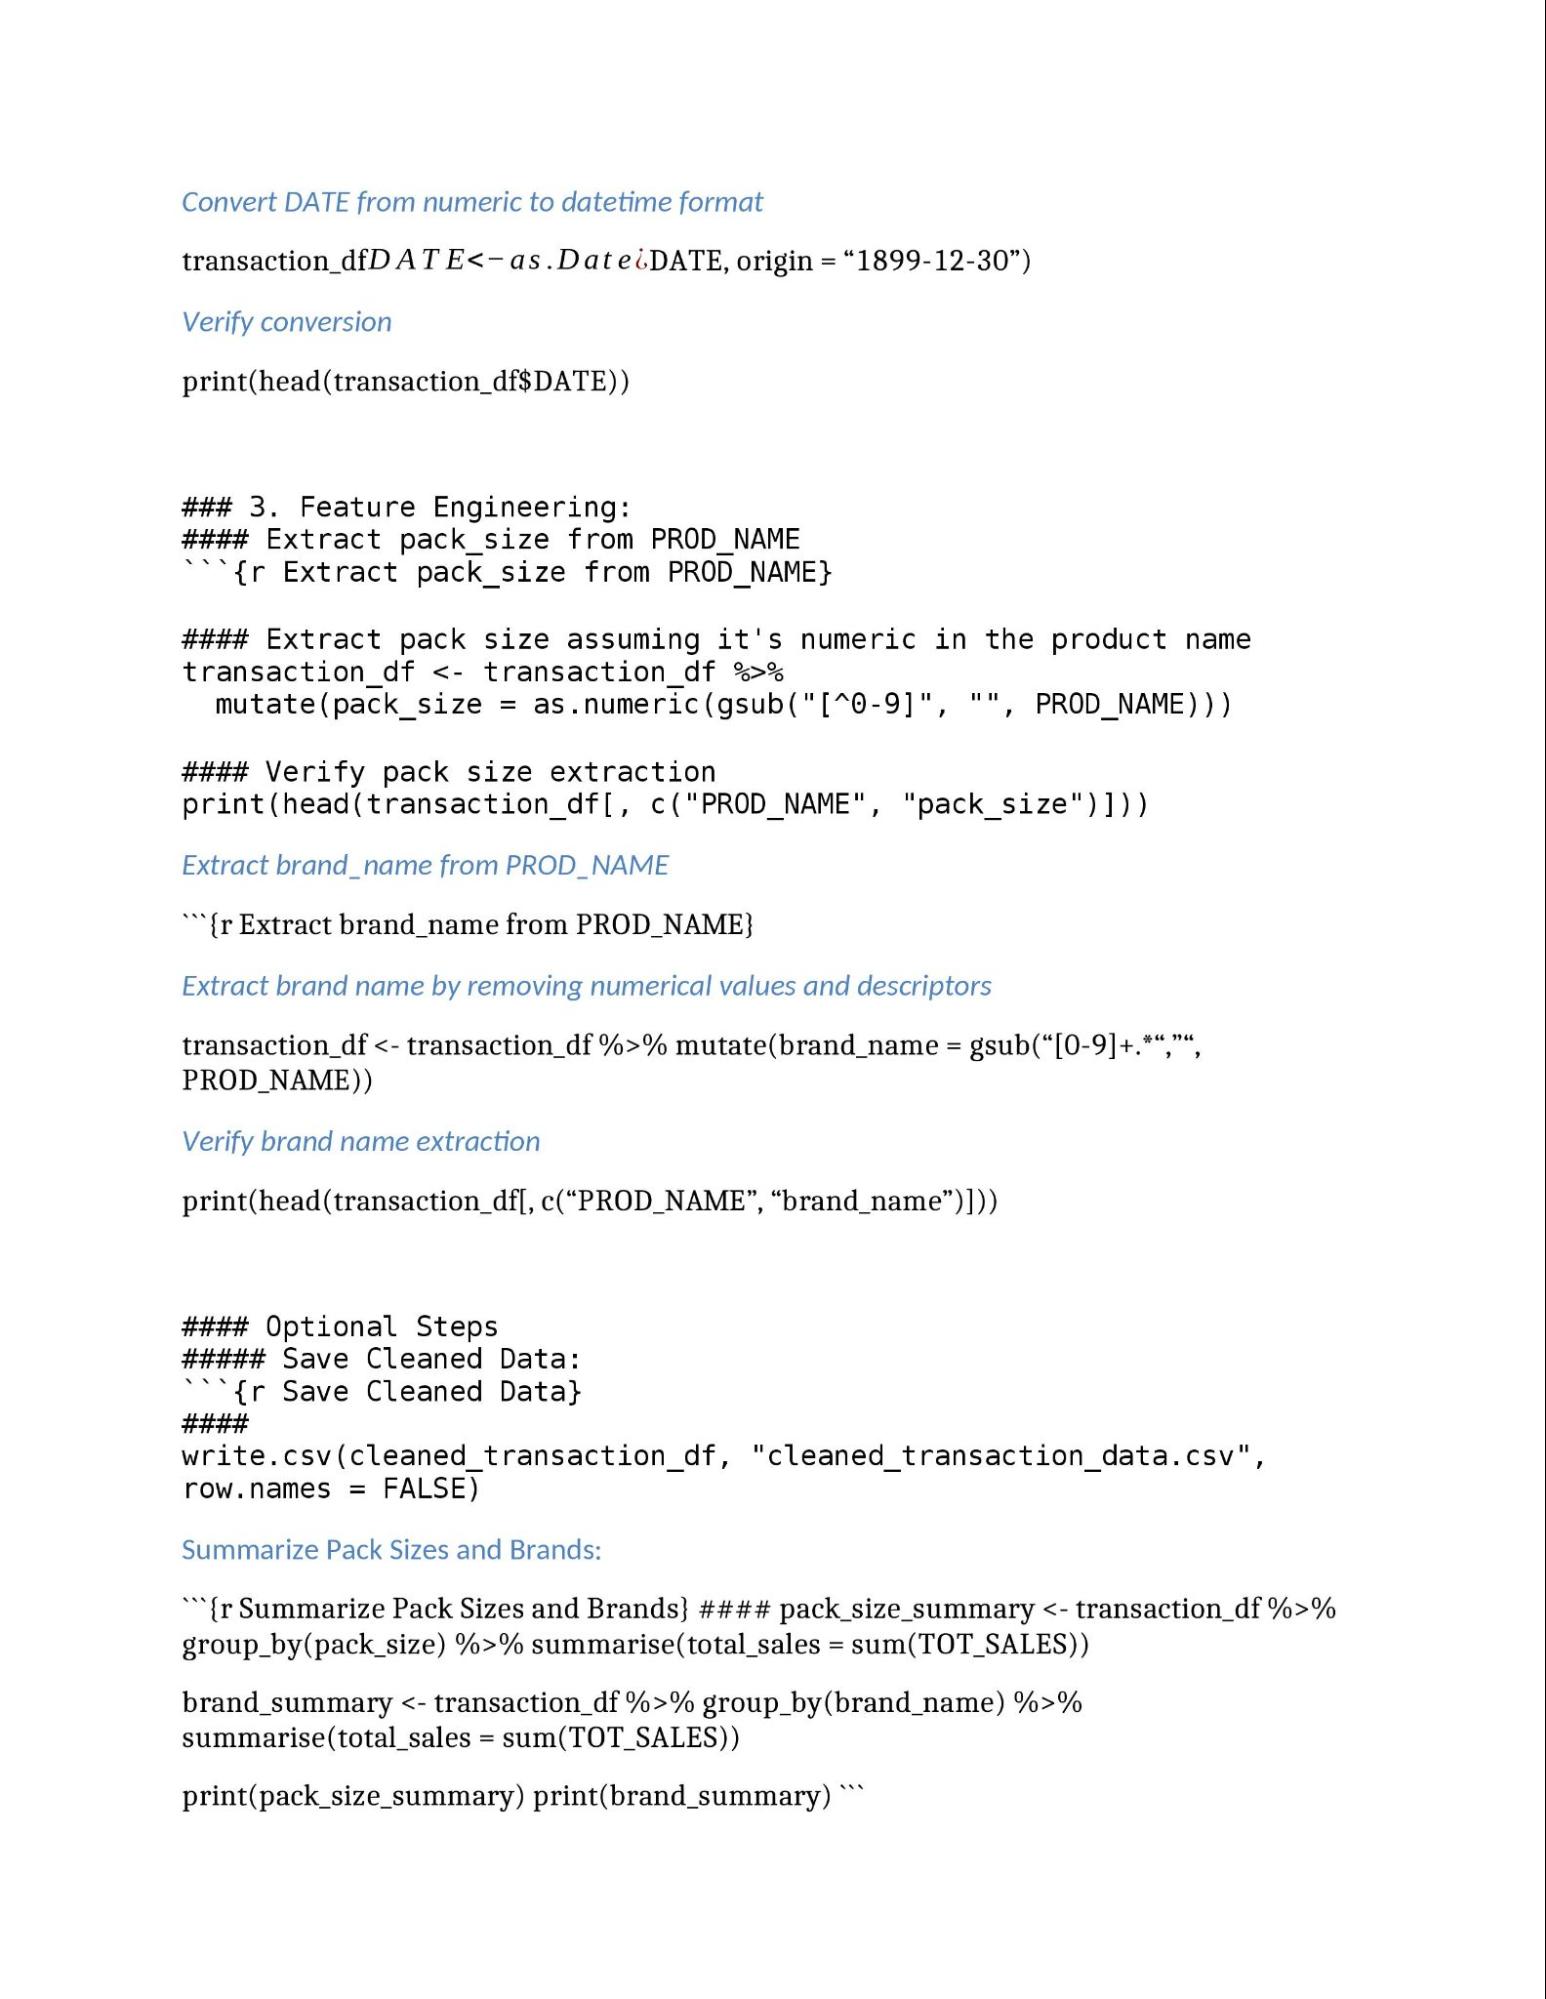
Chat GPT Help: 1. Examine Transaction Data
2. Examine Customer Data
3. Data Analysis and Visualization
4. Customer Segmentation
5. Recommendations
6. Documentation
Let me know if you’d like help with any specific part, like setting up the analysis framework, creating visualizations, or drafting your report! | ||||||||||||||
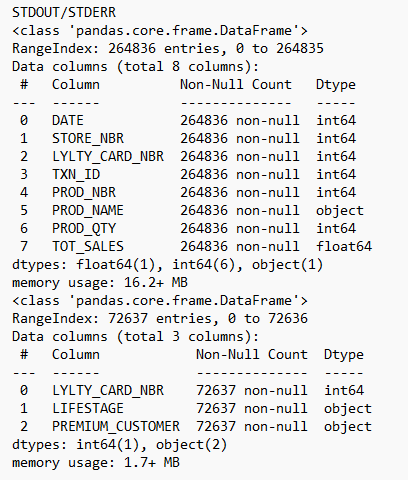
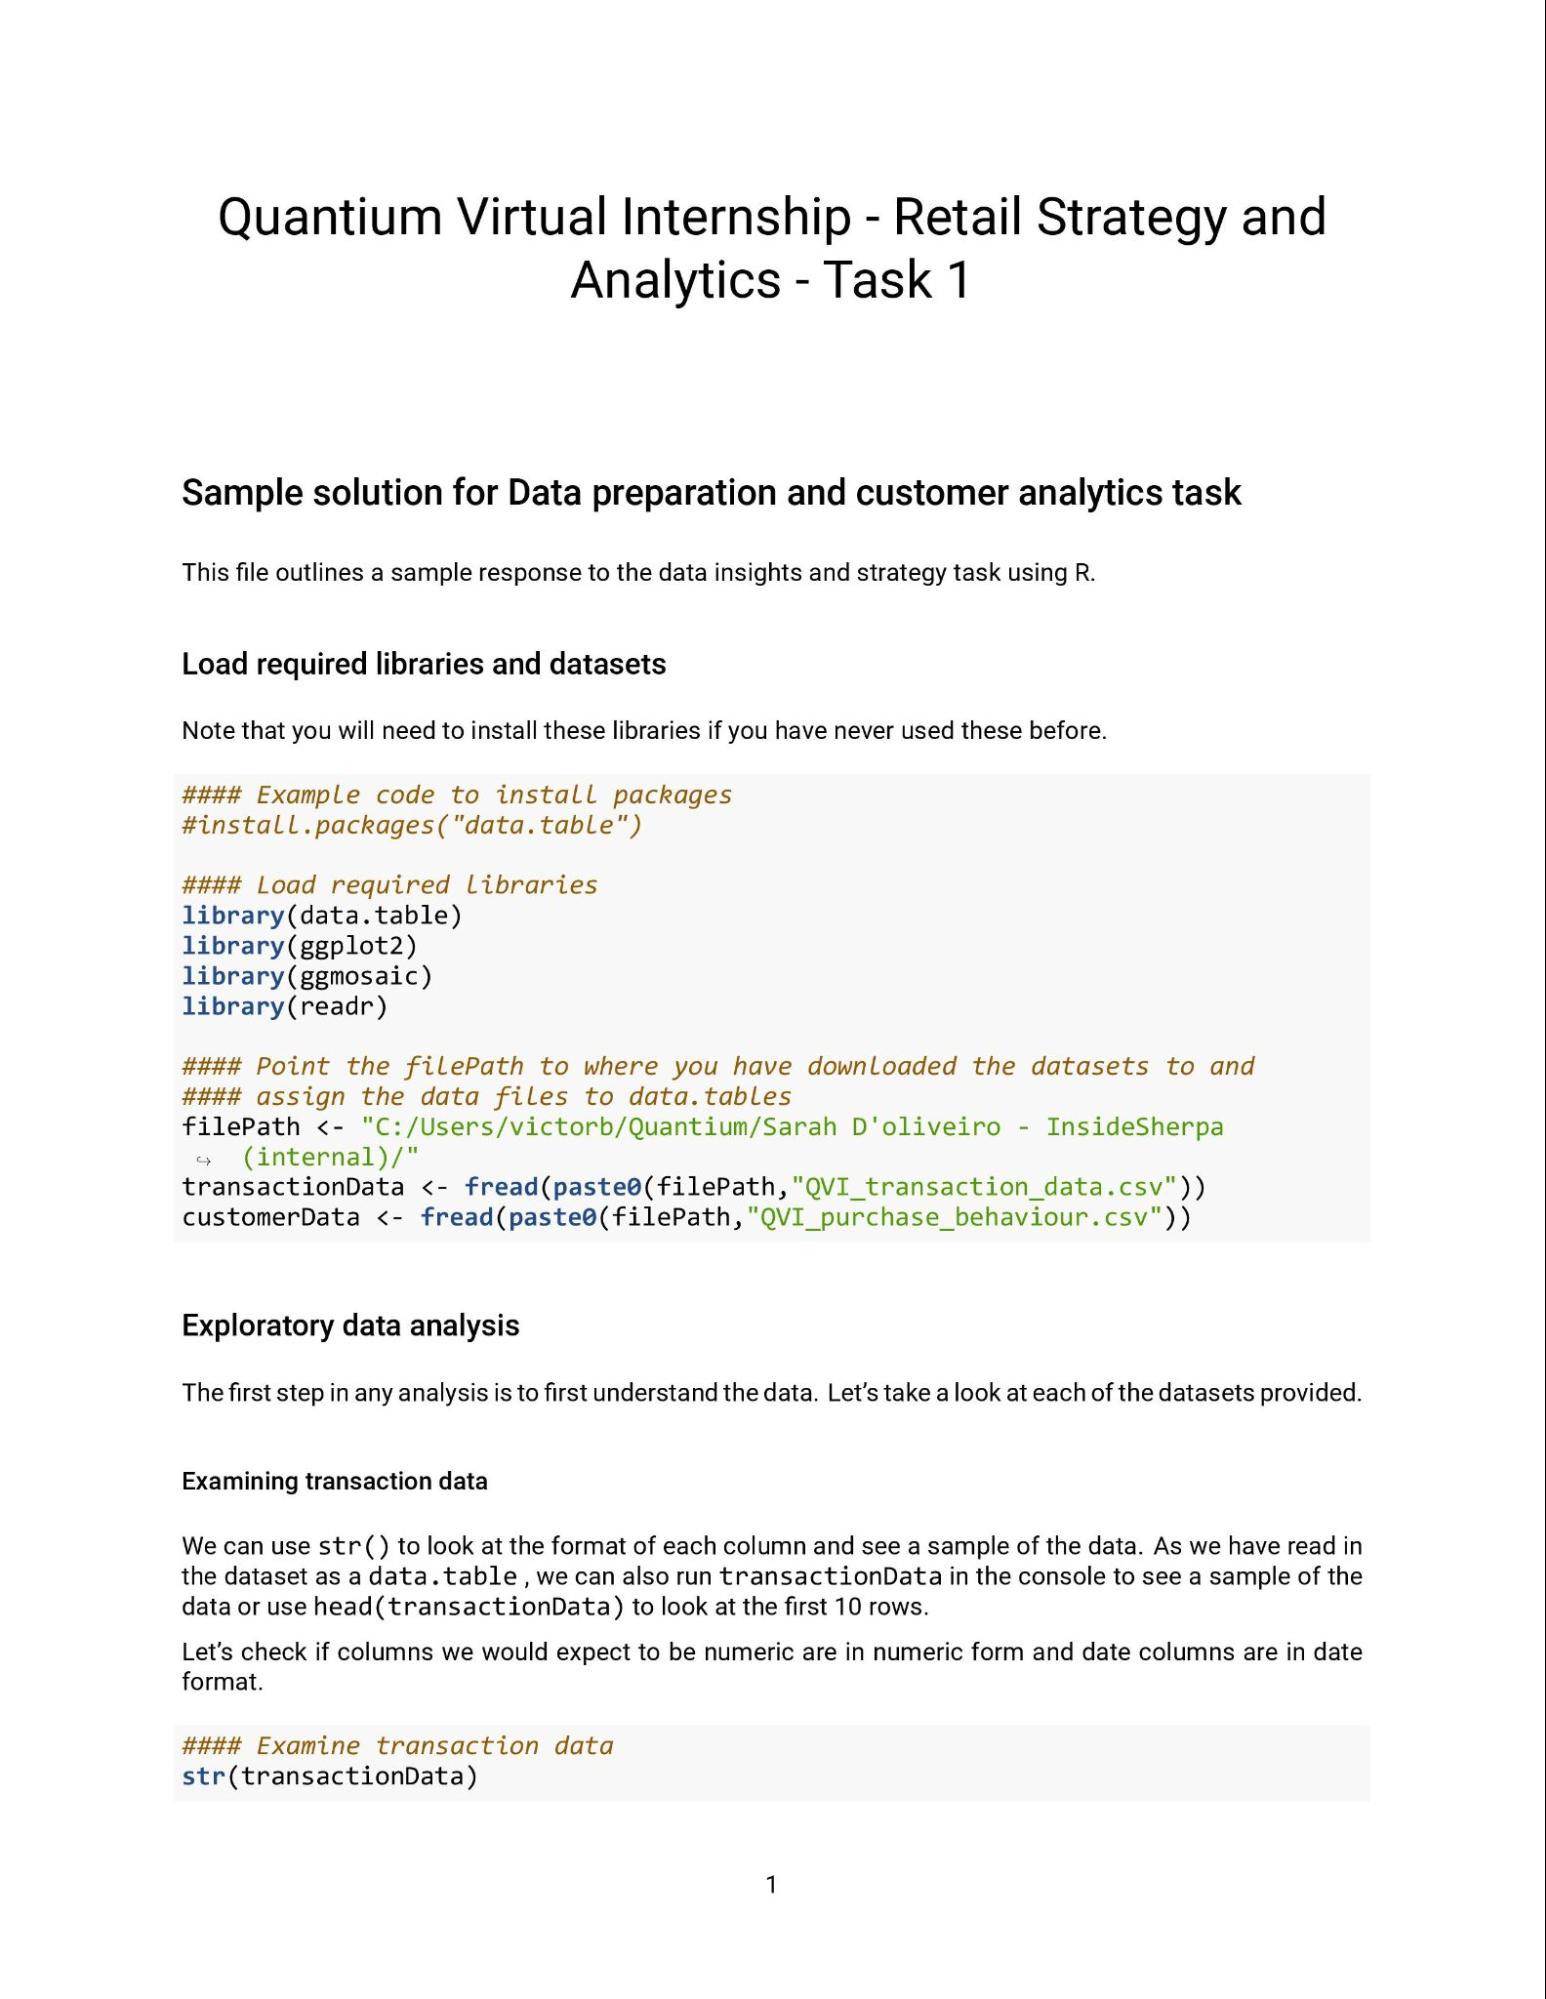
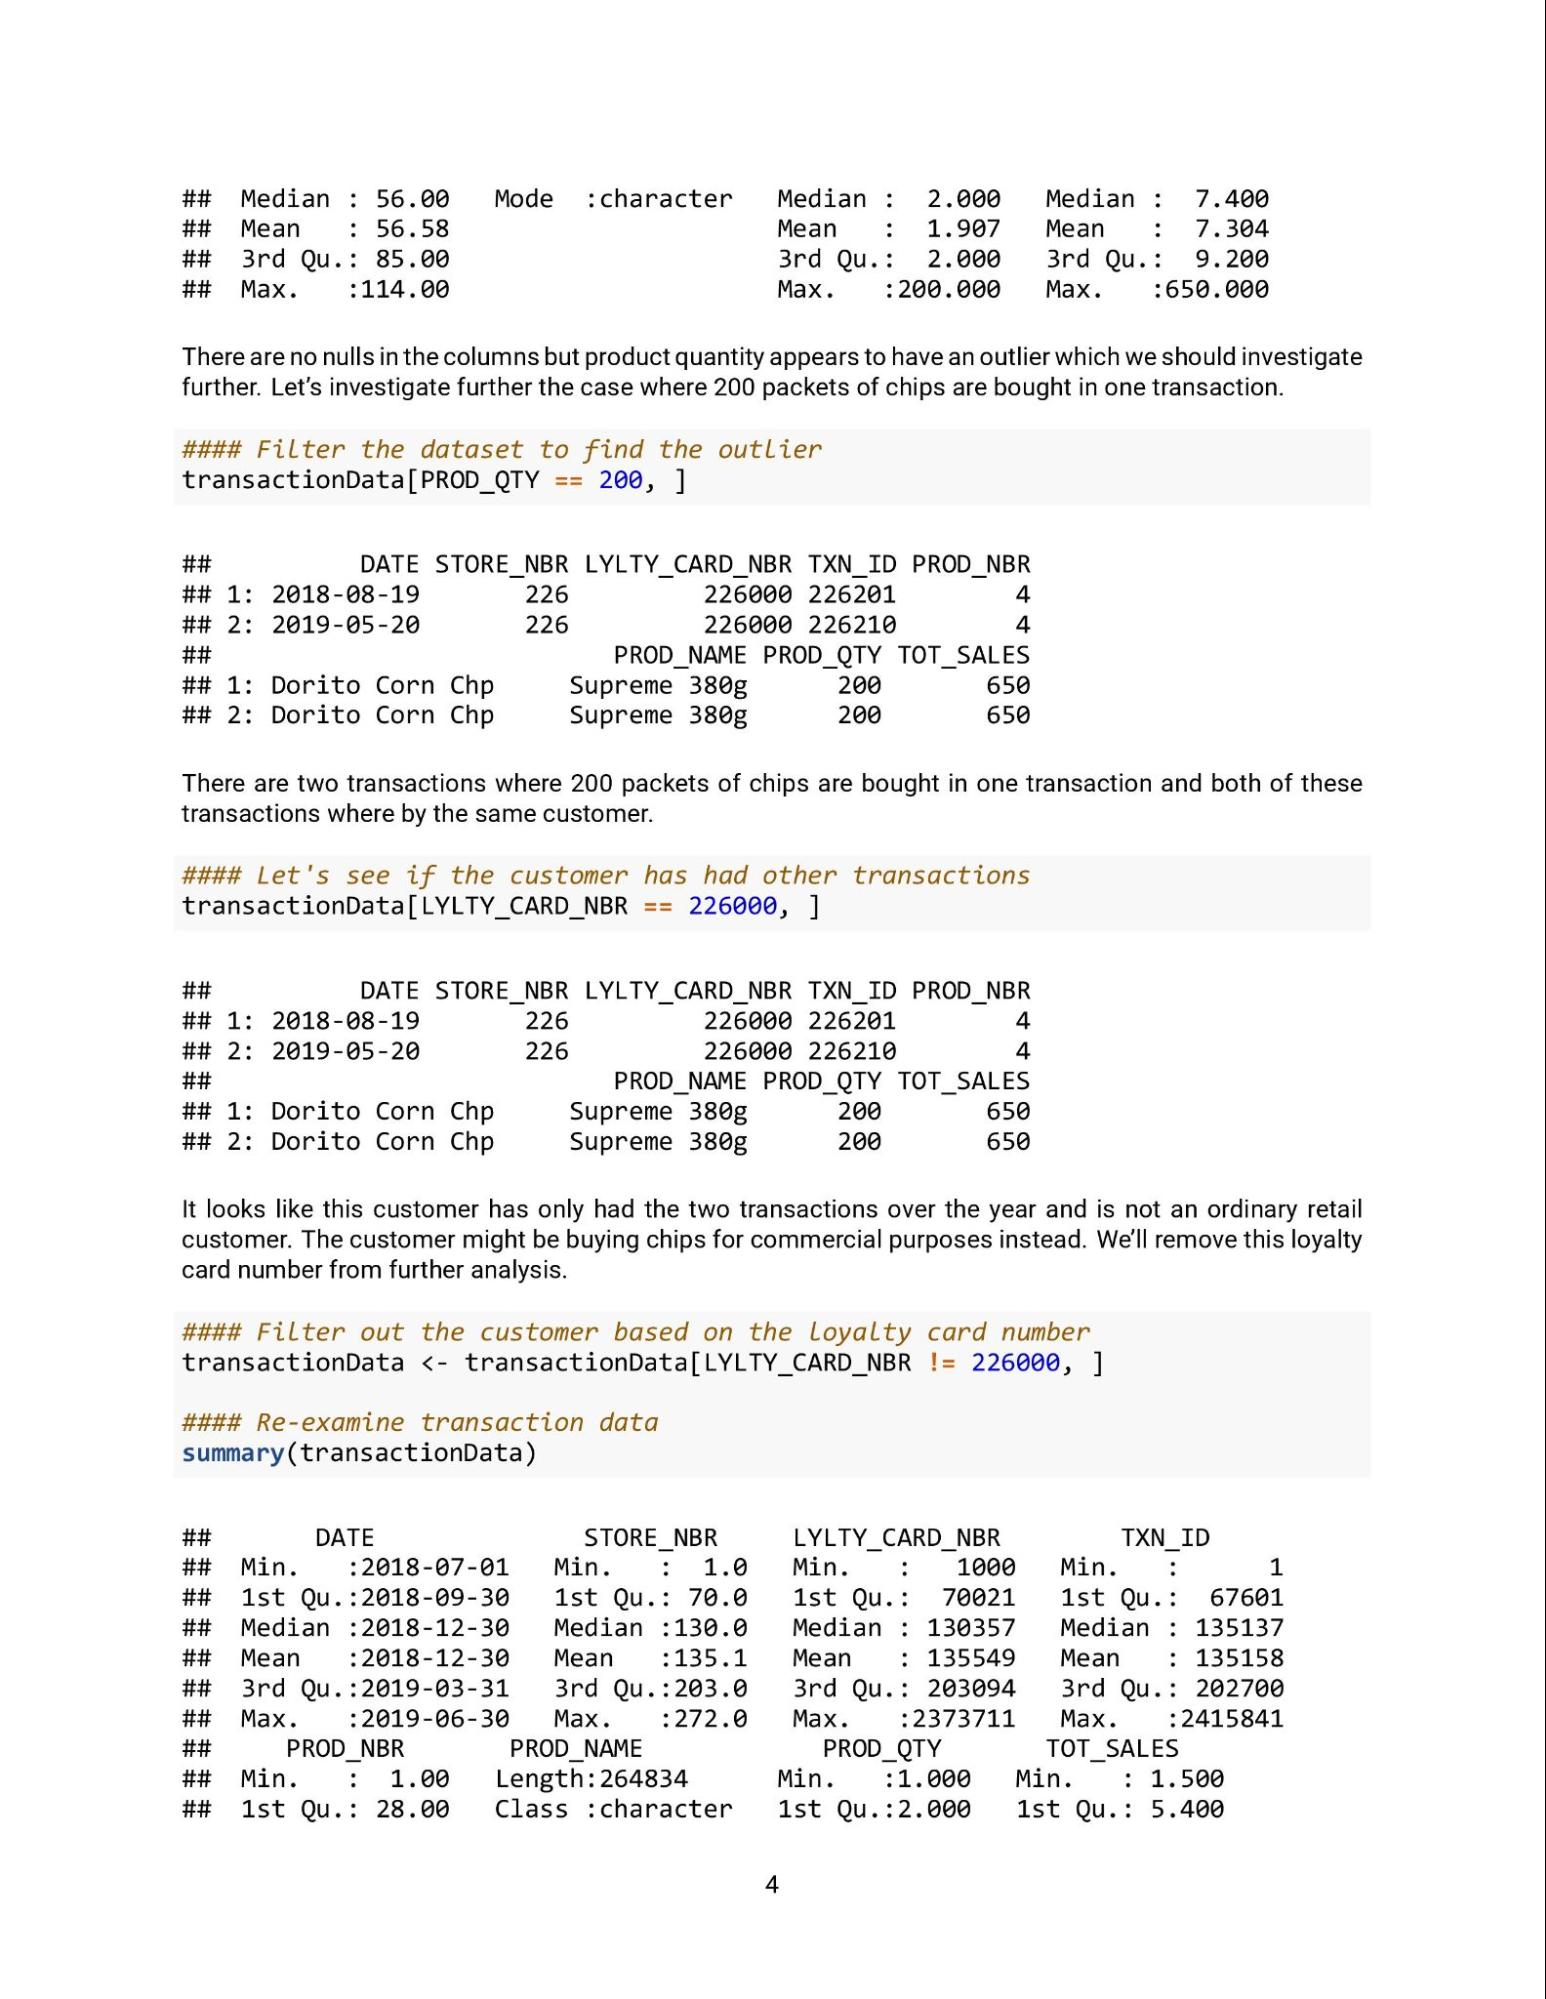
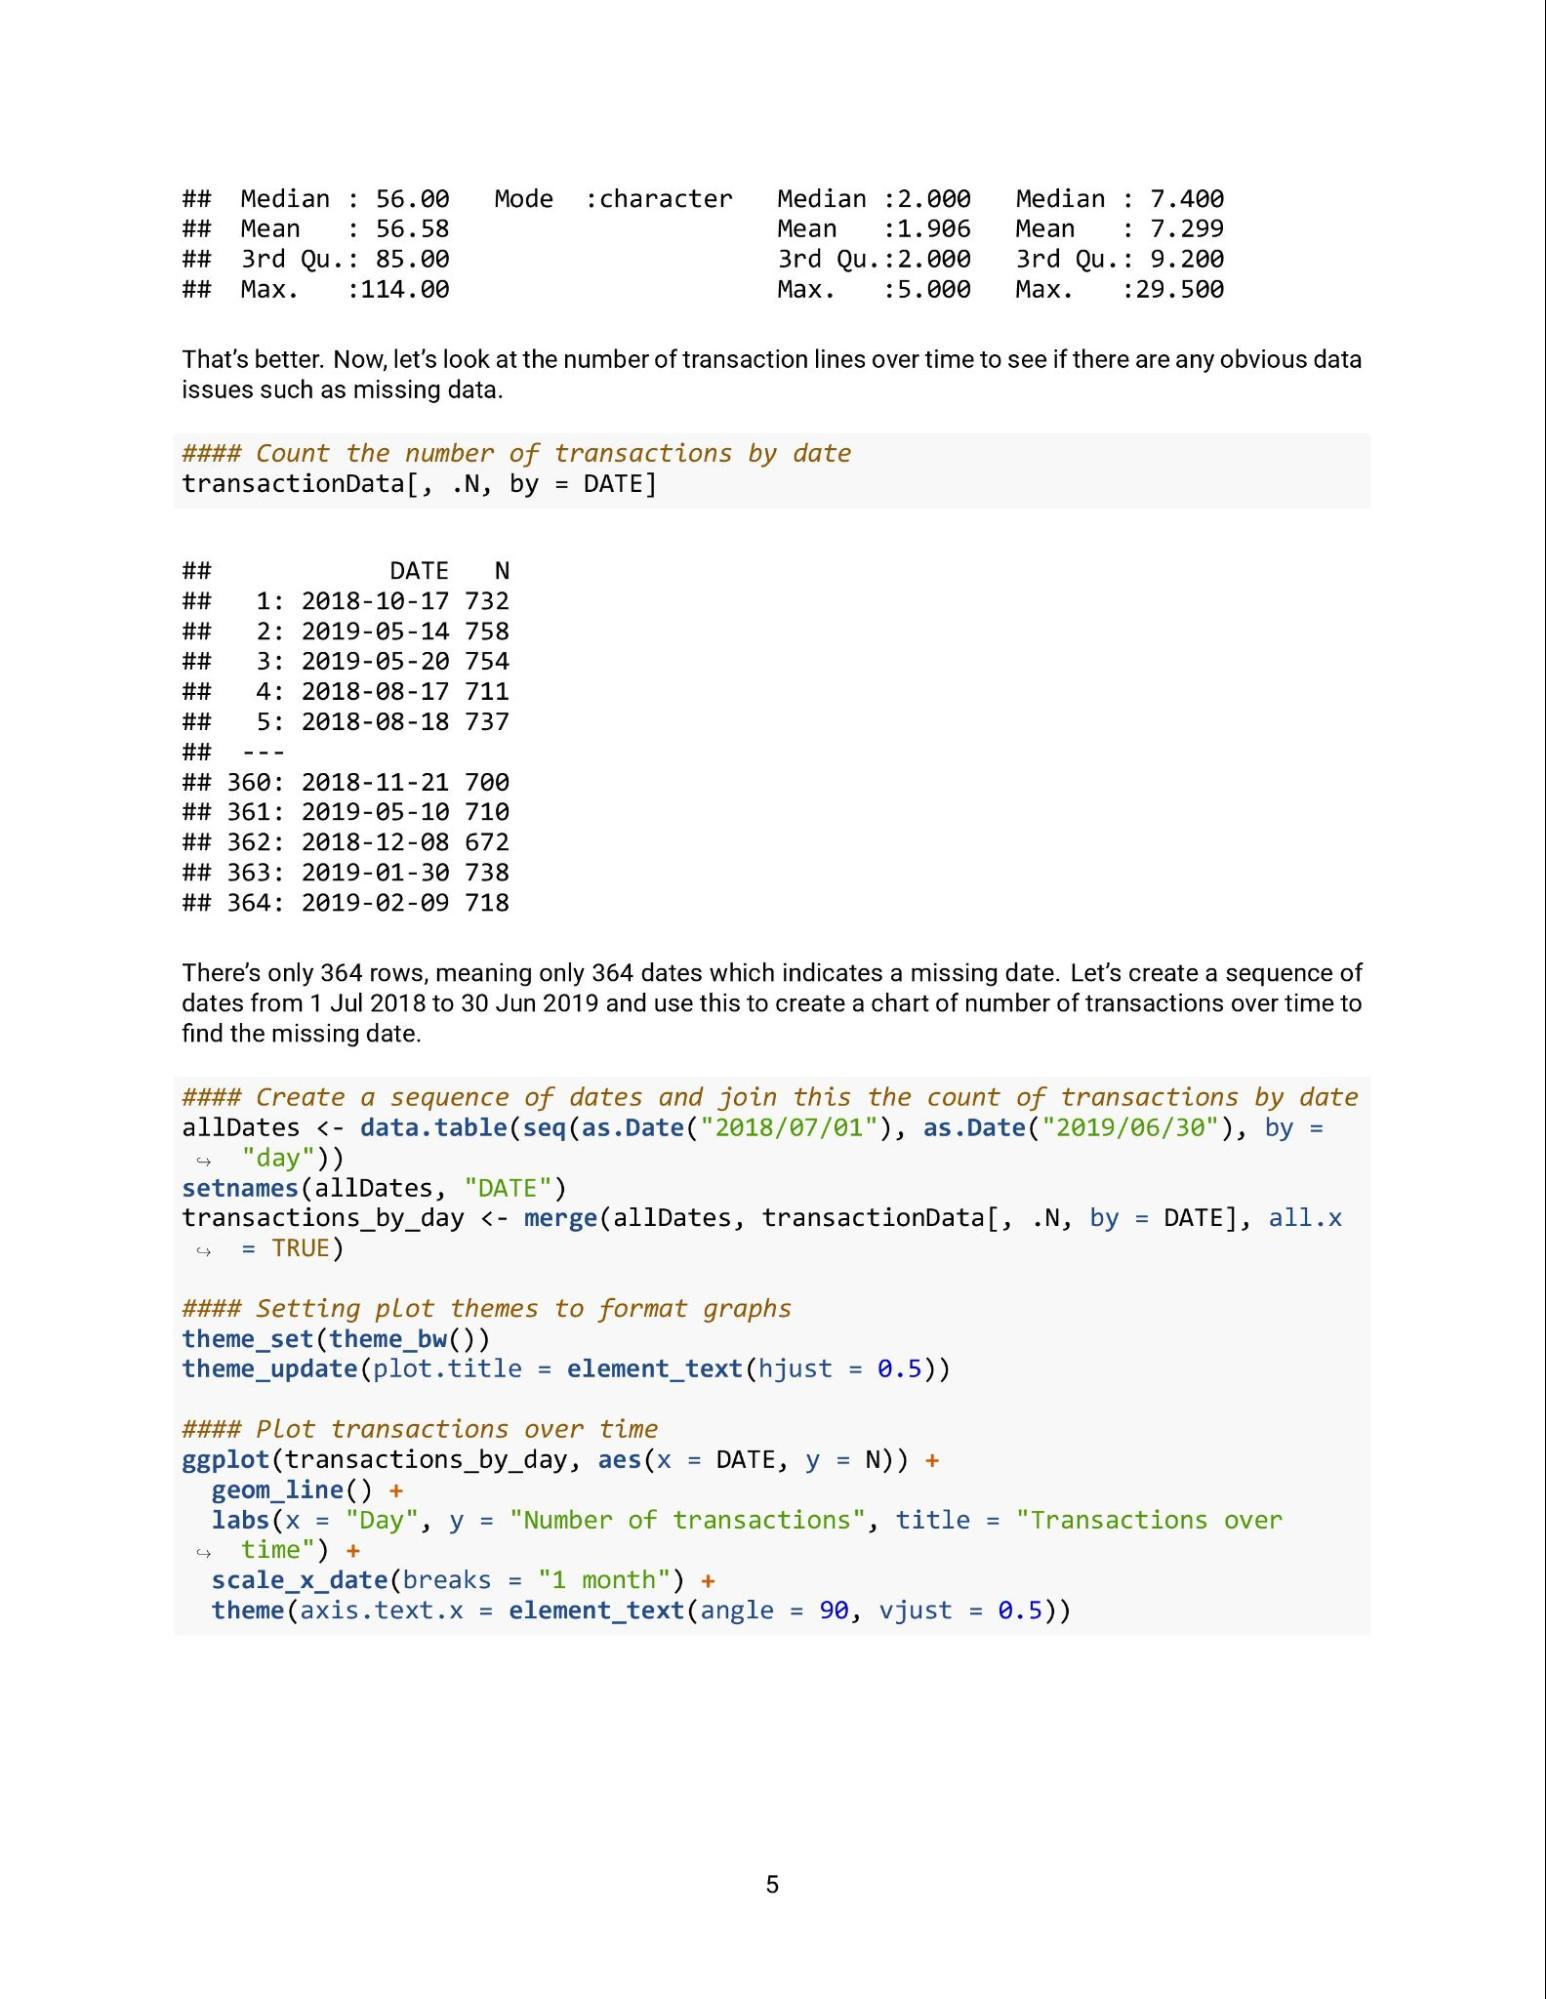
3 Here is your task | Here is your taskWe need to present a strategic recommendation to Julia that is supported by data which she can then use for the upcoming category review. However, to do so, we need to analyse the data to understand the current purchasing trends and behaviours. The client is particularly interested in customer segments and their chip purchasing behaviour. Consider what metrics would help describe the customers’ purchasing behaviour. We have chosen to complete this task in R, however you will also find Python to be a useful tool in this piece of analytics. If you aren’t familiar with R or Python we would recommend searching a few online courses to help get you started. We have also provided an R solution template if you want some assistance in getting through this Task. Whilst its possible to complete the task in Excel you may find the size of the data and the nature of the tasks is such that it is more difficult to complete in Excel. To get started, download the resource csv data files below and begin performing high-level data checks such as:
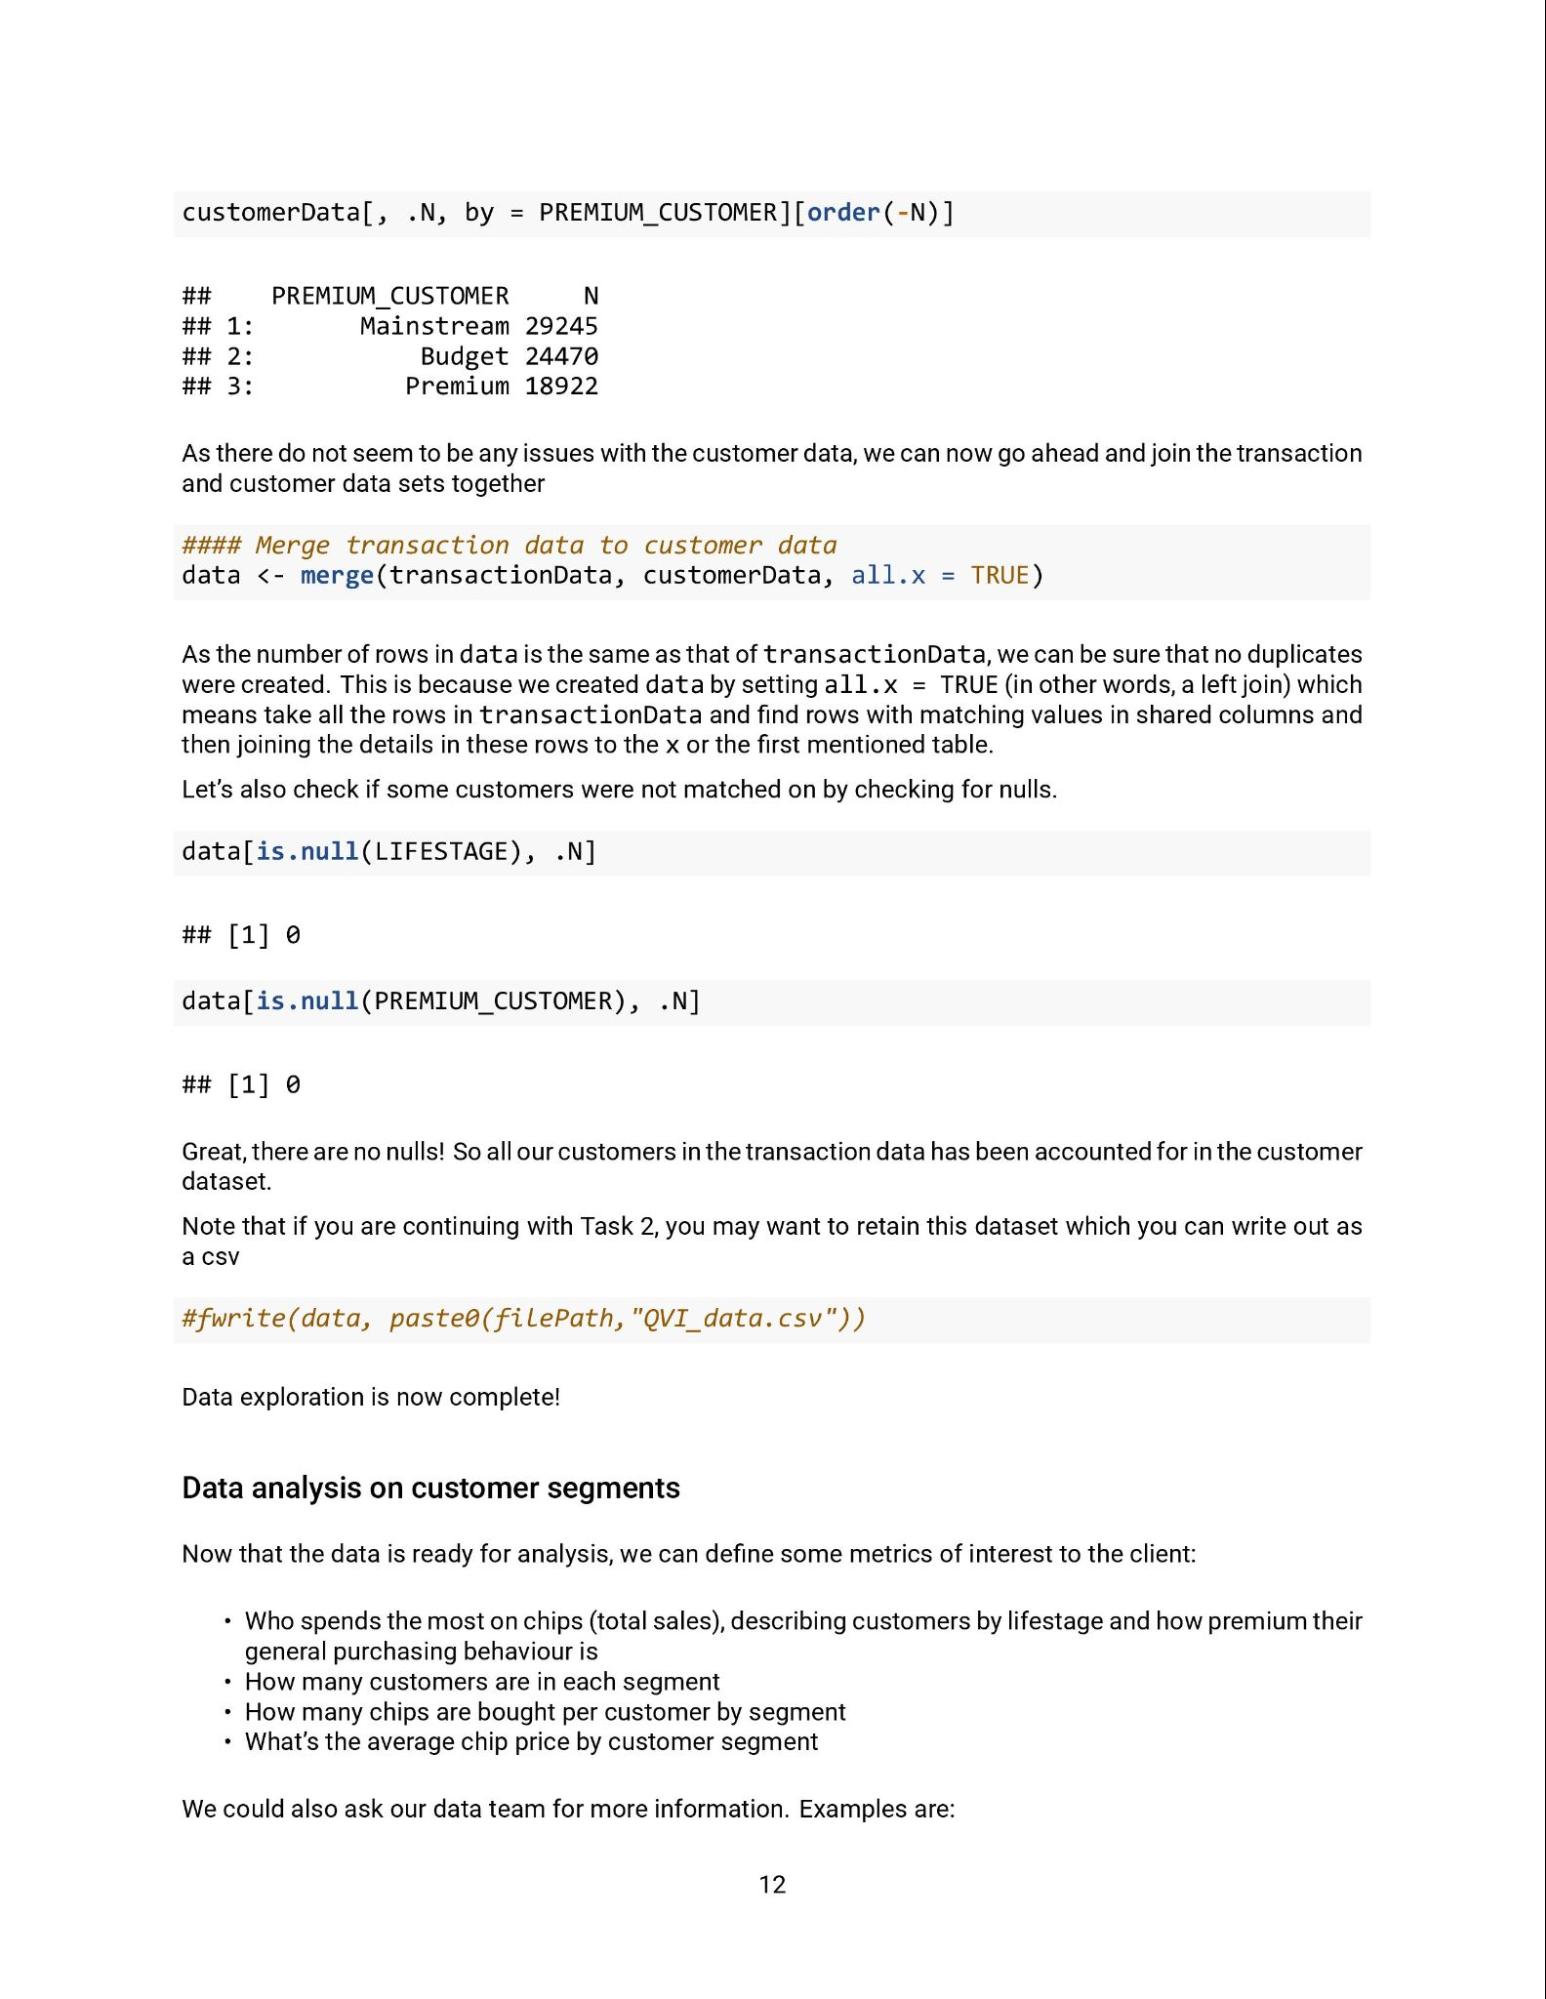
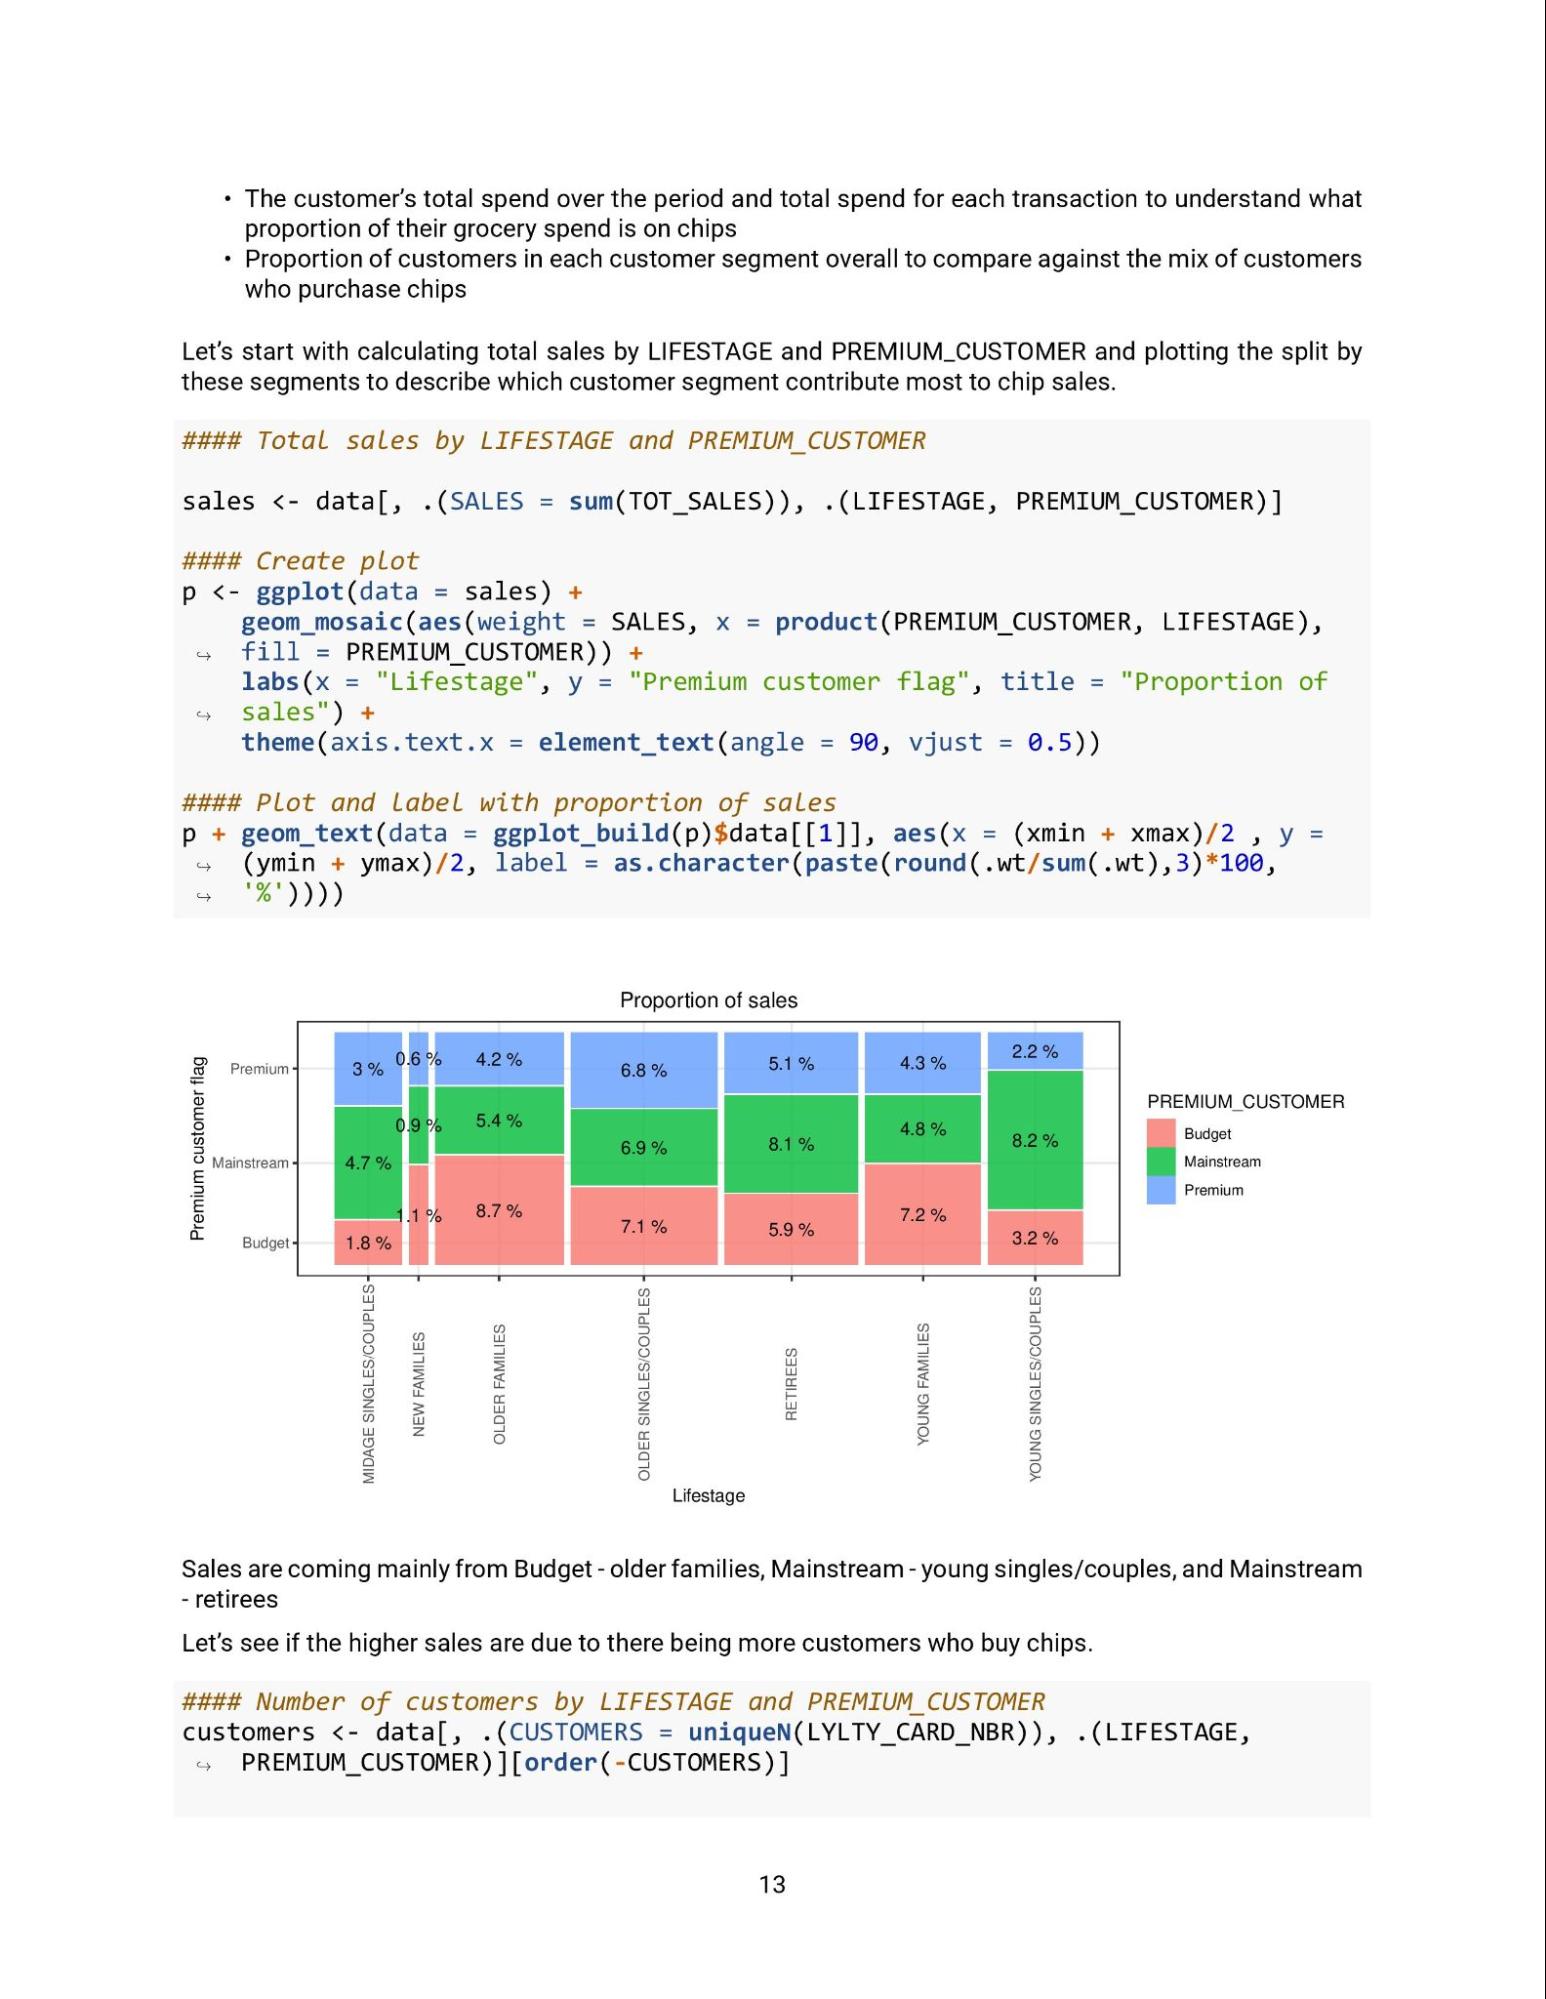
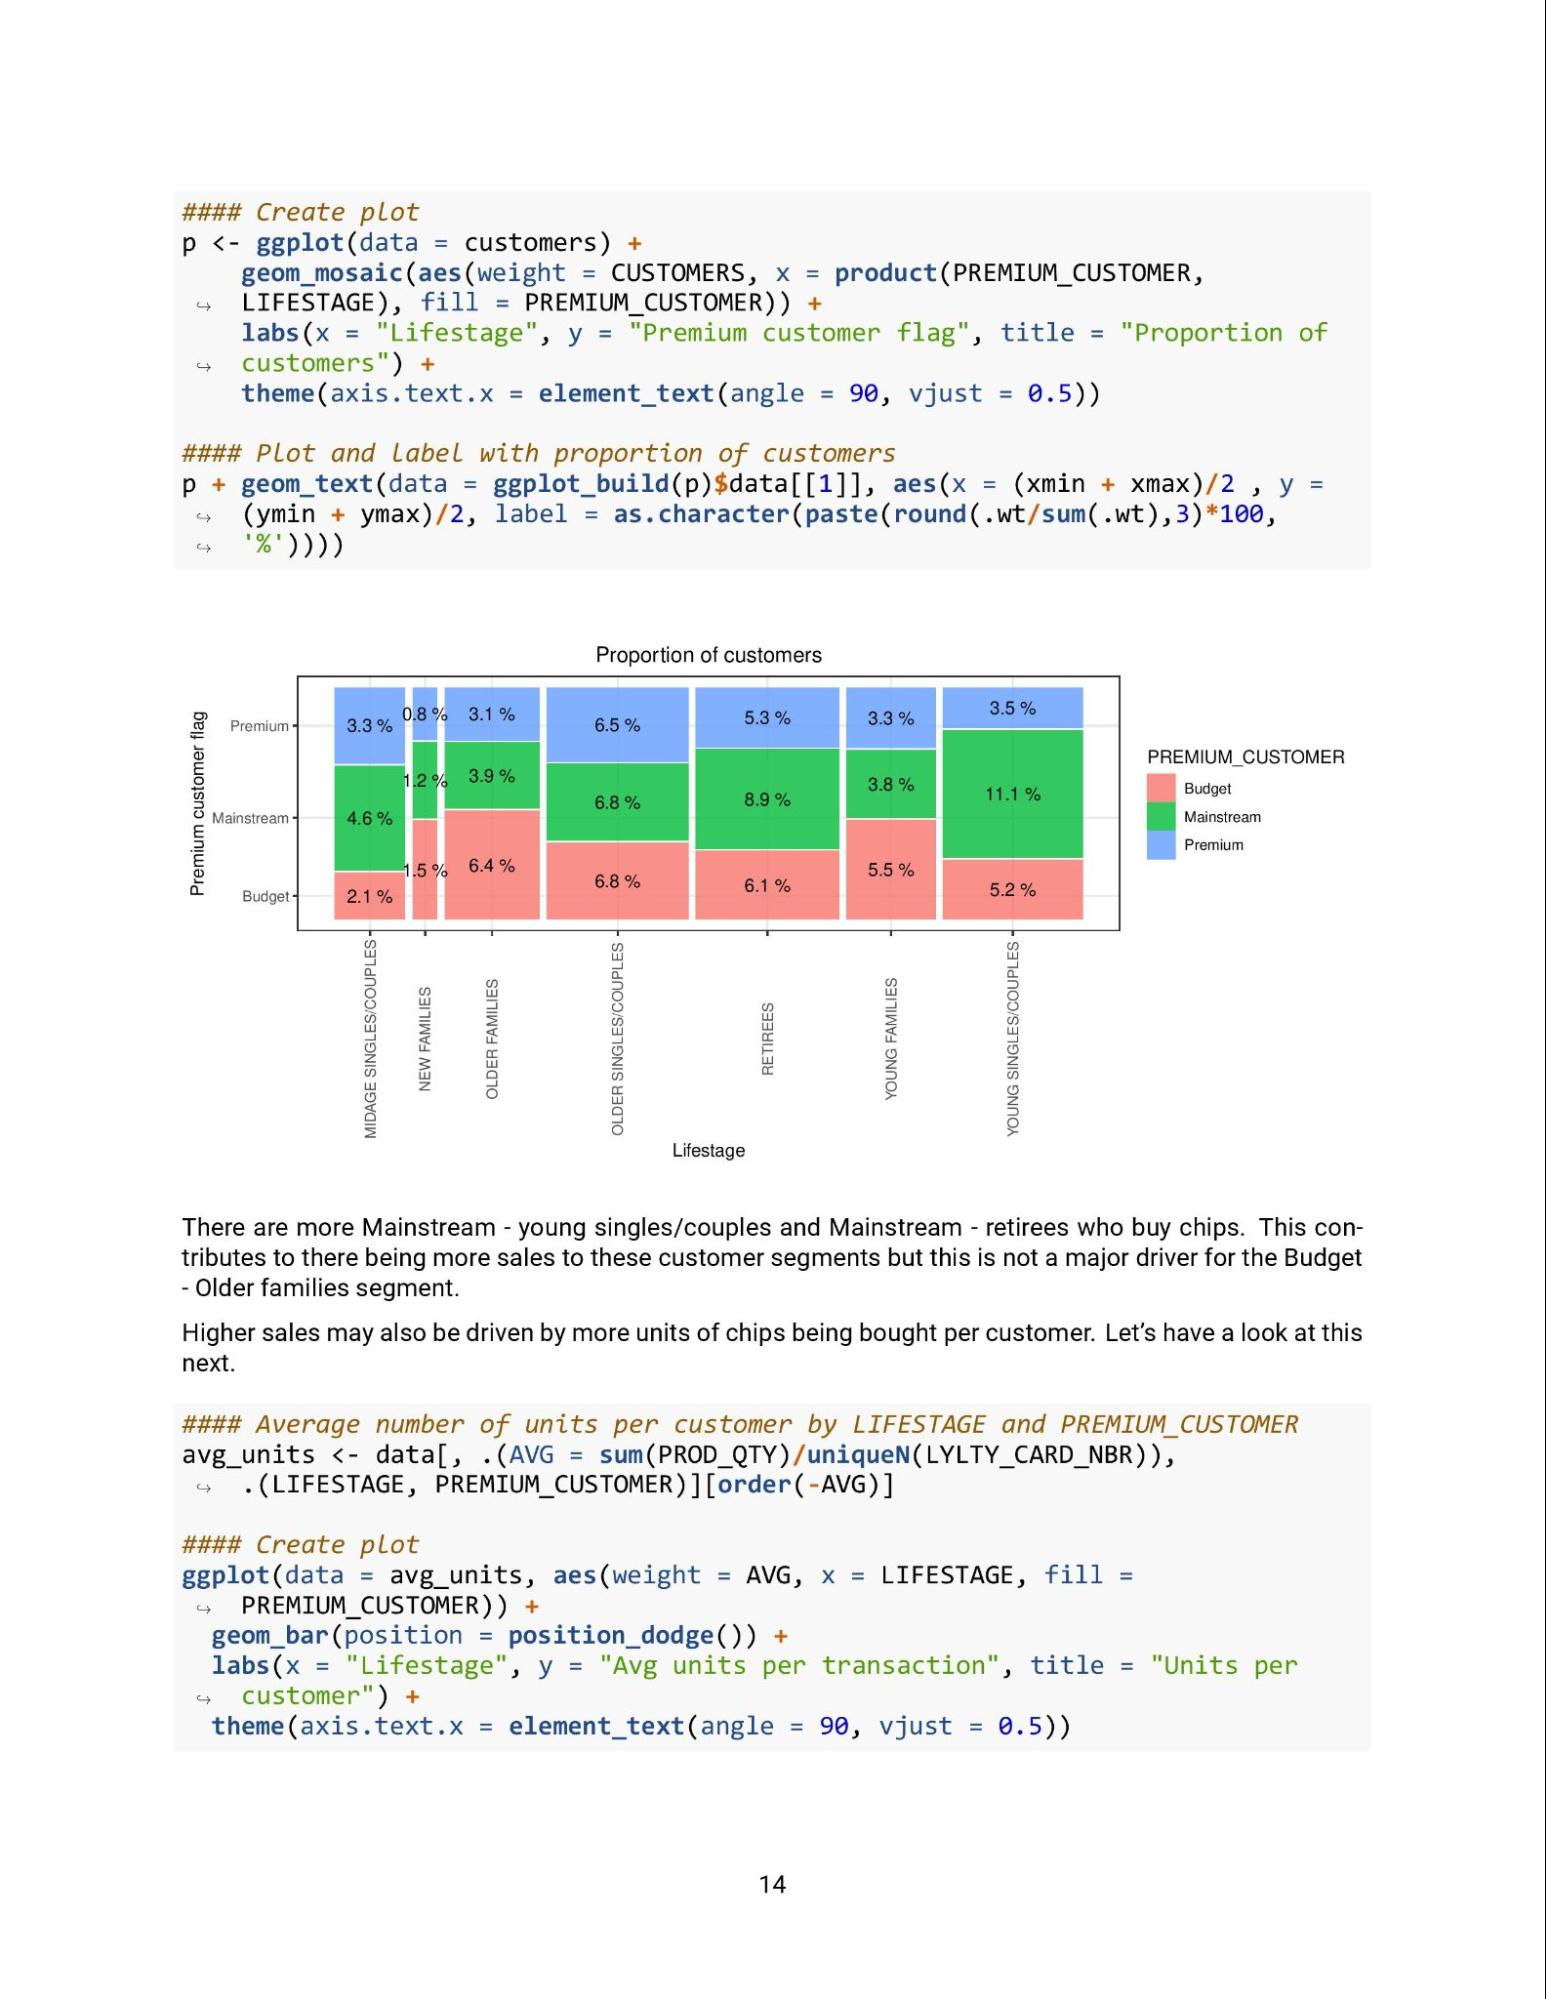
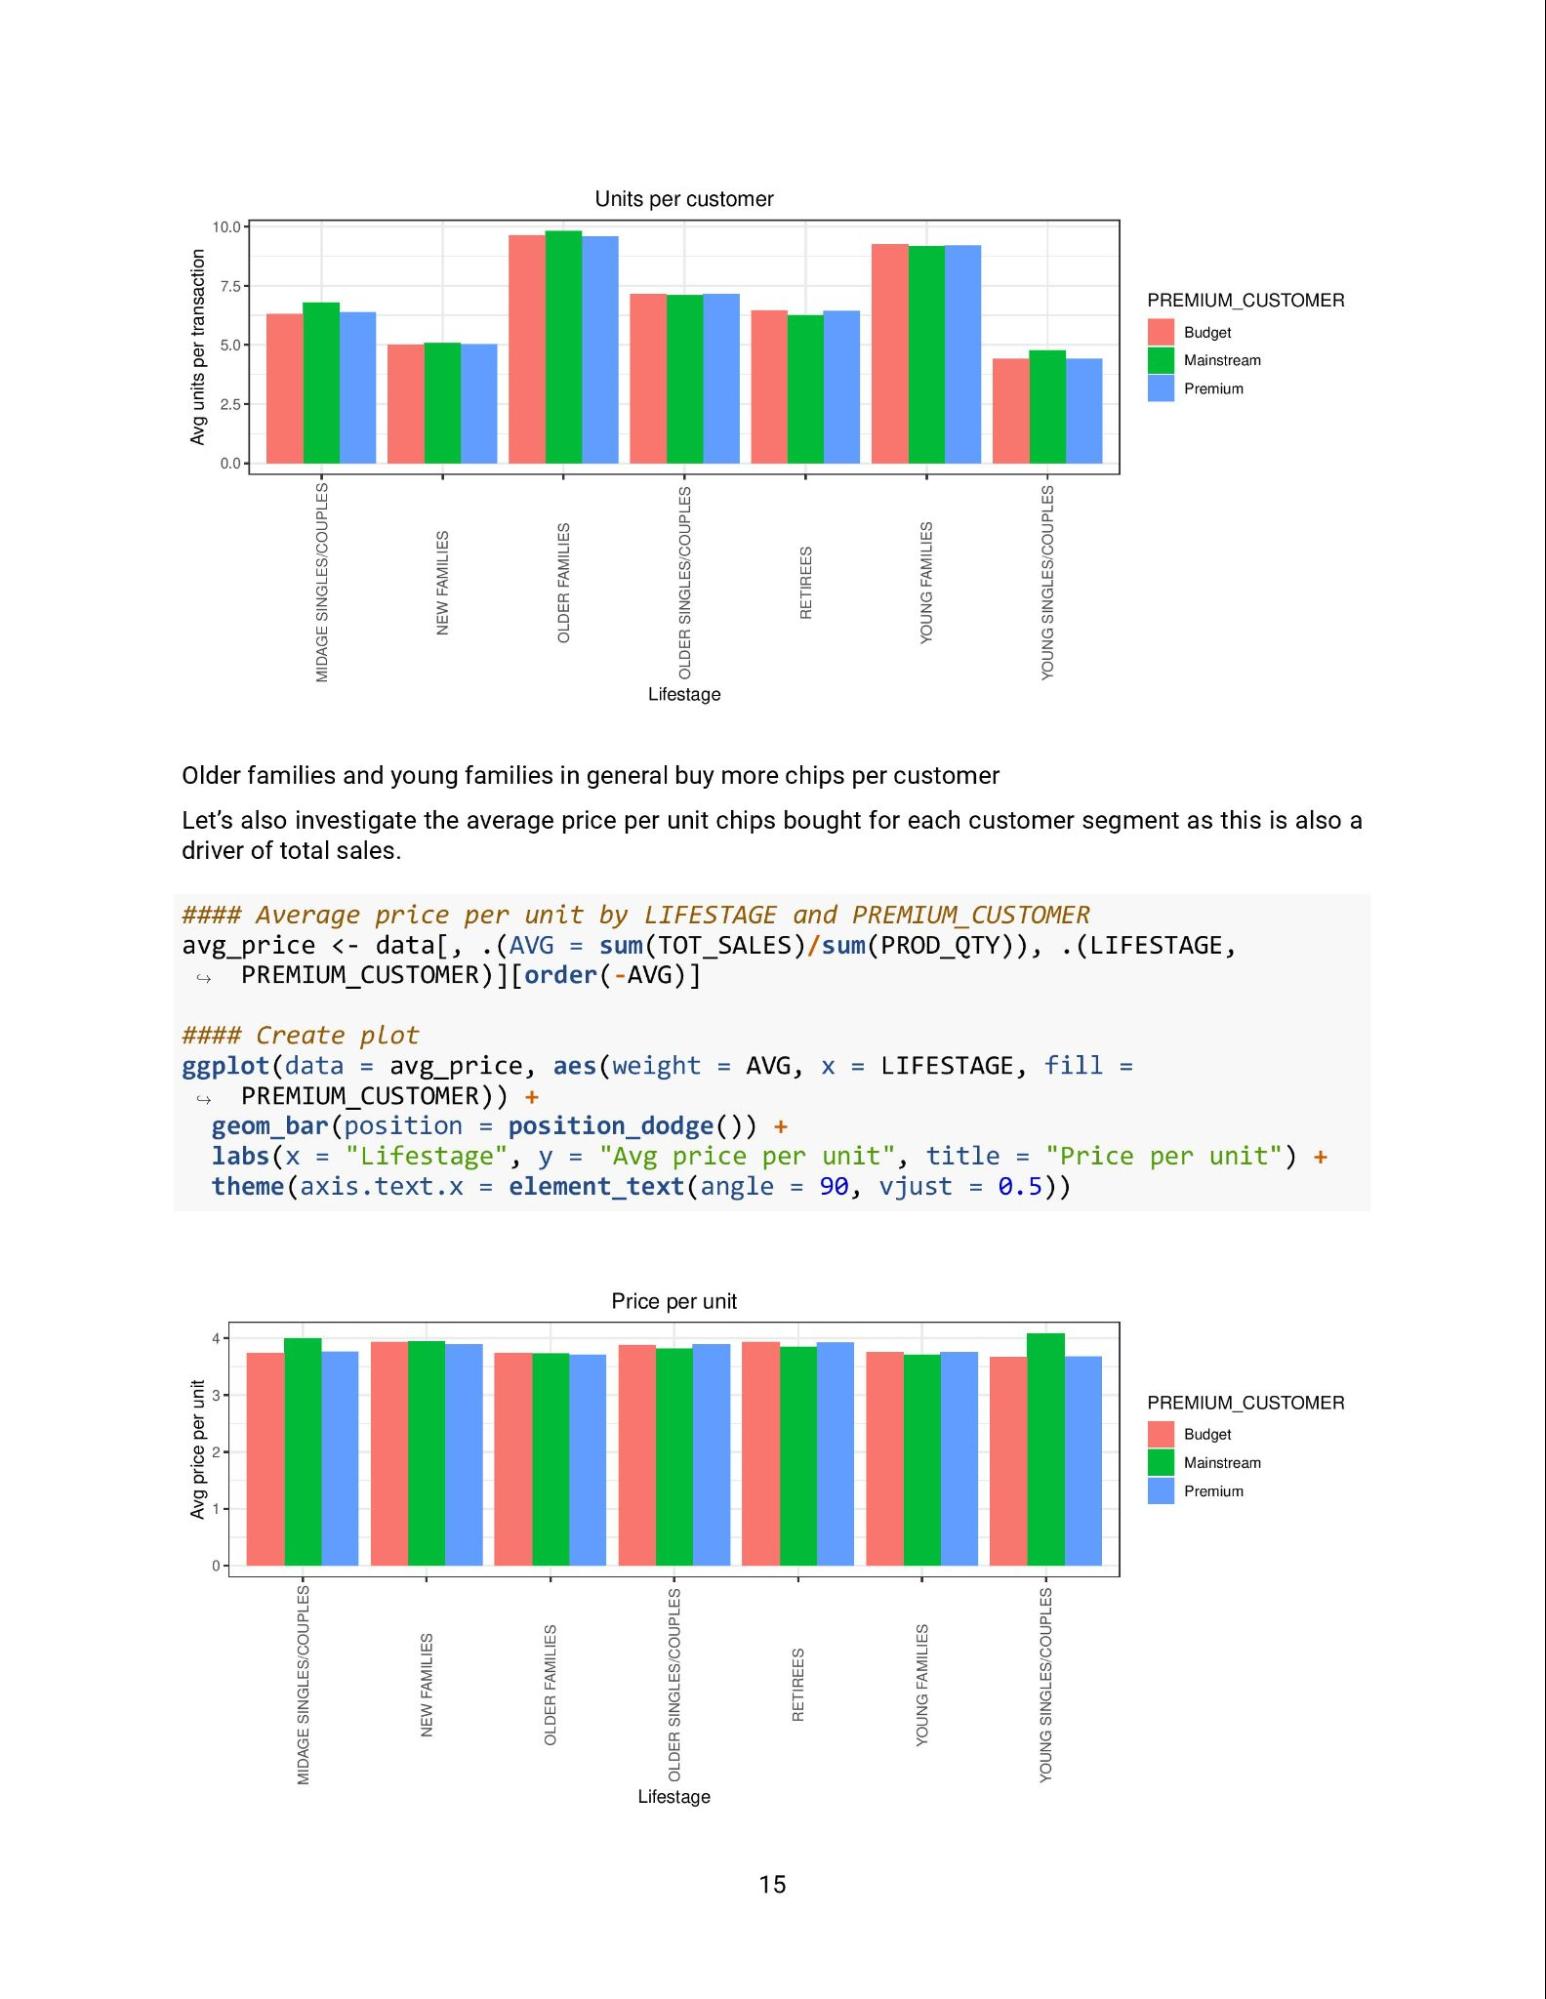
As we are in the early stages of this analysis Zilinka has asked us to submit our initial findings, so please save your code as a .pdf file and upload it to unlock the model answer. Note: that this is an open-ended case study that can be approached in many ways. Example answer is in R. Here are some resources to help youThis file should be transferred to an R Markup (.Rmd)
PREMIUM_CUSTOMER: Customer segmentation used to differentiate shoppers by the price point of products they buy and the types of products they buy. It is used to identify whether customers may spend more for quality or brand or whether they will purchase the cheapest options. Pro analytics Tip: While the data set would not normally be considered large some operations may still take some time to run. This is normal and to be expected when dealing with data sets at Quantium. Whilst your analysis is based on the whole data set you may want to try some strategies to try running sample solutions on a smaller subset of data I.e. create a sample solution using some of the data while it uploads. ChatGPT Help: Great! You’ve provided two files, presumably containing customer and transaction data. Here’s how we can approach this step-by-step: Plan for Initial Analysis
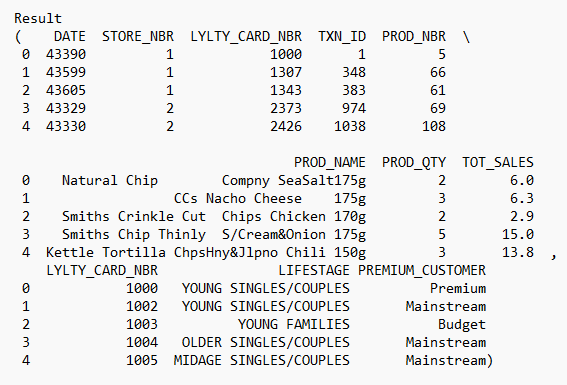
I’ll start by loading and inspecting these files to ensure their compatibility and check their contents. The transaction data contains a sheet named in, and the customer data contains a sheet named Worksheet. I'll load these sheets to explore their content and structure.
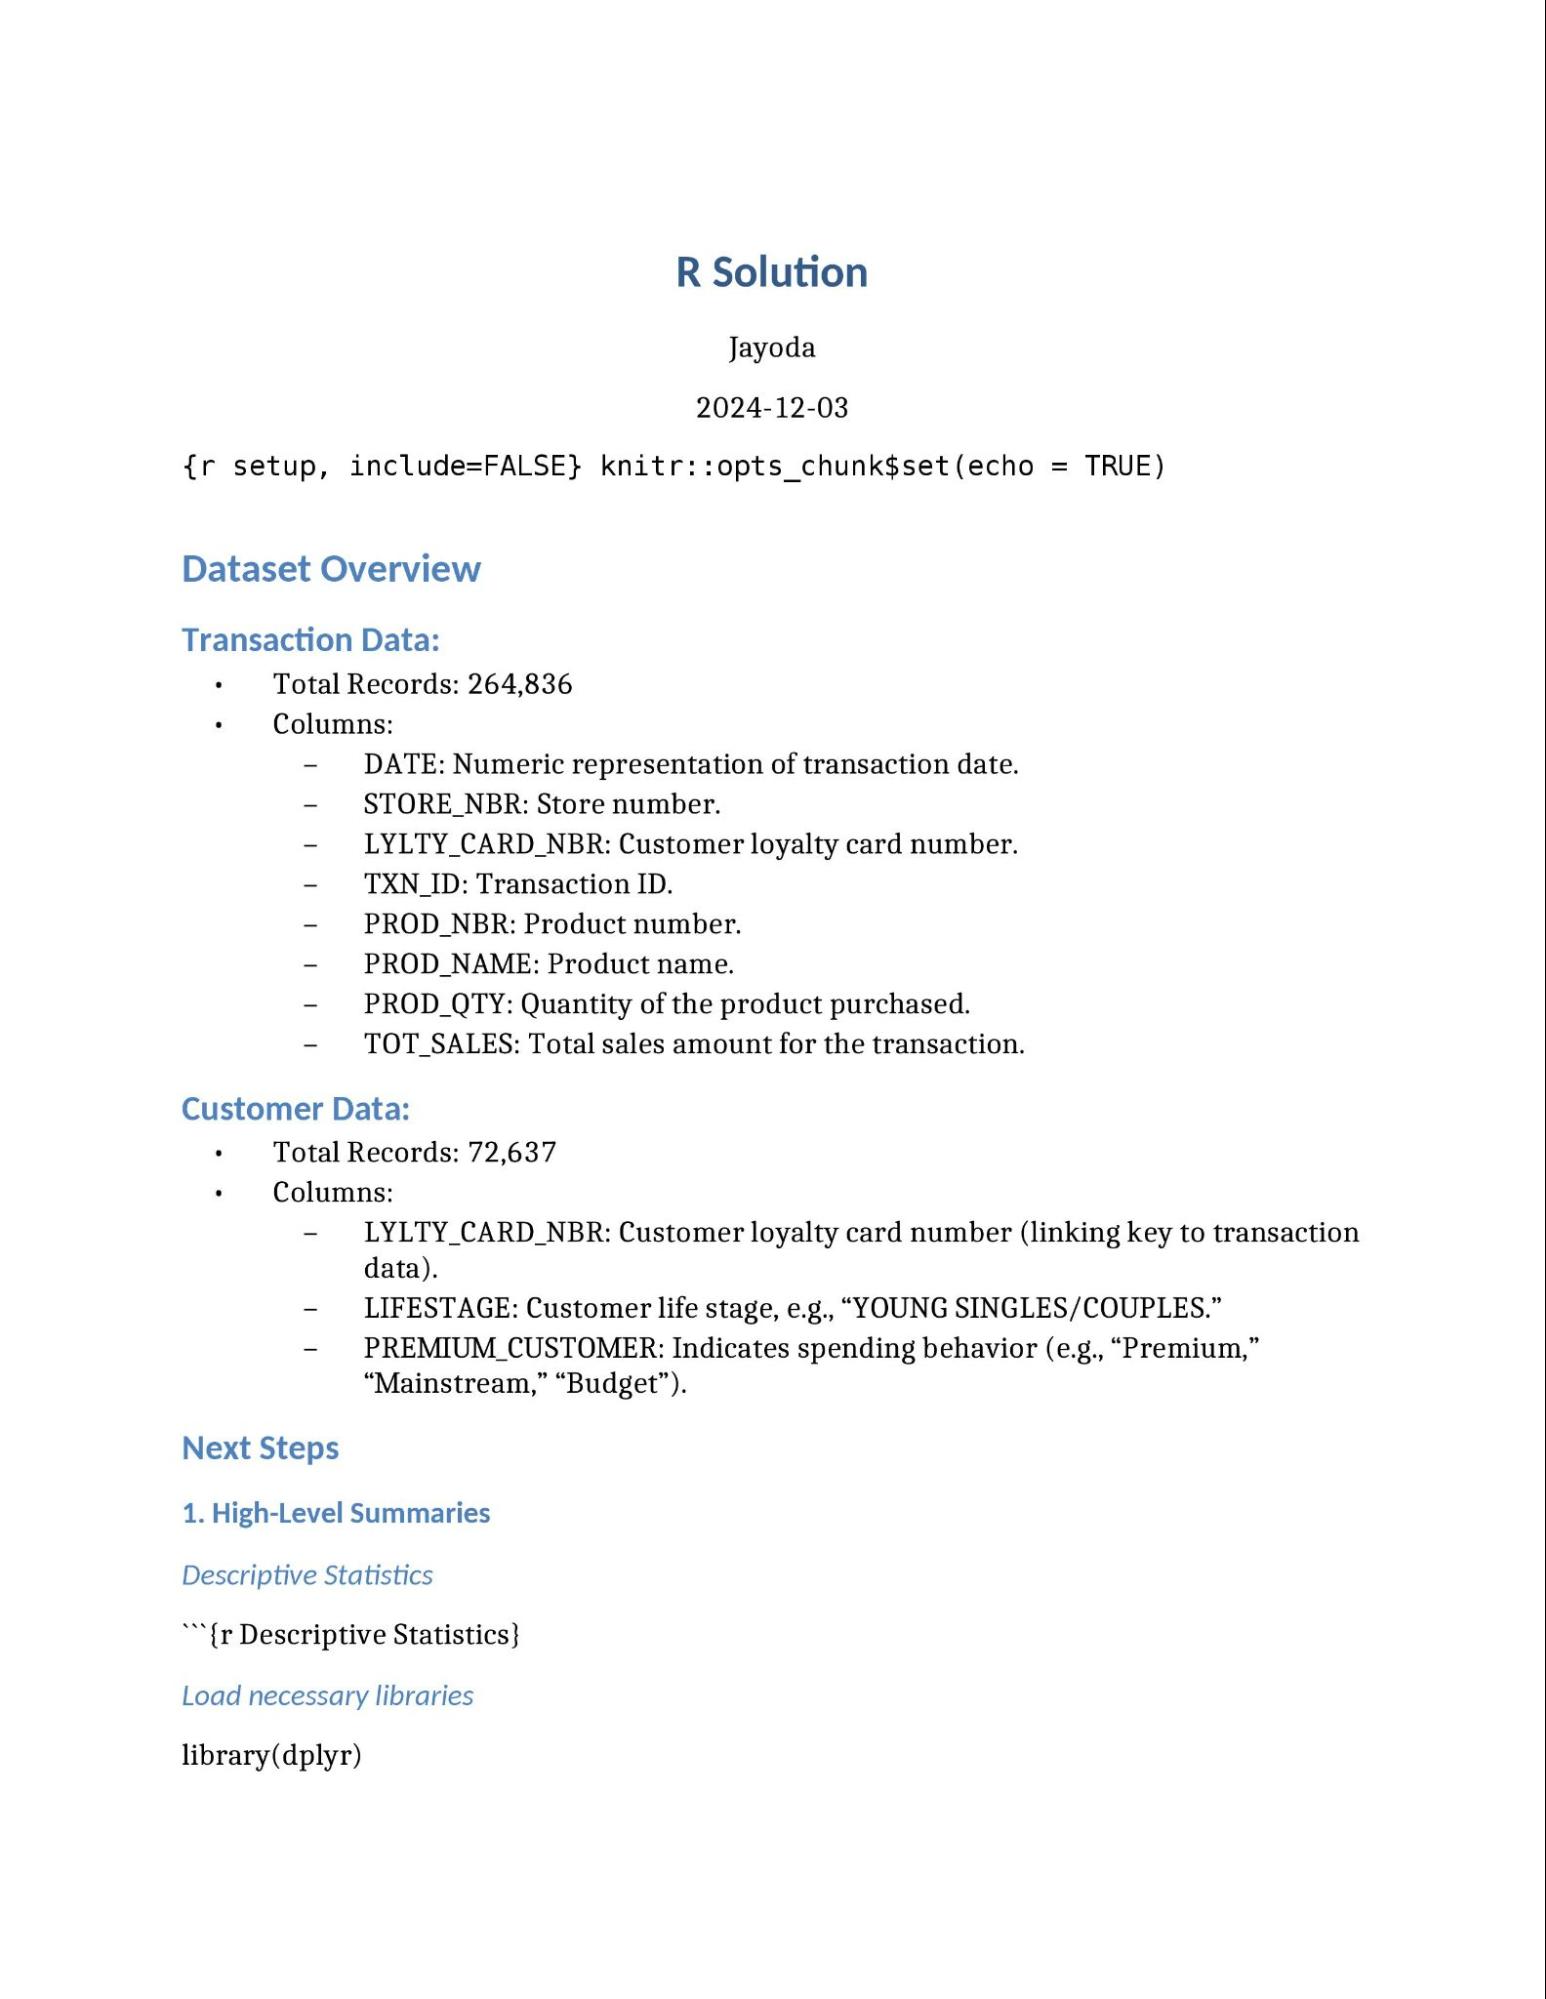
Dataset OverviewTransaction Data:
Customer Data:
Next Steps
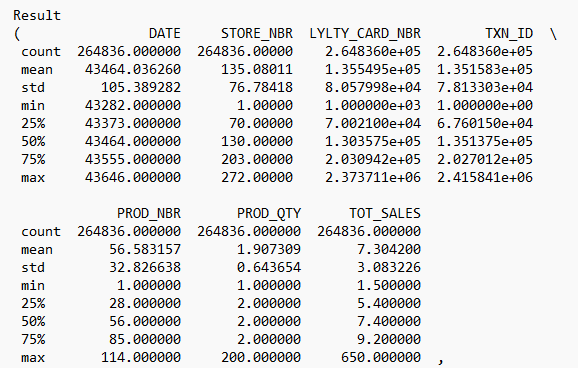
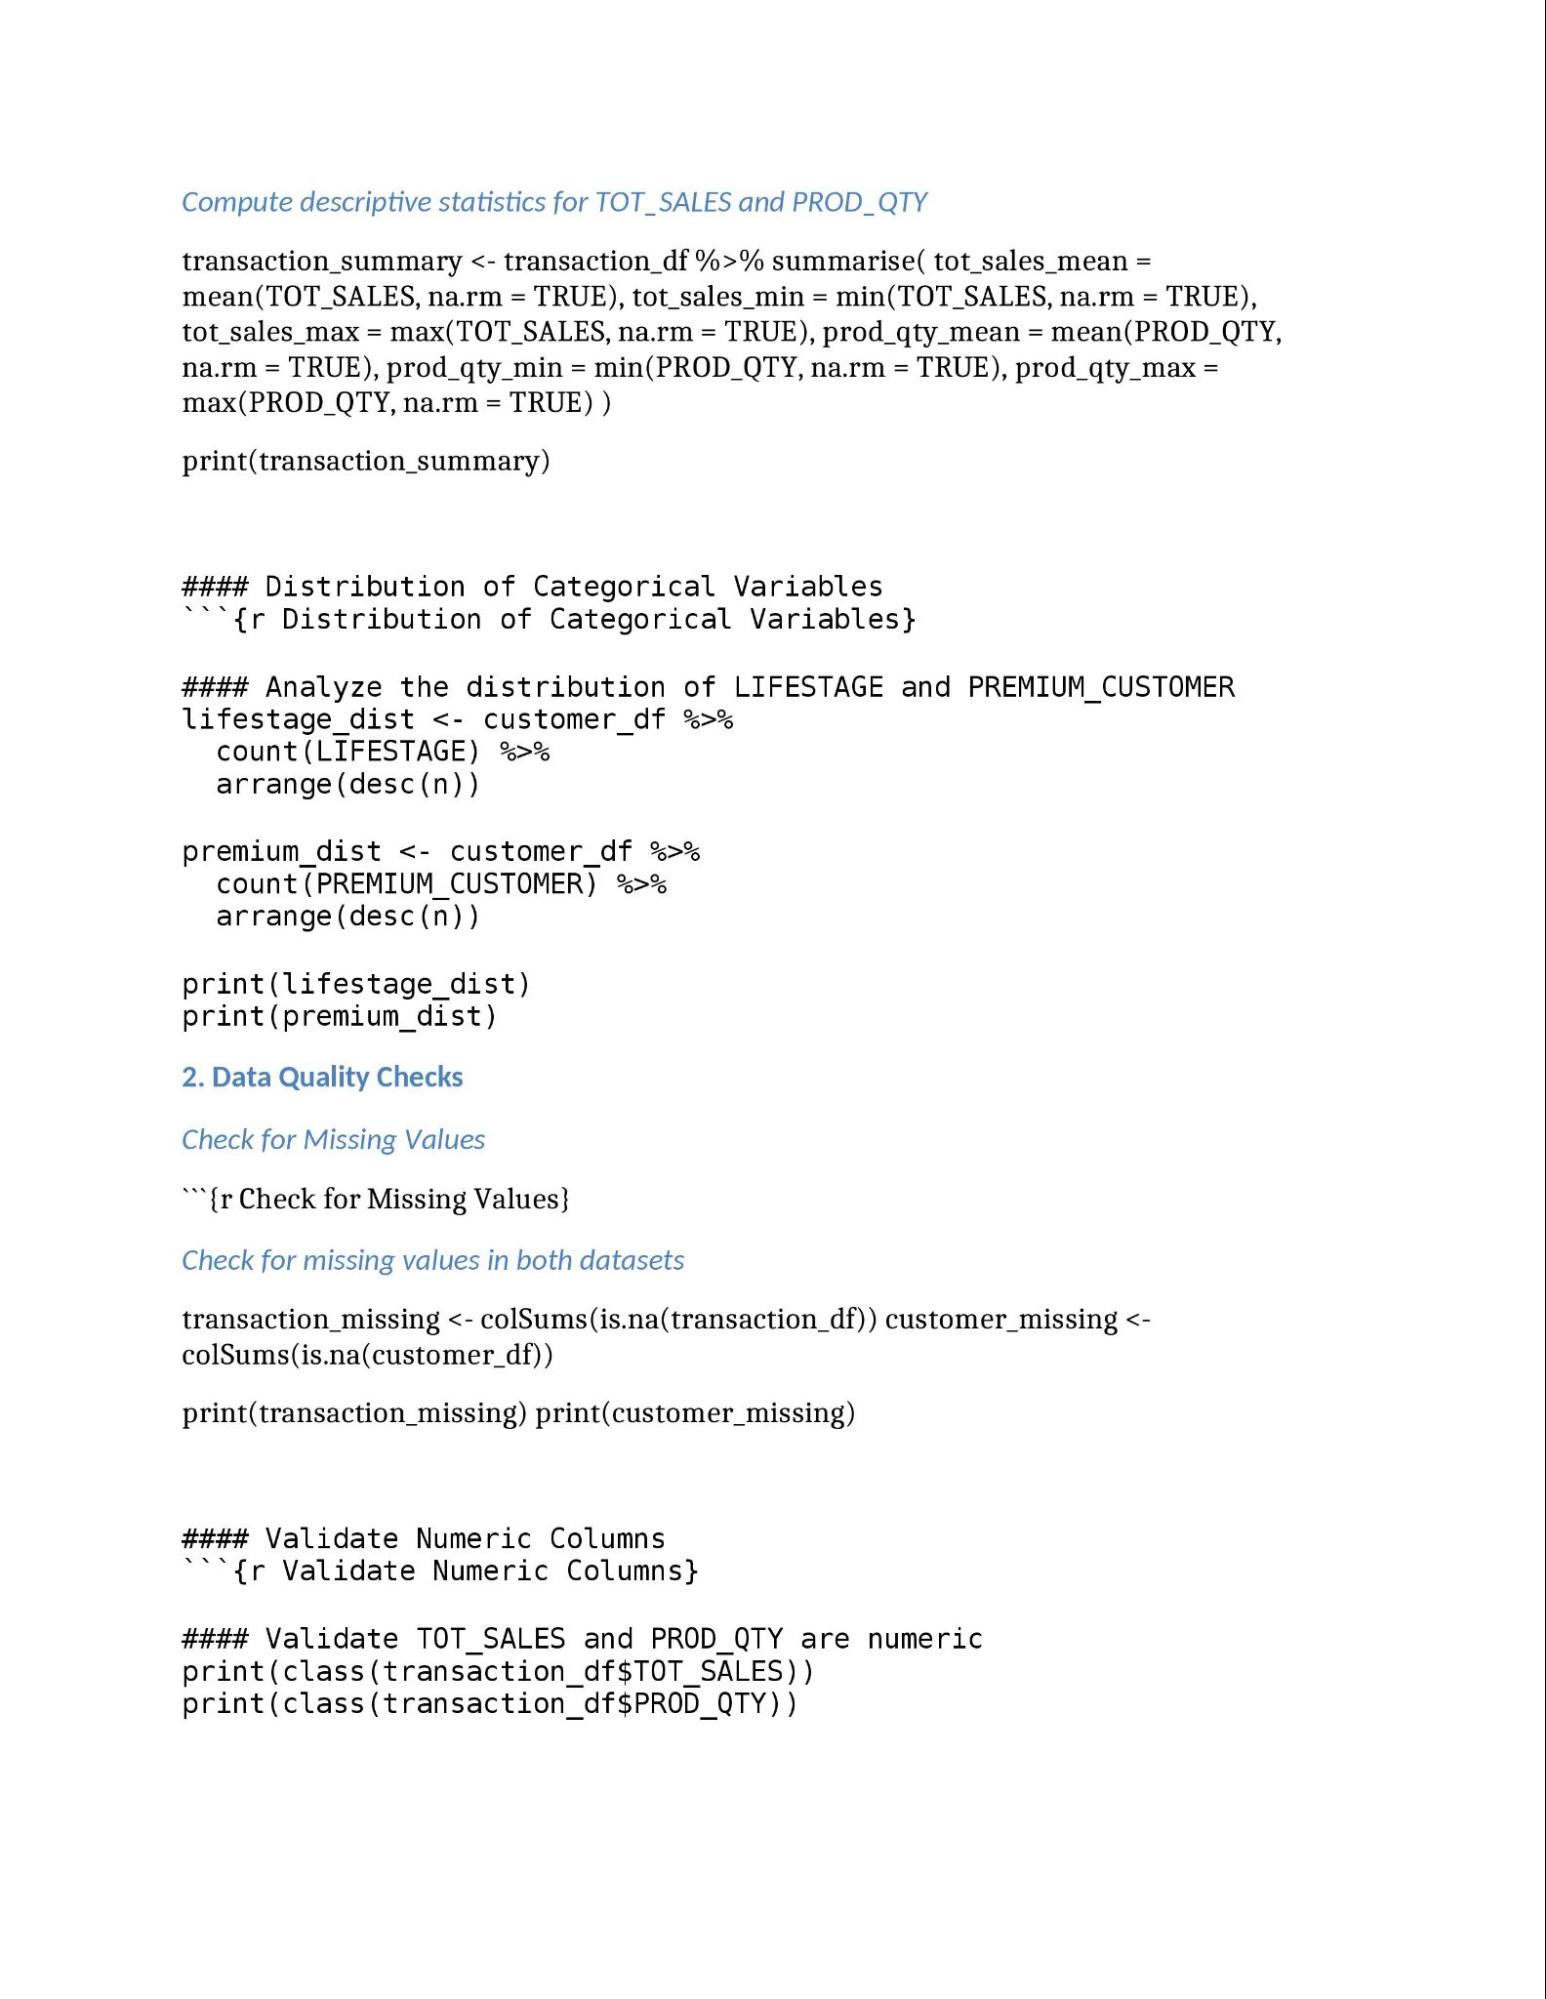
Let me compute summaries and check for missing data first.
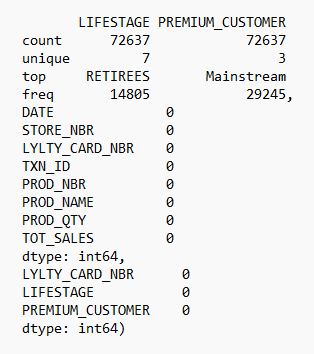
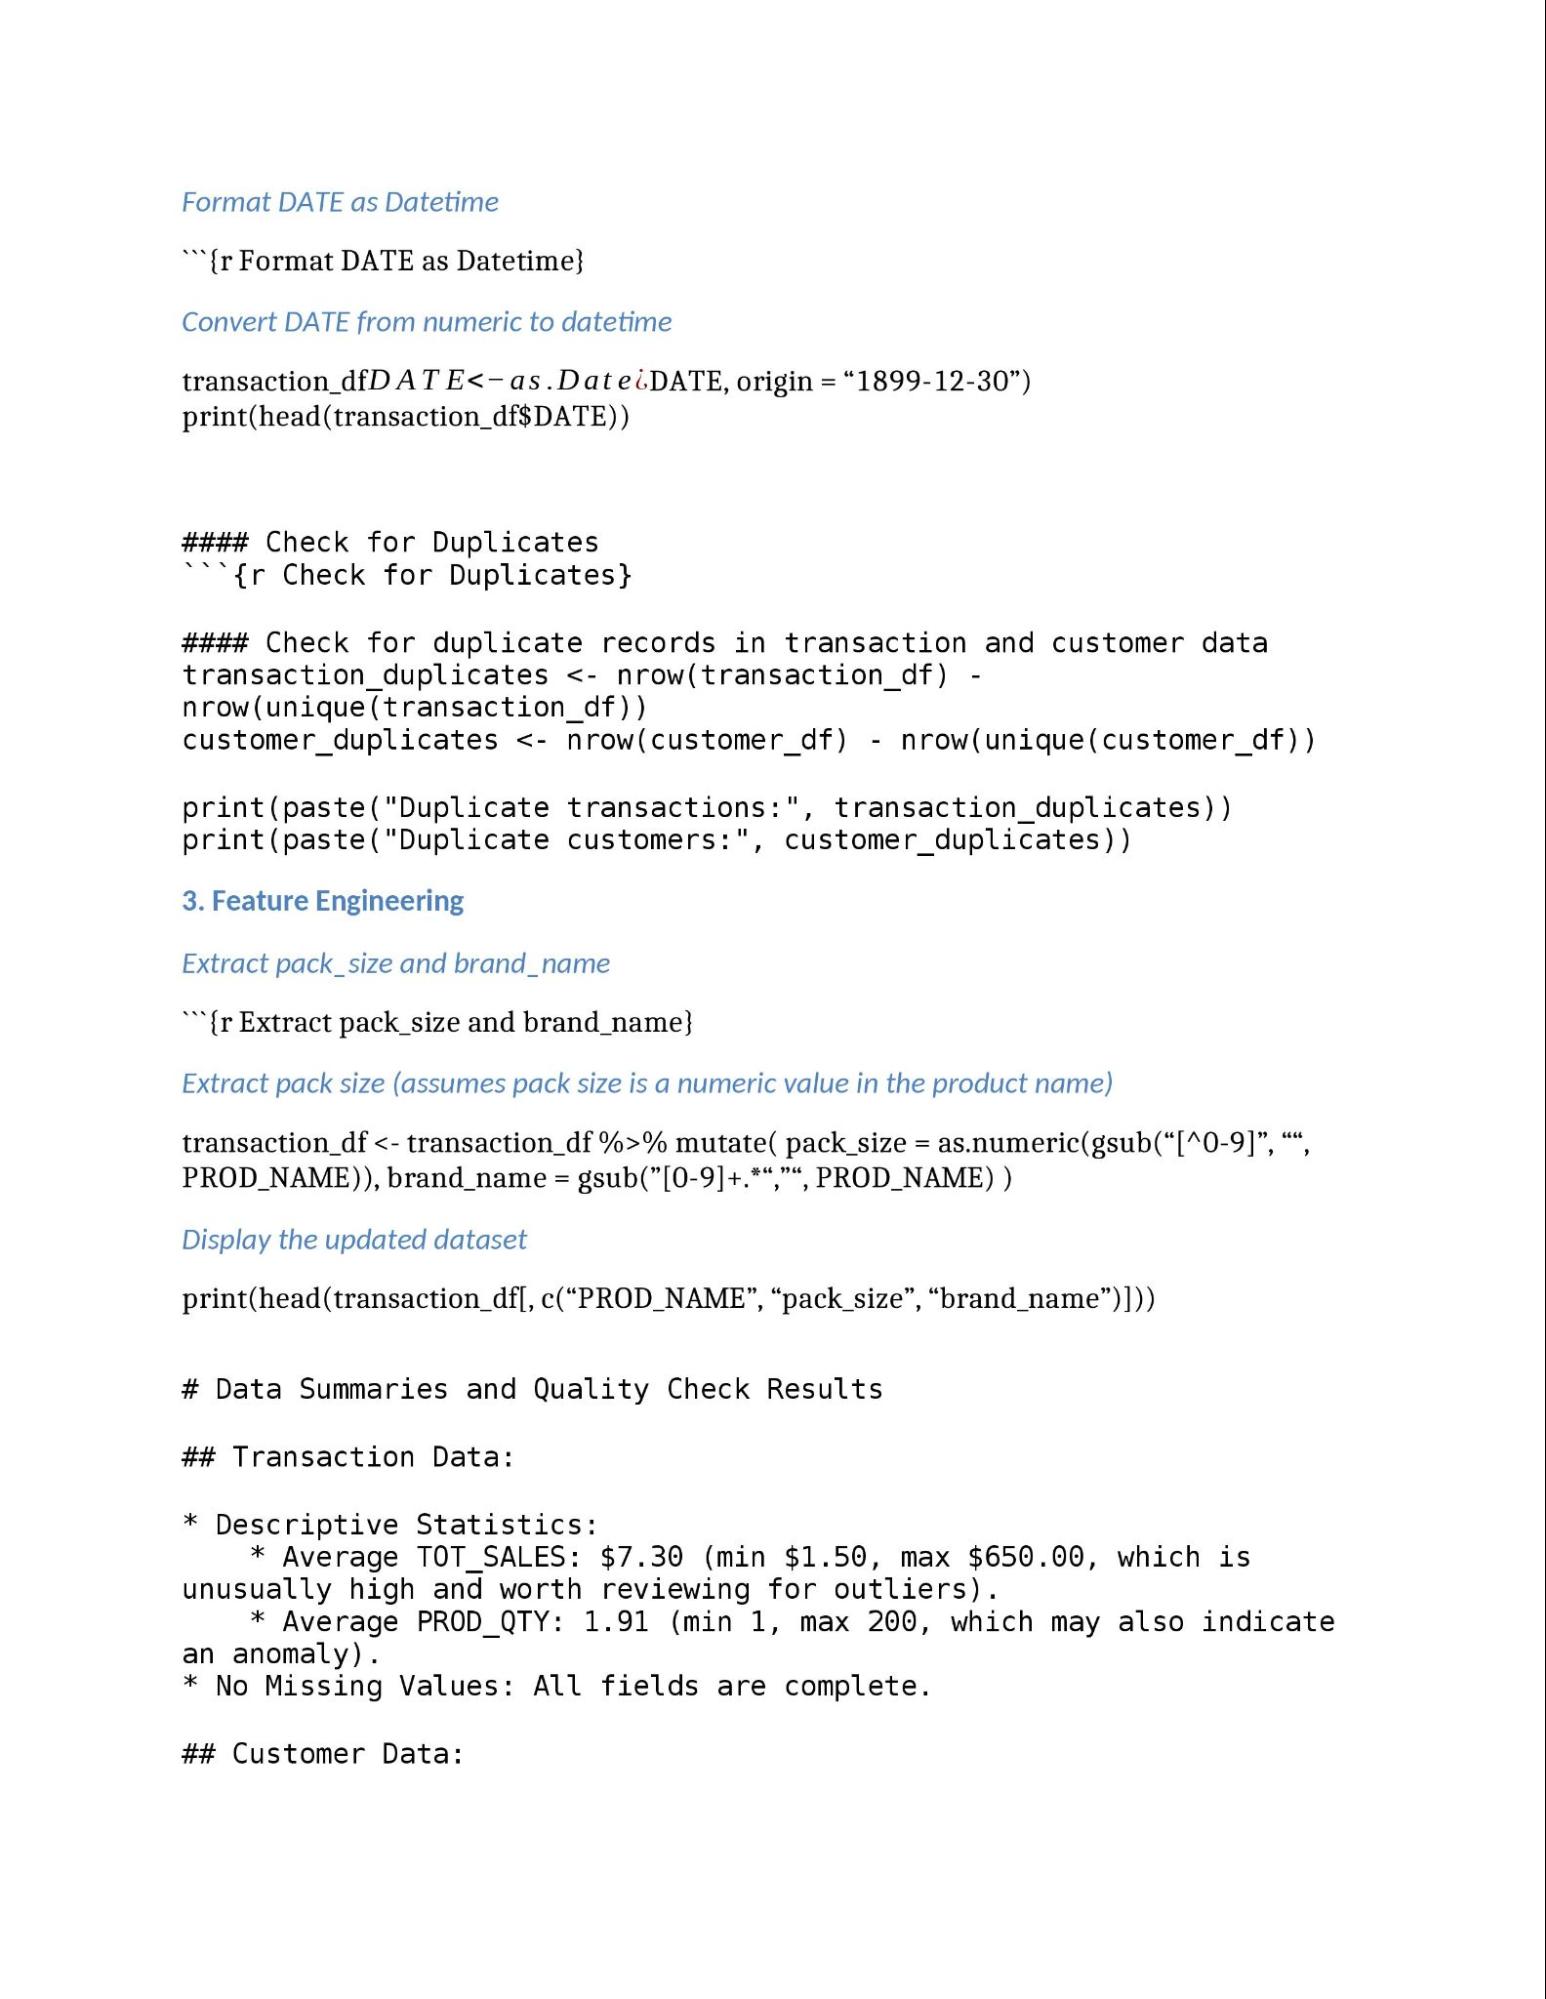
Data Summaries and Quality Check ResultsTransaction Data:
Customer Data:
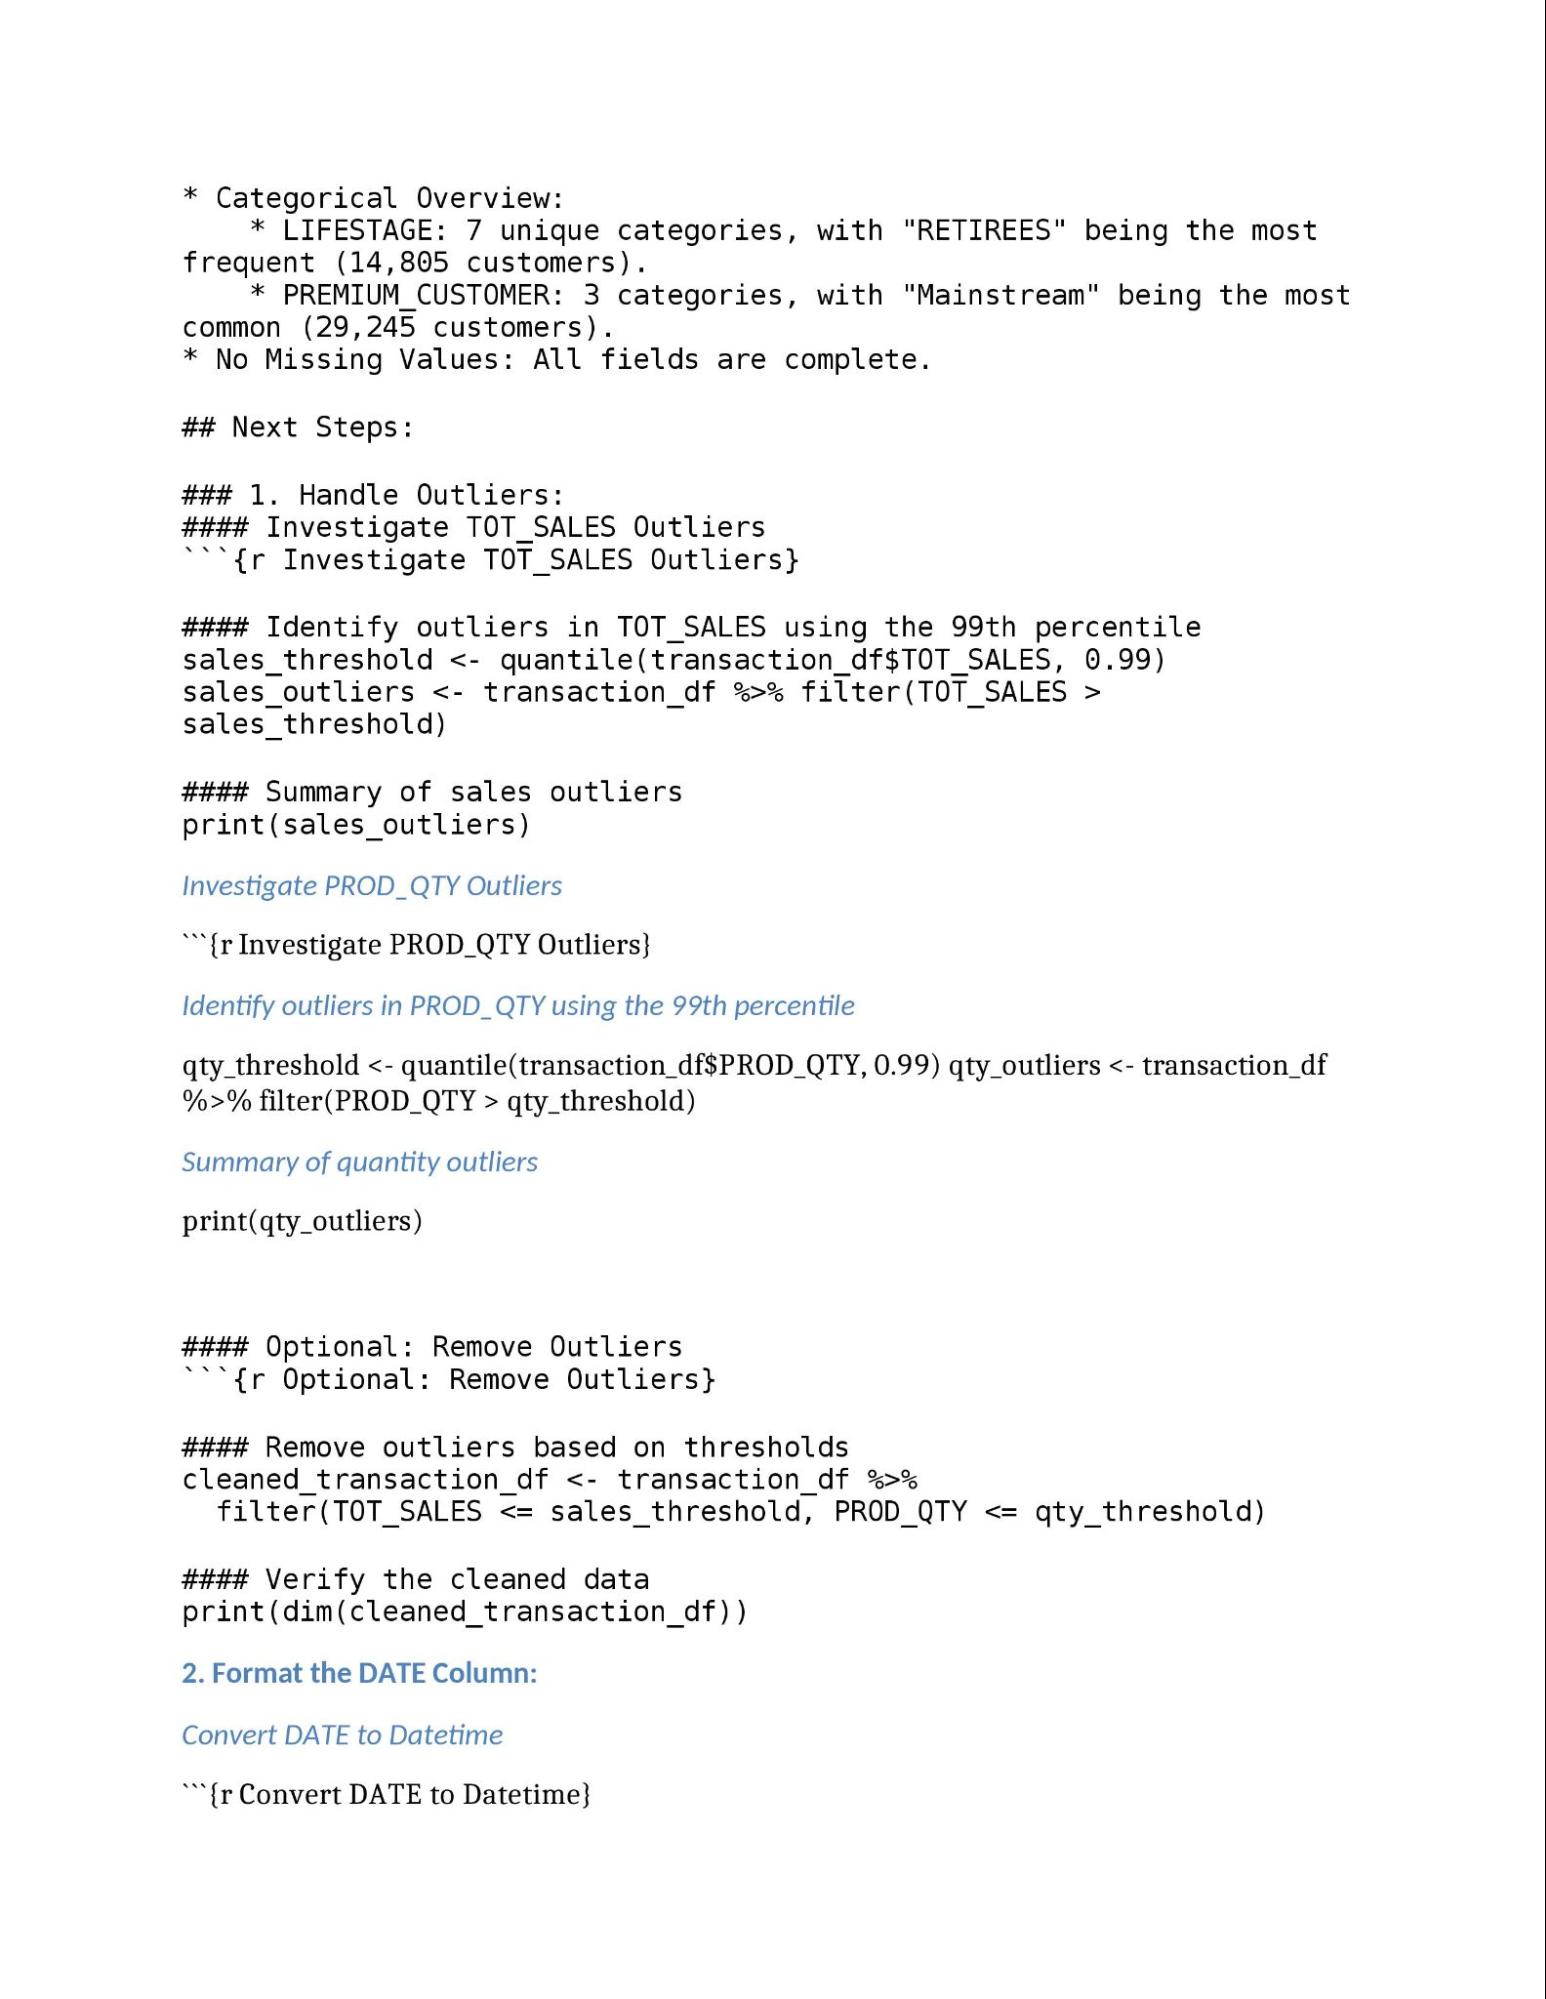
Next Steps:
I'll start with the outlier investigation and formatting the DATE column.
It seems like I can’t do more advanced data analysis right now. Please try again later. If you want, you can re-upload the files or share specific parts of the data for further examination. Let me know how you'd like to proceed!
| ||||||||||||||
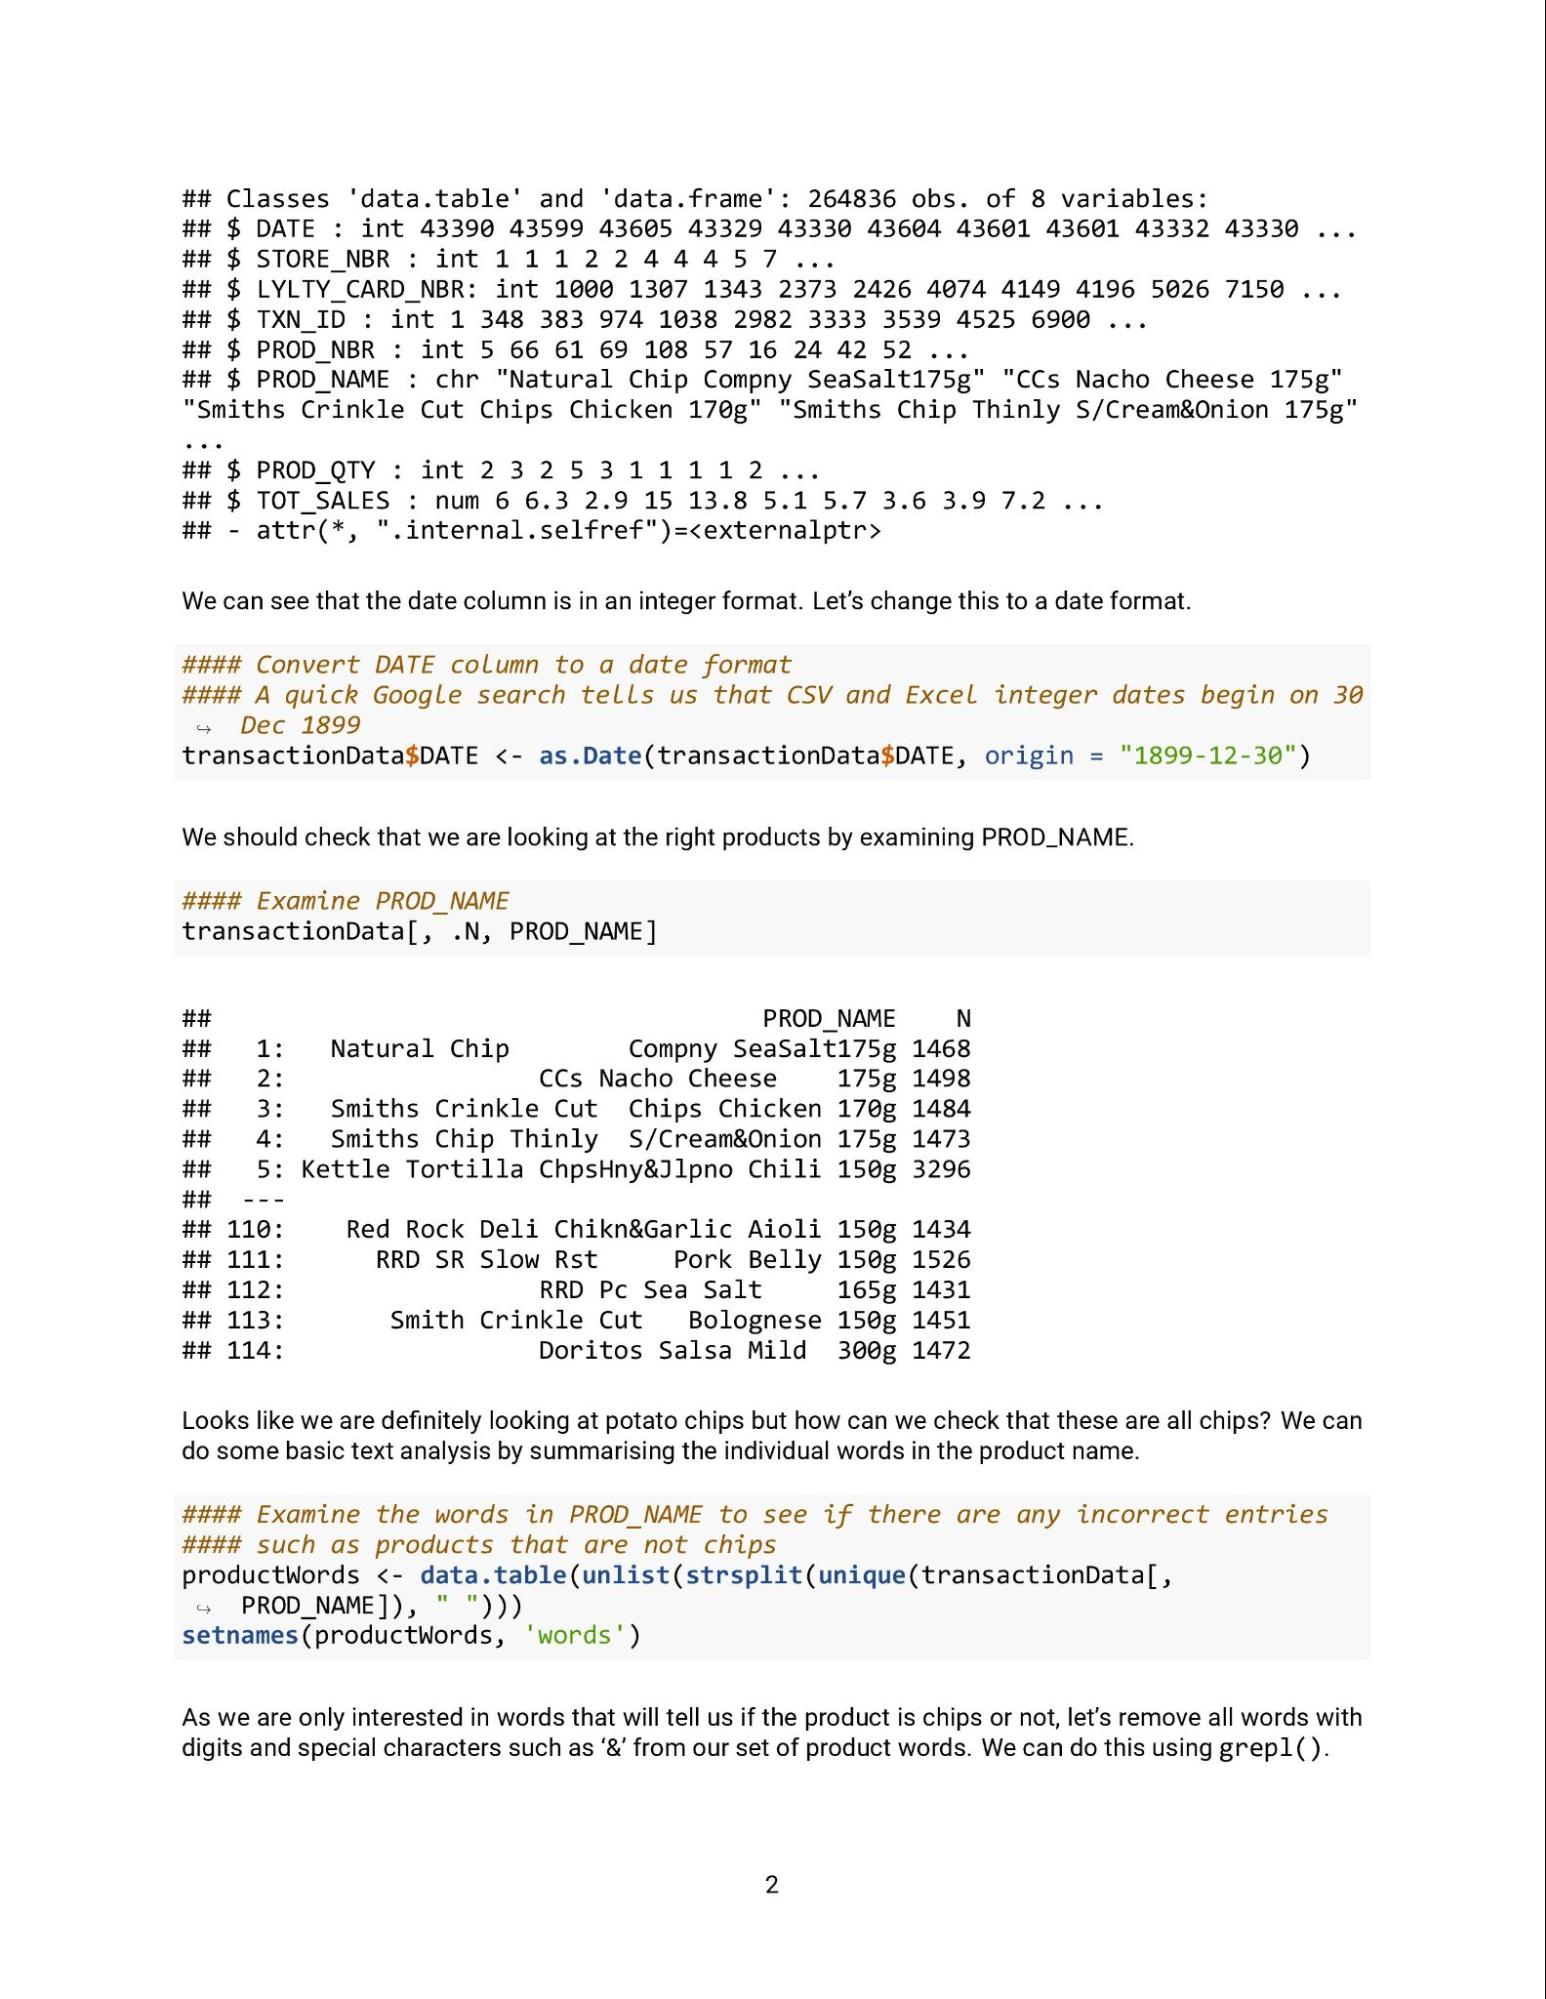
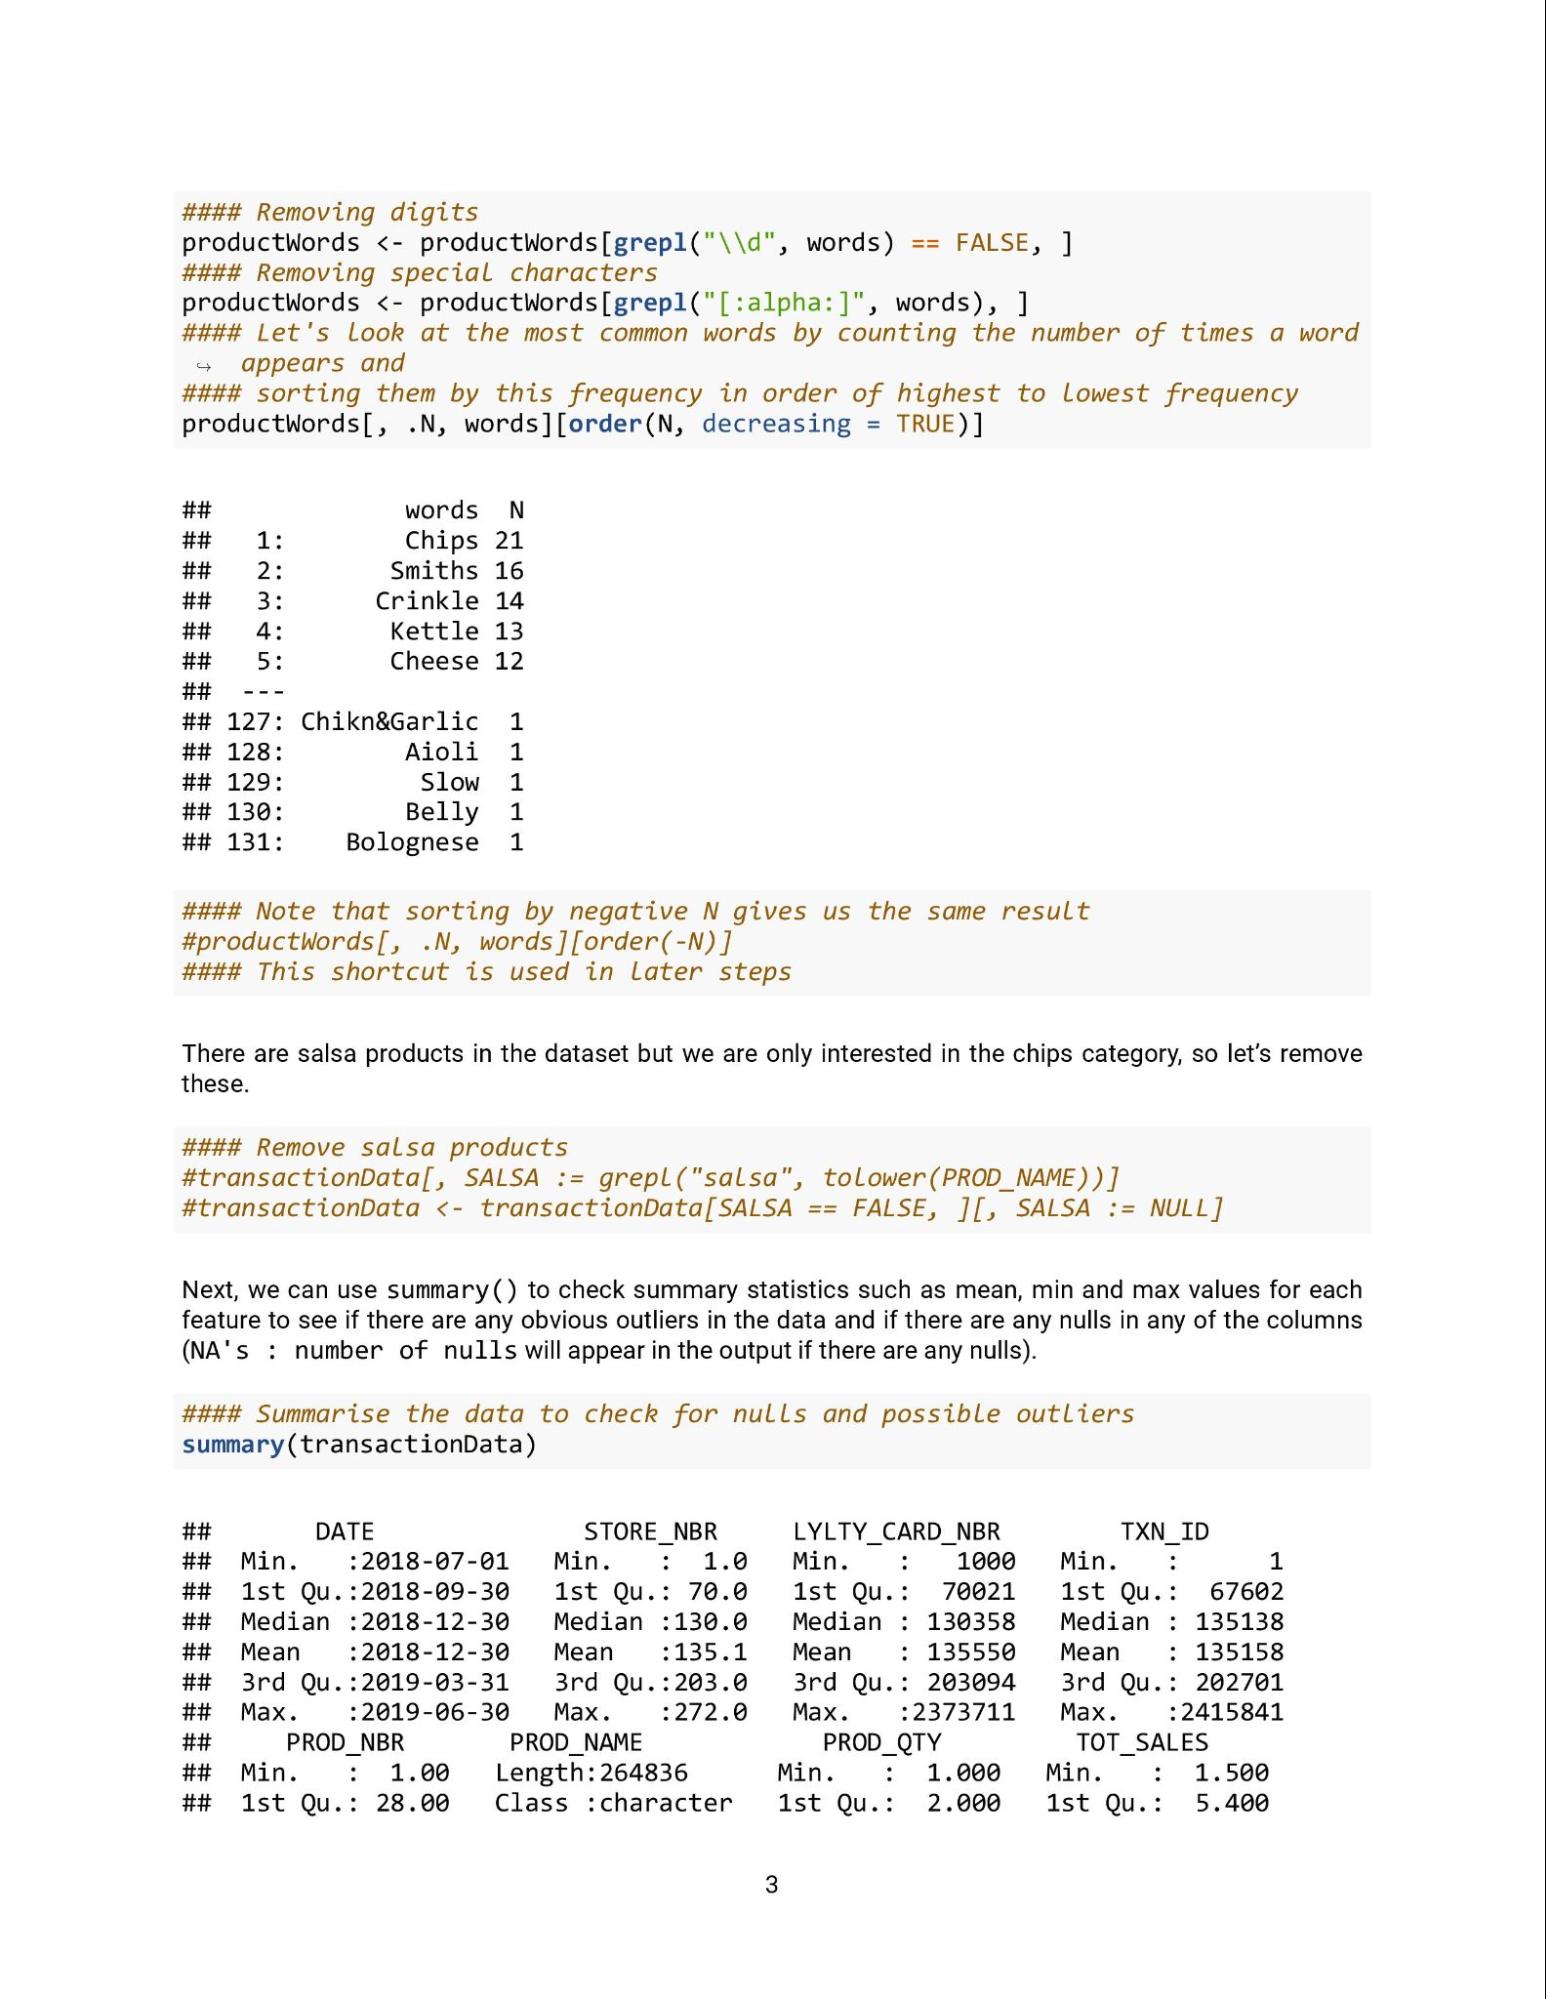
4 Example Answer | Example AnswerGreat work! Take a look at the example answer below to see how a professional would have attempted this task. Think about what you did well and how you can improve. | ||||||||||||||
5 Completion | |||||||||||||||
Task Two: Experimentation and uplift testing | |||||||||||||||
1 Task Overview | Task OverviewWhat you'll learn
What you'll do
| ||||||||||||||
2 Here is the background information on your task | Here is the background information on your taskWe suggest you complete Task 1 before proceeding with this task. You are part of Quantium’s retail analytics team and have been approached by your client. The Category Manager for Chips, has asked us to test the impact of the new trial layouts with a data driven recommendation to whether or not the trial layout should be rolled out to all their stores. You have received the following email from Zilinka.
ChatGPT Help: Here’s how to approach this task systematically in R: 1. Select Control StoresDefine Metrics for Control Store SelectionControl stores should resemble the trial stores in terms of:
Steps
CodeR Copy code # Aggregate weekly metrics for trial and other stores weekly_metrics <- transaction_df %>% group_by(STORE_TYPE, STORE, week = format(DATE, "%Y-%U")) %>% summarise( avg_sales = mean(TOT_SALES, na.rm = TRUE), avg_customers = n_distinct(CUSTOMER_ID) ) # Filter trial store data trial_store <- weekly_metrics %>% filter(STORE_TYPE == "Trial") # Compare metrics to find control stores control_store_candidates <- weekly_metrics %>% filter(STORE_TYPE != "Trial") %>% group_by(STORE) %>% summarise( sales_corr = cor(trial_store$avg_sales, avg_sales), customer_corr = cor(trial_store$avg_customers, avg_customers) ) # Select control stores with highest correlations control_stores <- control_store_candidates %>% arrange(desc(sales_corr), desc(customer_corr)) %>% slice(1:5) # Top 5 matches 2. Assess the TrialCompare Trial and Control Stores
CodeR Copy code # Define trial period trial_period <- c(as.Date("2023-01-01"), as.Date("2023-06-30")) # Filter data for trial and control stores during the trial period trial_data <- transaction_df %>% filter(STORE %in% trial_store$STORE, DATE >= trial_period[1], DATE <= trial_period[2]) control_data <- transaction_df %>% filter(STORE %in% control_stores$STORE, DATE >= trial_period[1], DATE <= trial_period[2]) # Calculate percentage changes trial_summary <- trial_data %>% group_by(STORE) %>% summarise( trial_avg_sales = mean(TOT_SALES), trial_customer_count = n_distinct(CUSTOMER_ID) ) control_summary <- control_data %>% group_by(STORE) %>% summarise( control_avg_sales = mean(TOT_SALES), control_customer_count = n_distinct(CUSTOMER_ID) ) comparison <- trial_summary %>% left_join(control_summary, by = "STORE") %>% mutate( sales_change = (trial_avg_sales - control_avg_sales) / control_avg_sales * 100, customer_change = (trial_customer_count - control_customer_count) / control_customer_count * 100 ) VisualizeR Copy code # Plot sales comparison library(ggplot2) ggplot(comparison, aes(x = STORE, y = sales_change)) + geom_bar(stat = "identity", fill = "steelblue") + labs(title = "Sales Change During Trial Period", x = "Store", y = "Percentage Change") # Plot customer comparison ggplot(comparison, aes(x = STORE, y = customer_change)) + geom_bar(stat = "identity", fill = "steelblue") + labs(title = "Customer Count Change During Trial Period", x = "Store", y = "Percentage Change") 3. Collate FindingsSummarize Insights
CodeR Copy code # Summarize results into a table summary_table <- comparison %>% mutate( recommendation = ifelse(sales_change > 5 & customer_change > 5, "Rollout", "No Rollout") ) print(summary_table) Deliverables
Let me know if you'd like further help, such as conducting statistical tests (e.g., t-tests) or refining visualizations! | ||||||||||||||
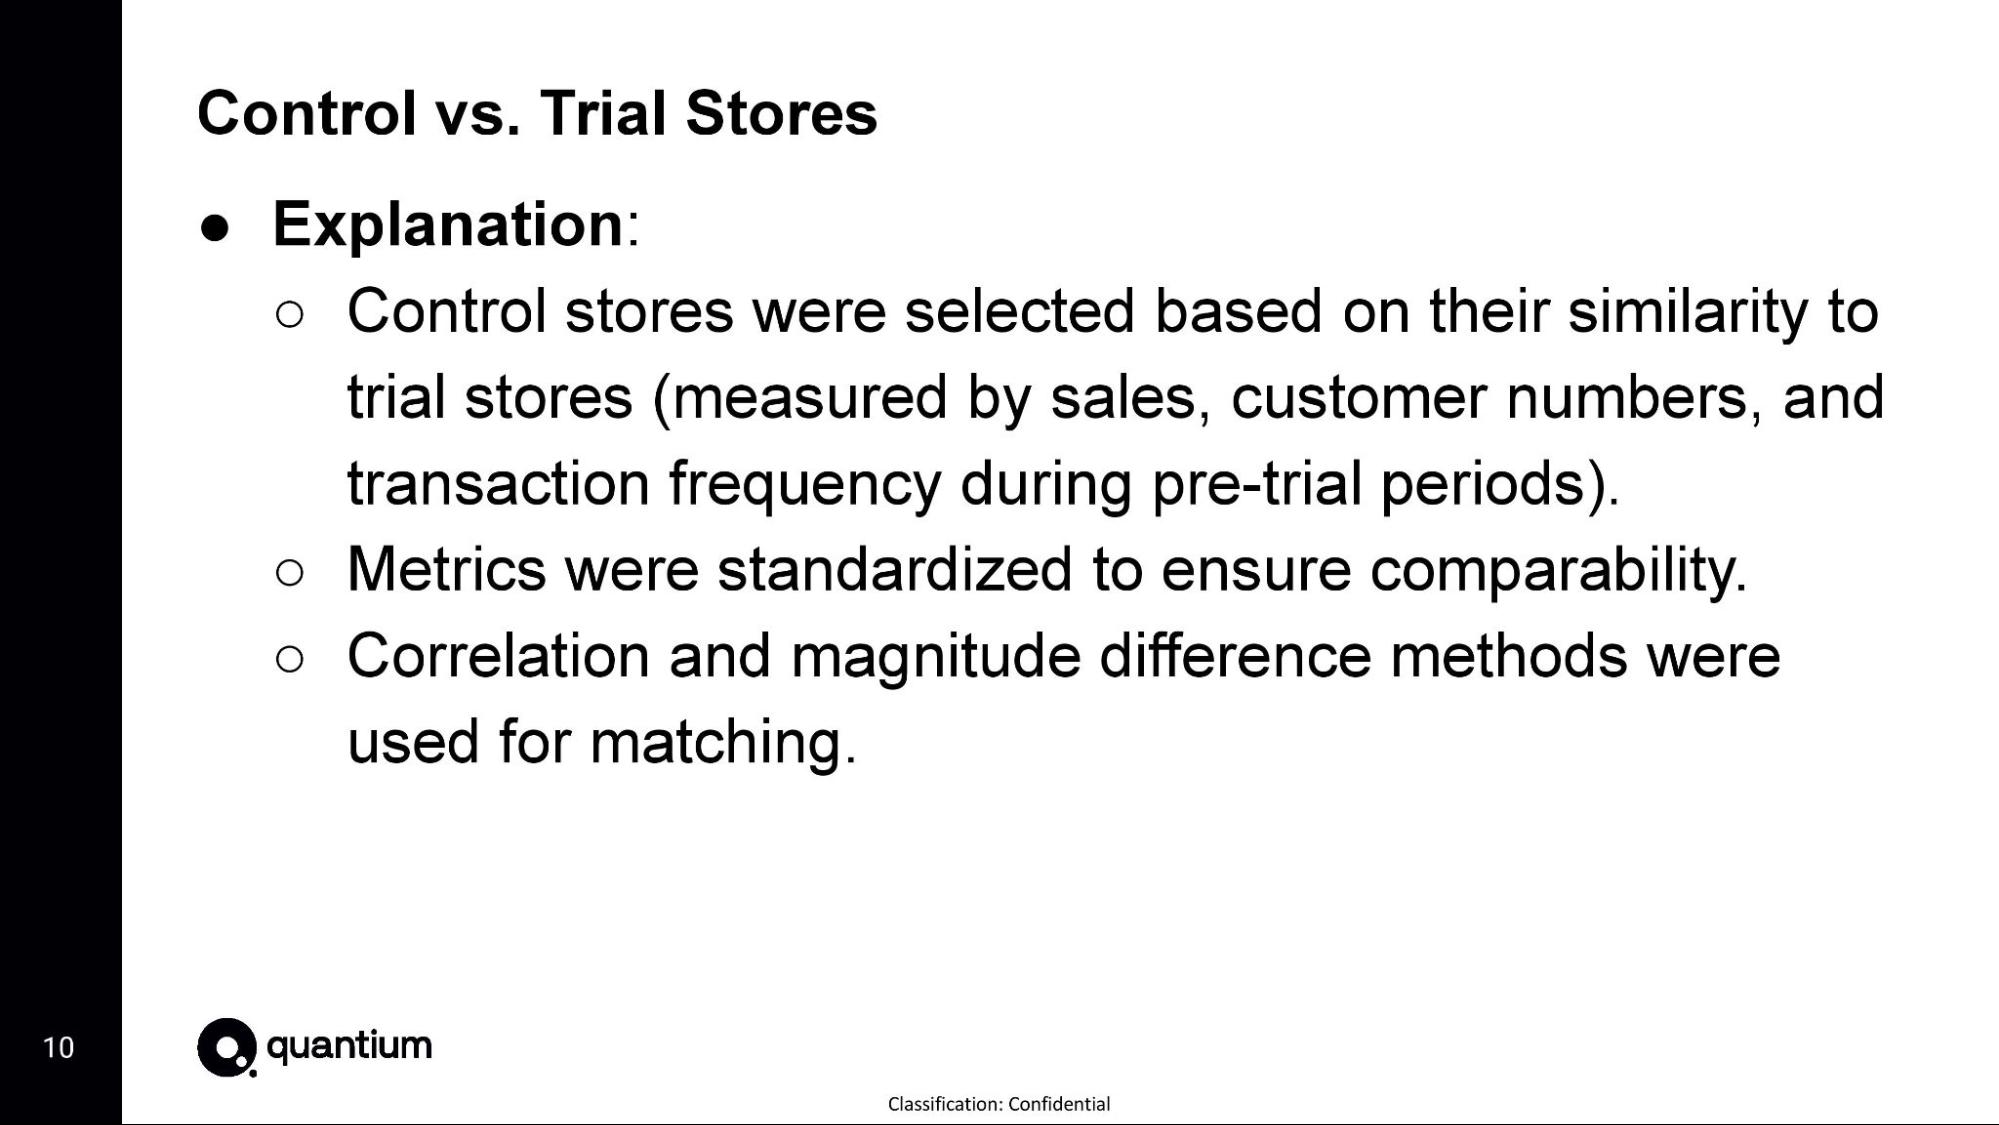
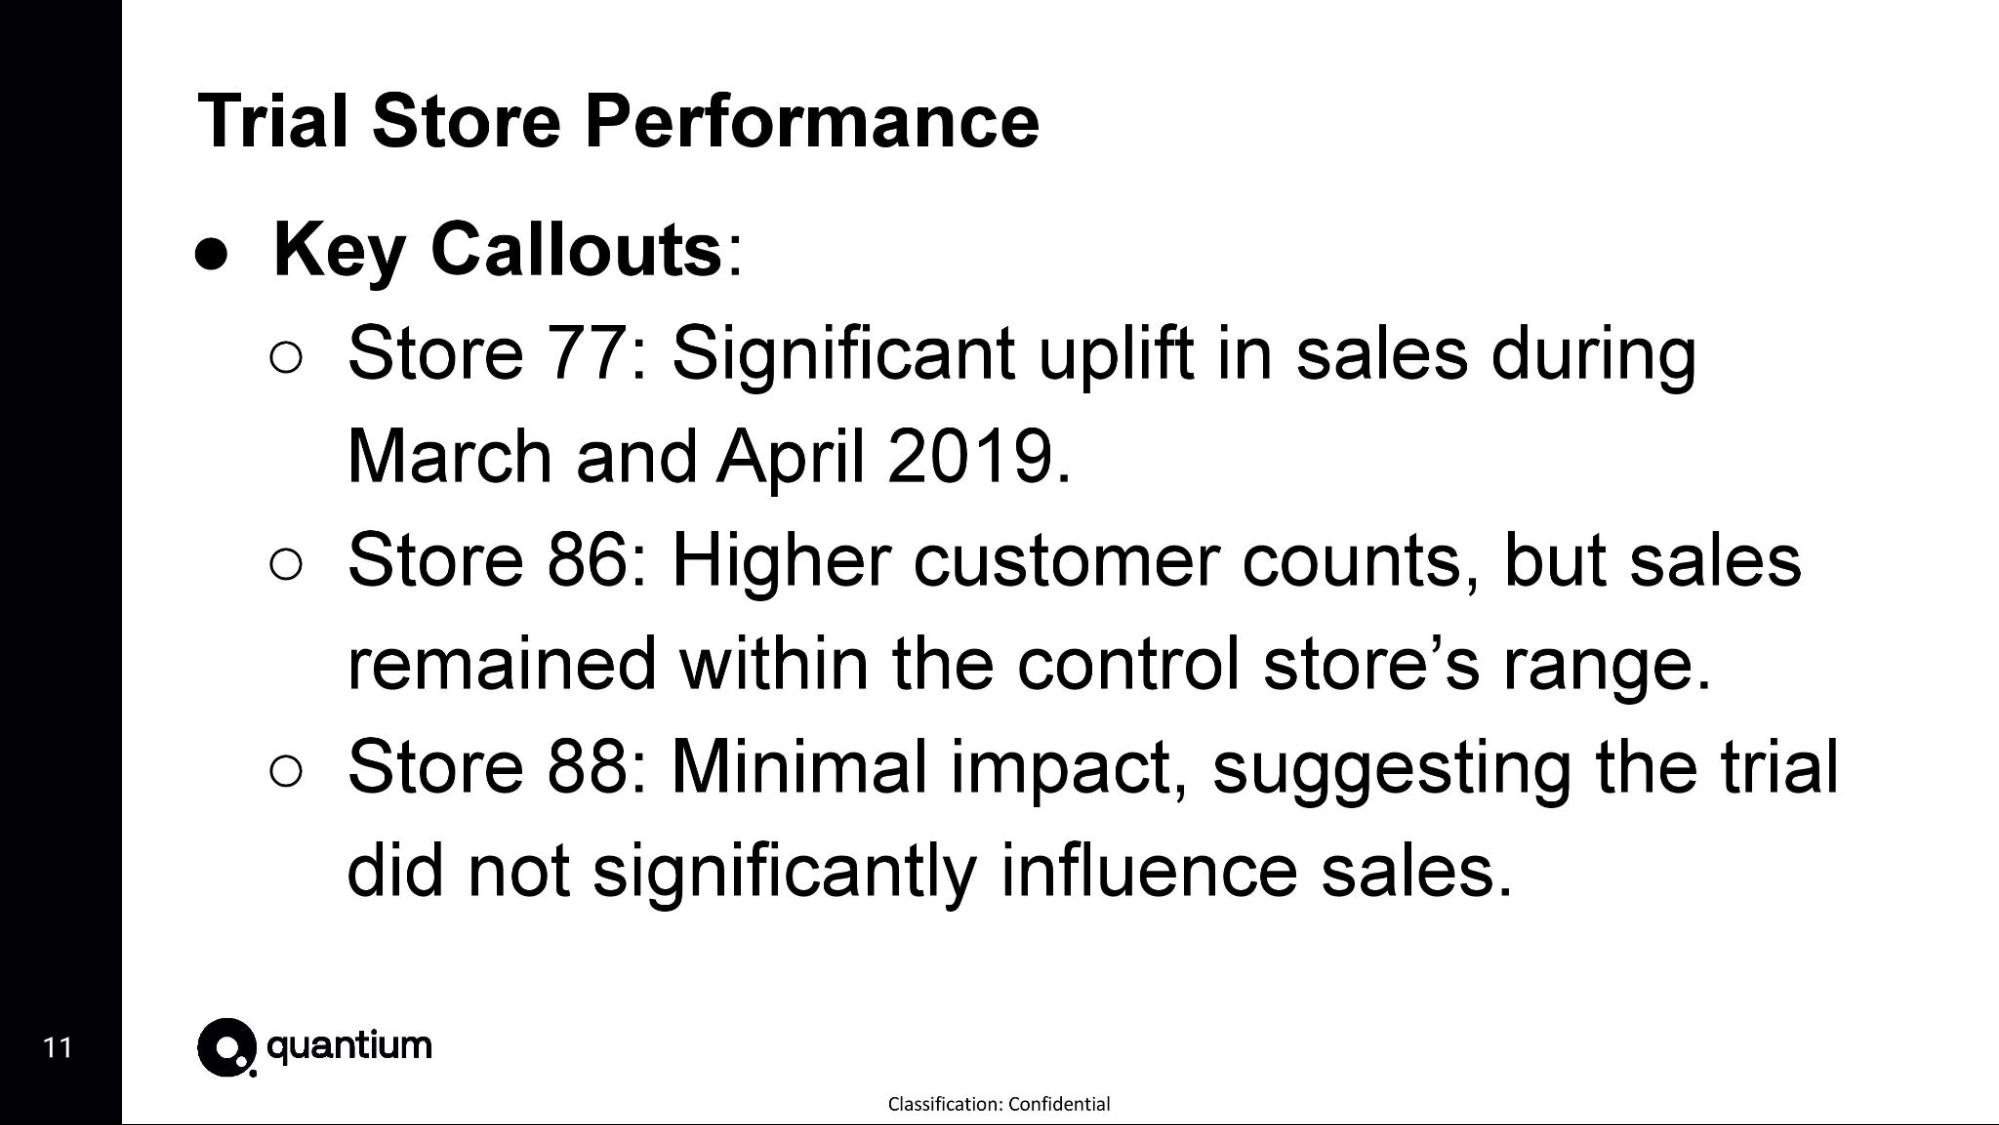
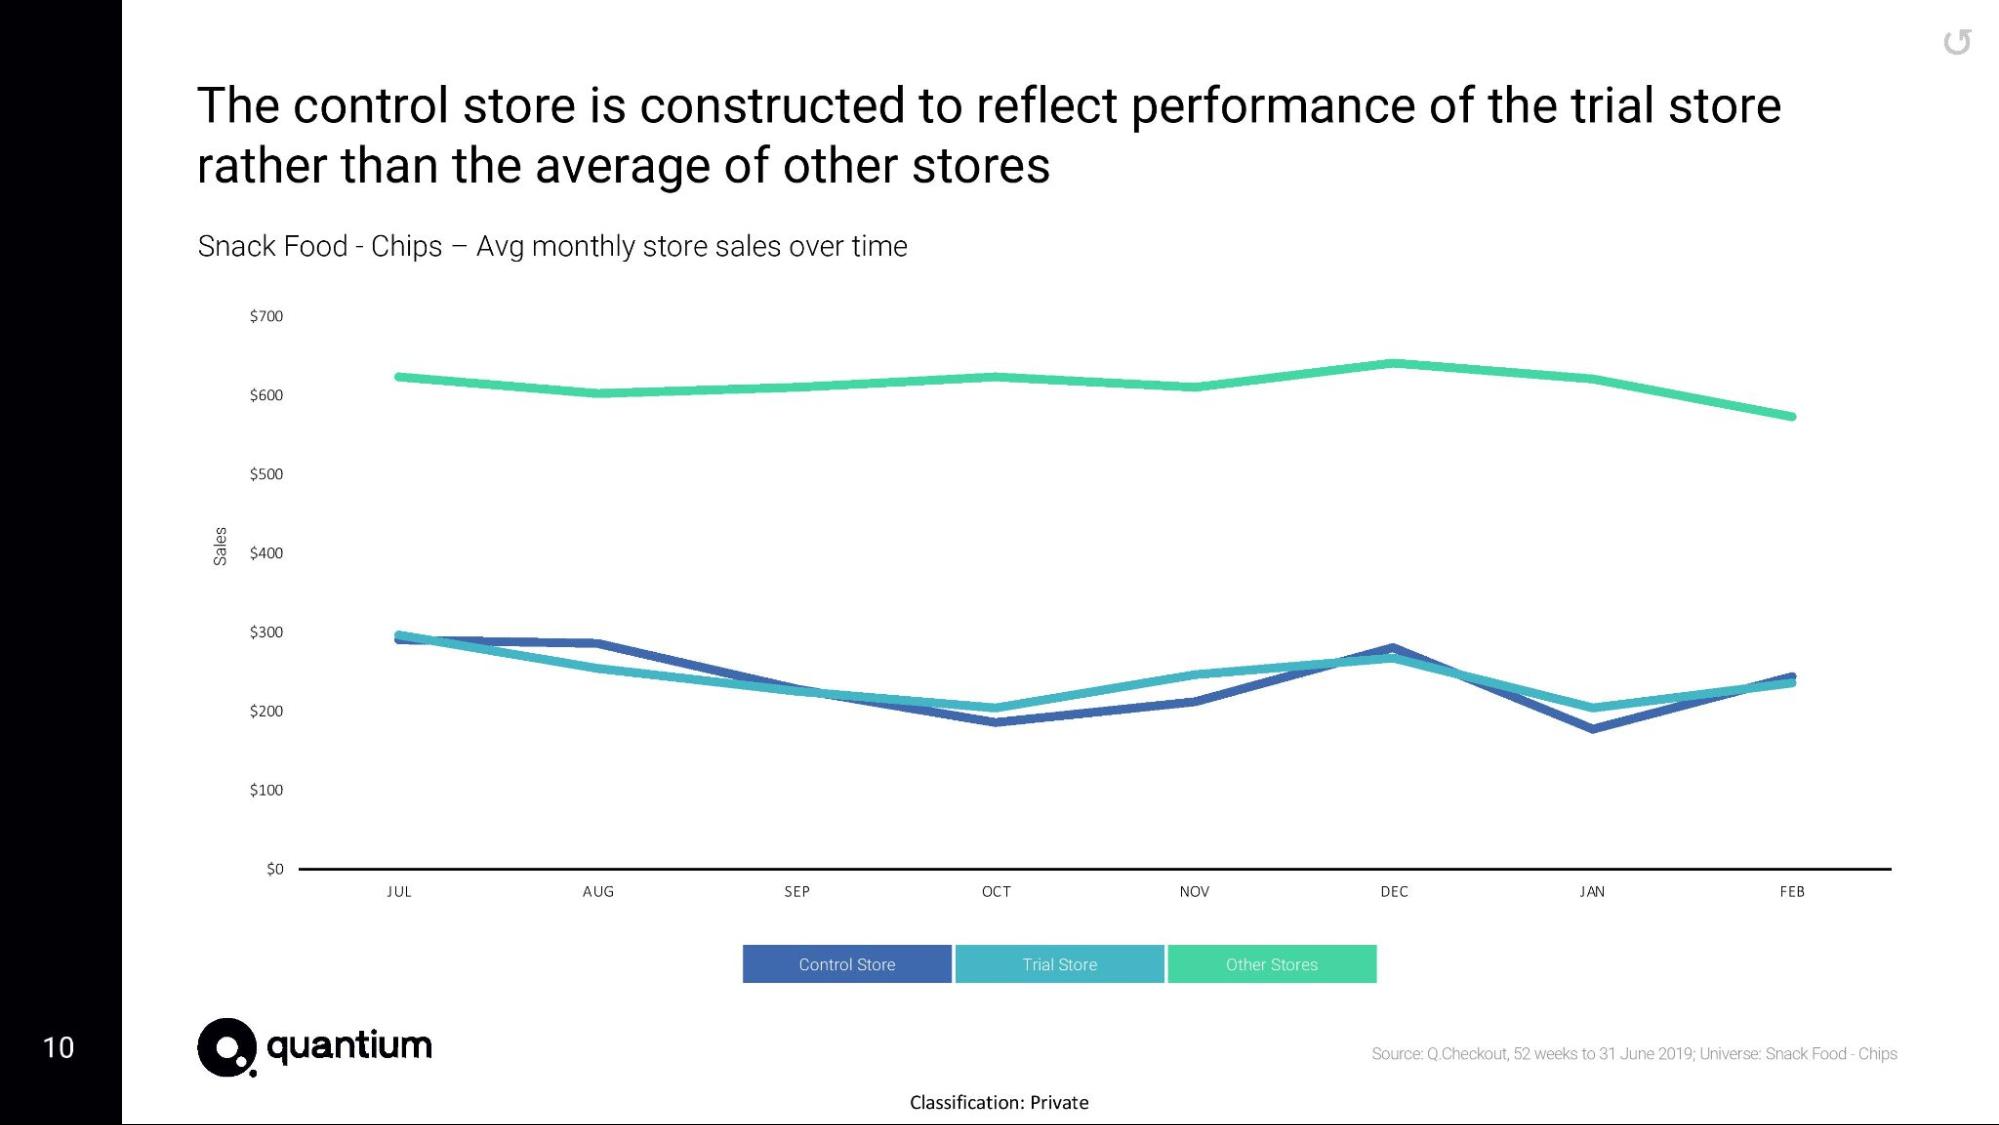
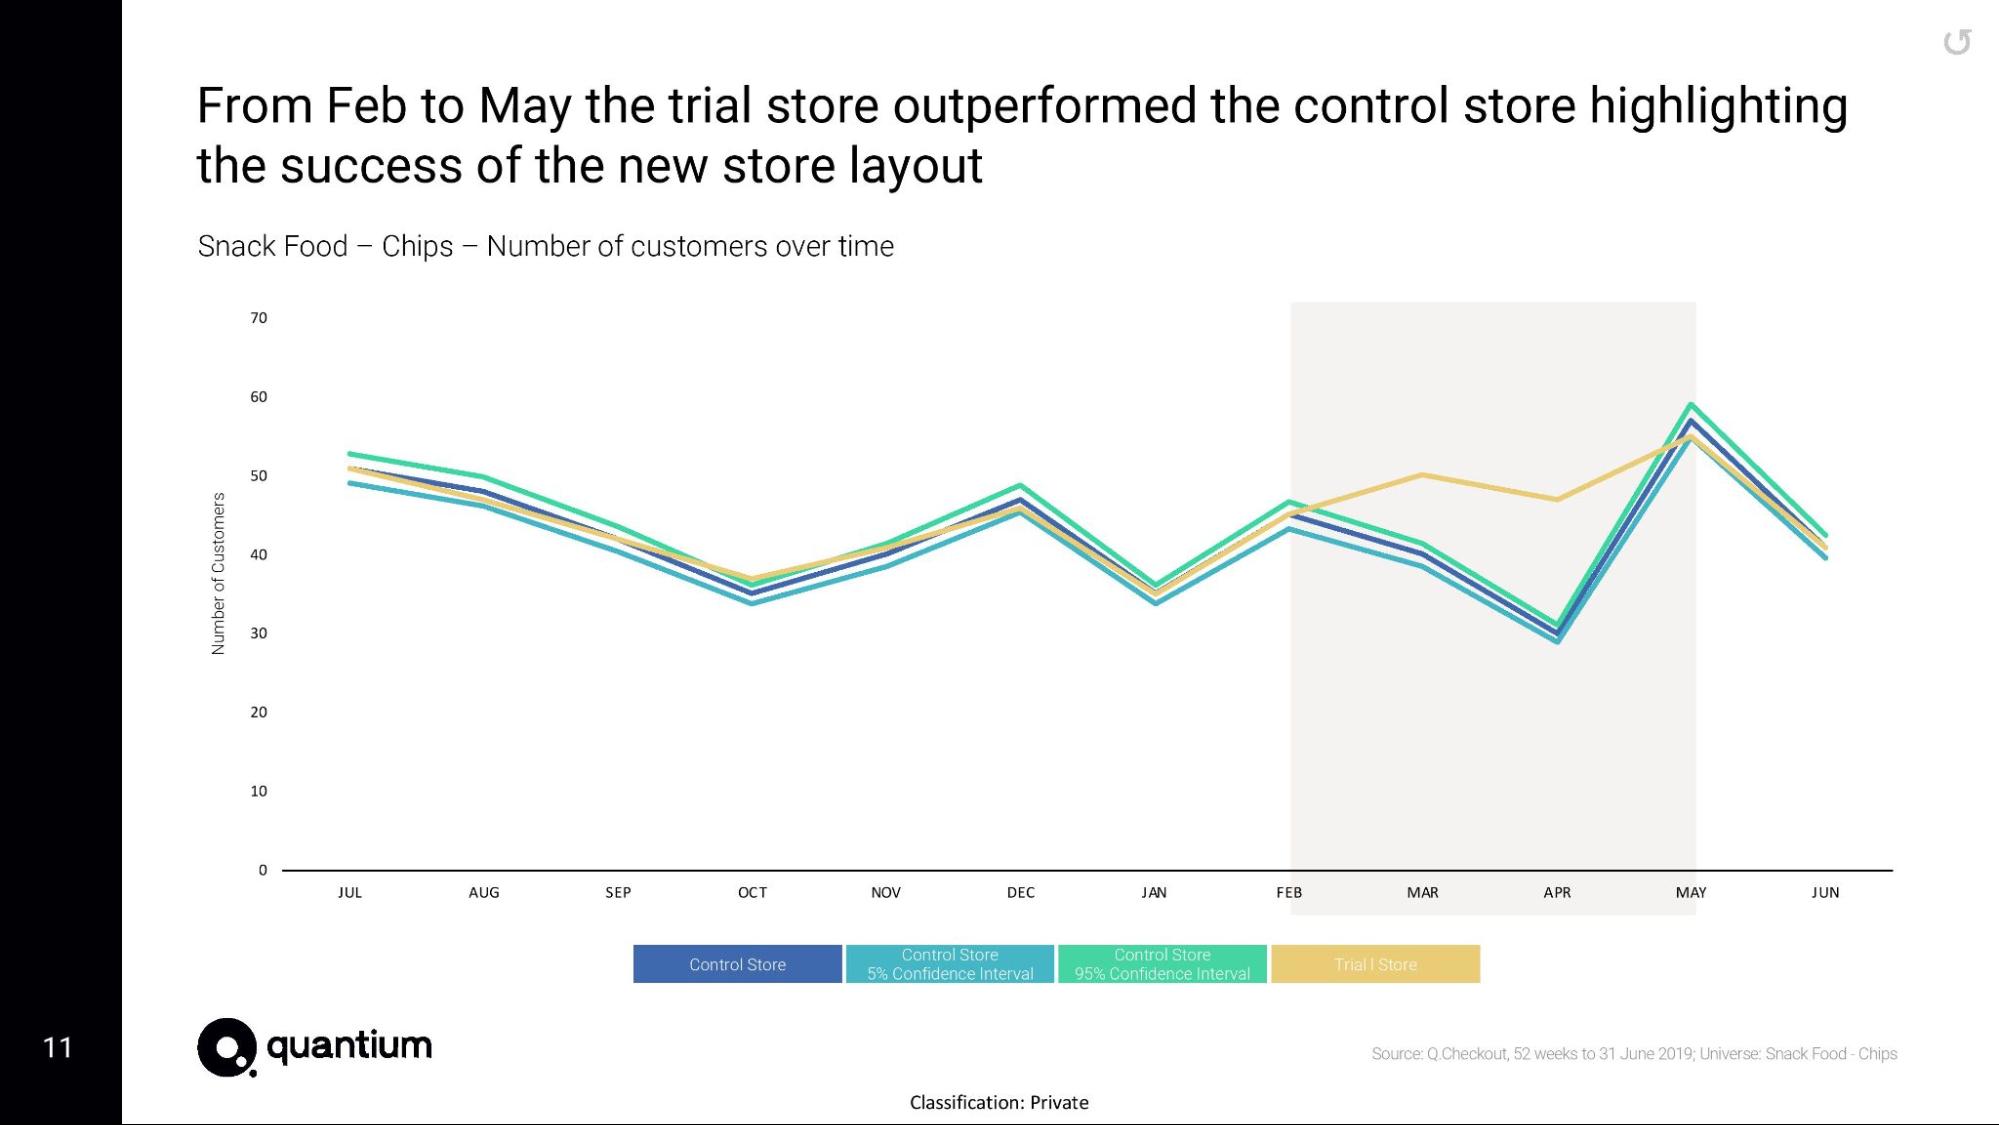
3 Here is your task | Here is your taskJulia has asked us to evaluate the performance of a store trial which was performed in stores 77, 86 and 88. We have chosen to complete this task in R, however, you will also find Python to be a useful tool in this piece of analytics. We have also provided an R solution template if you want some assistance in getting through this Task. To get started, use the QVI_data dataset below or your output from task 1 and consider the monthly sales experience of each store. This can be broken down by:
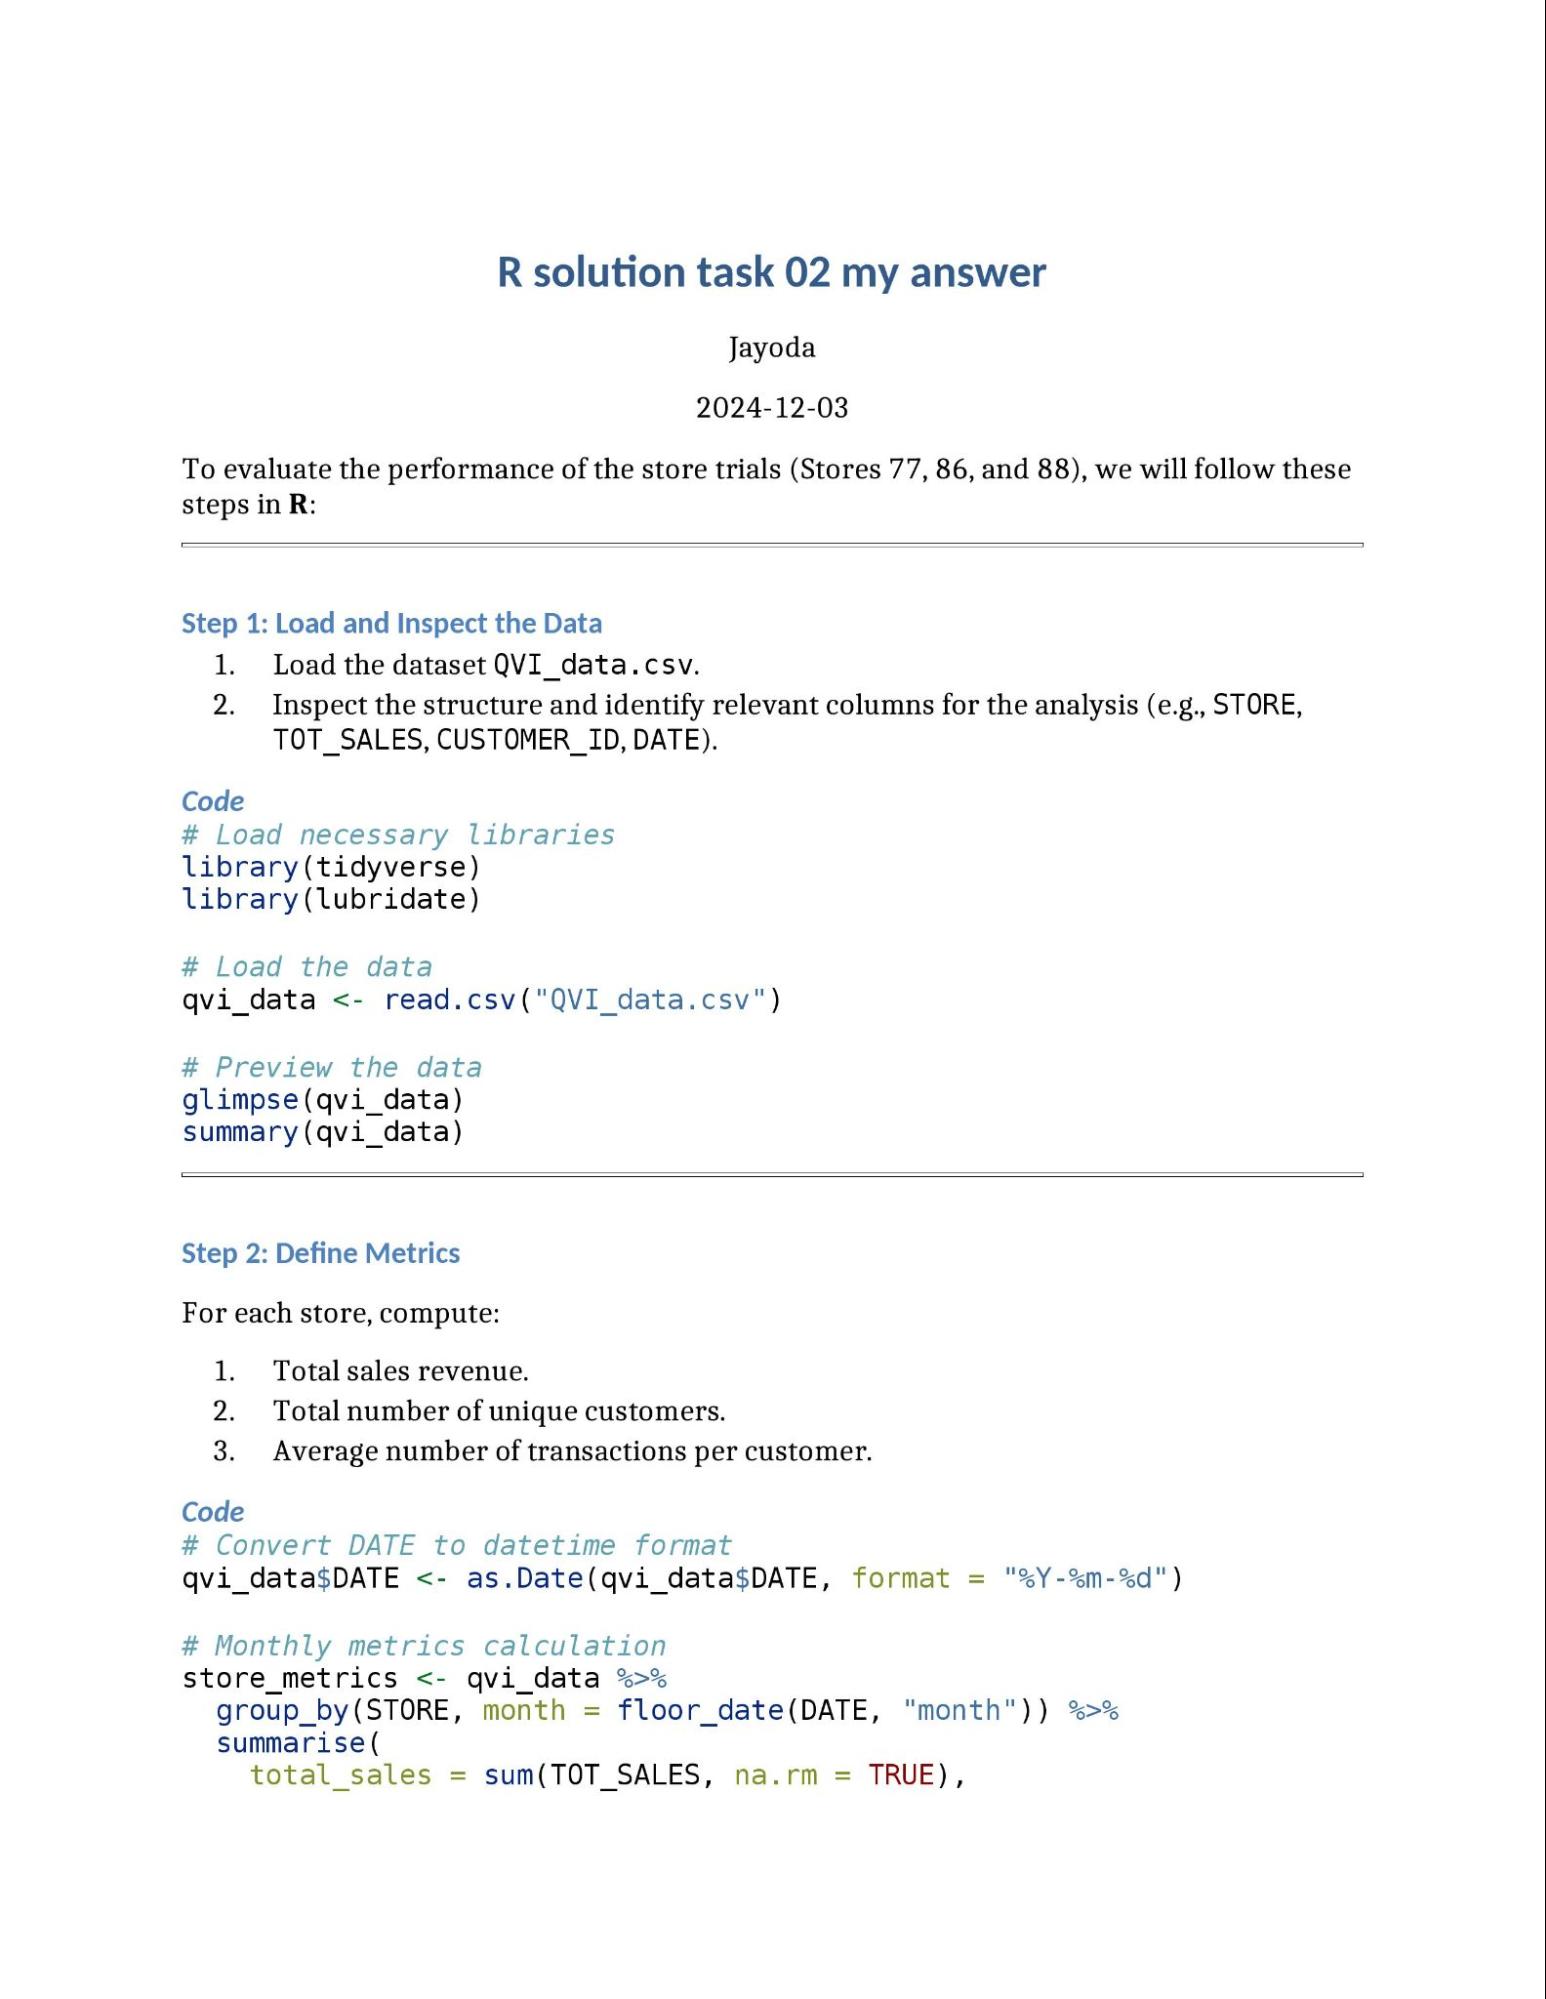
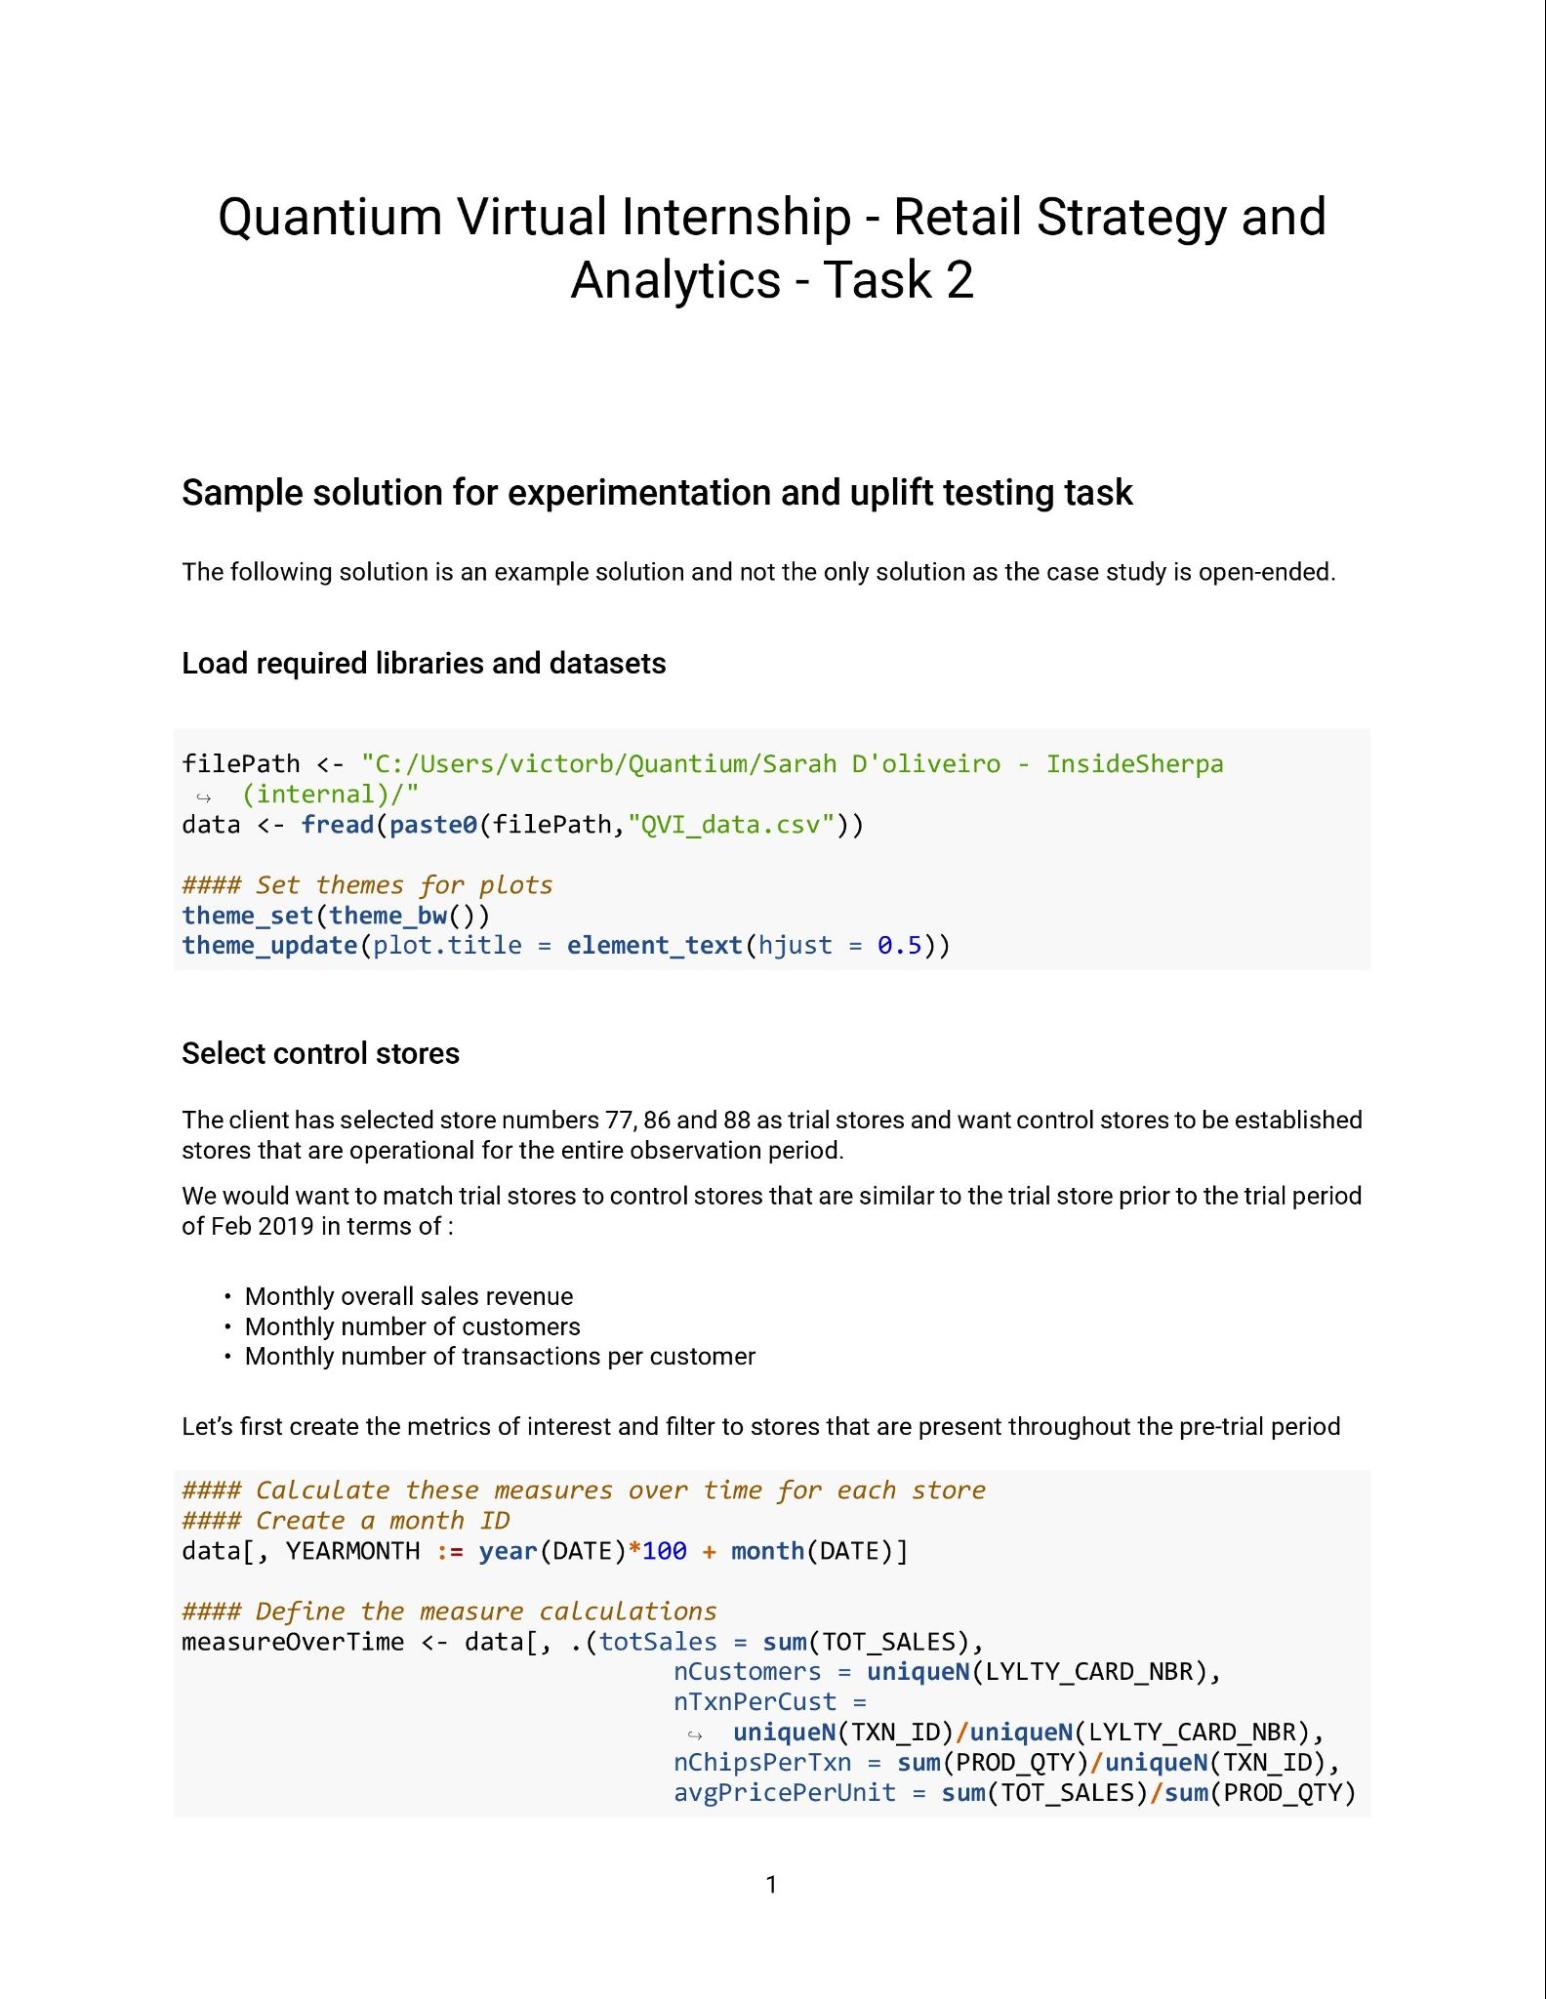
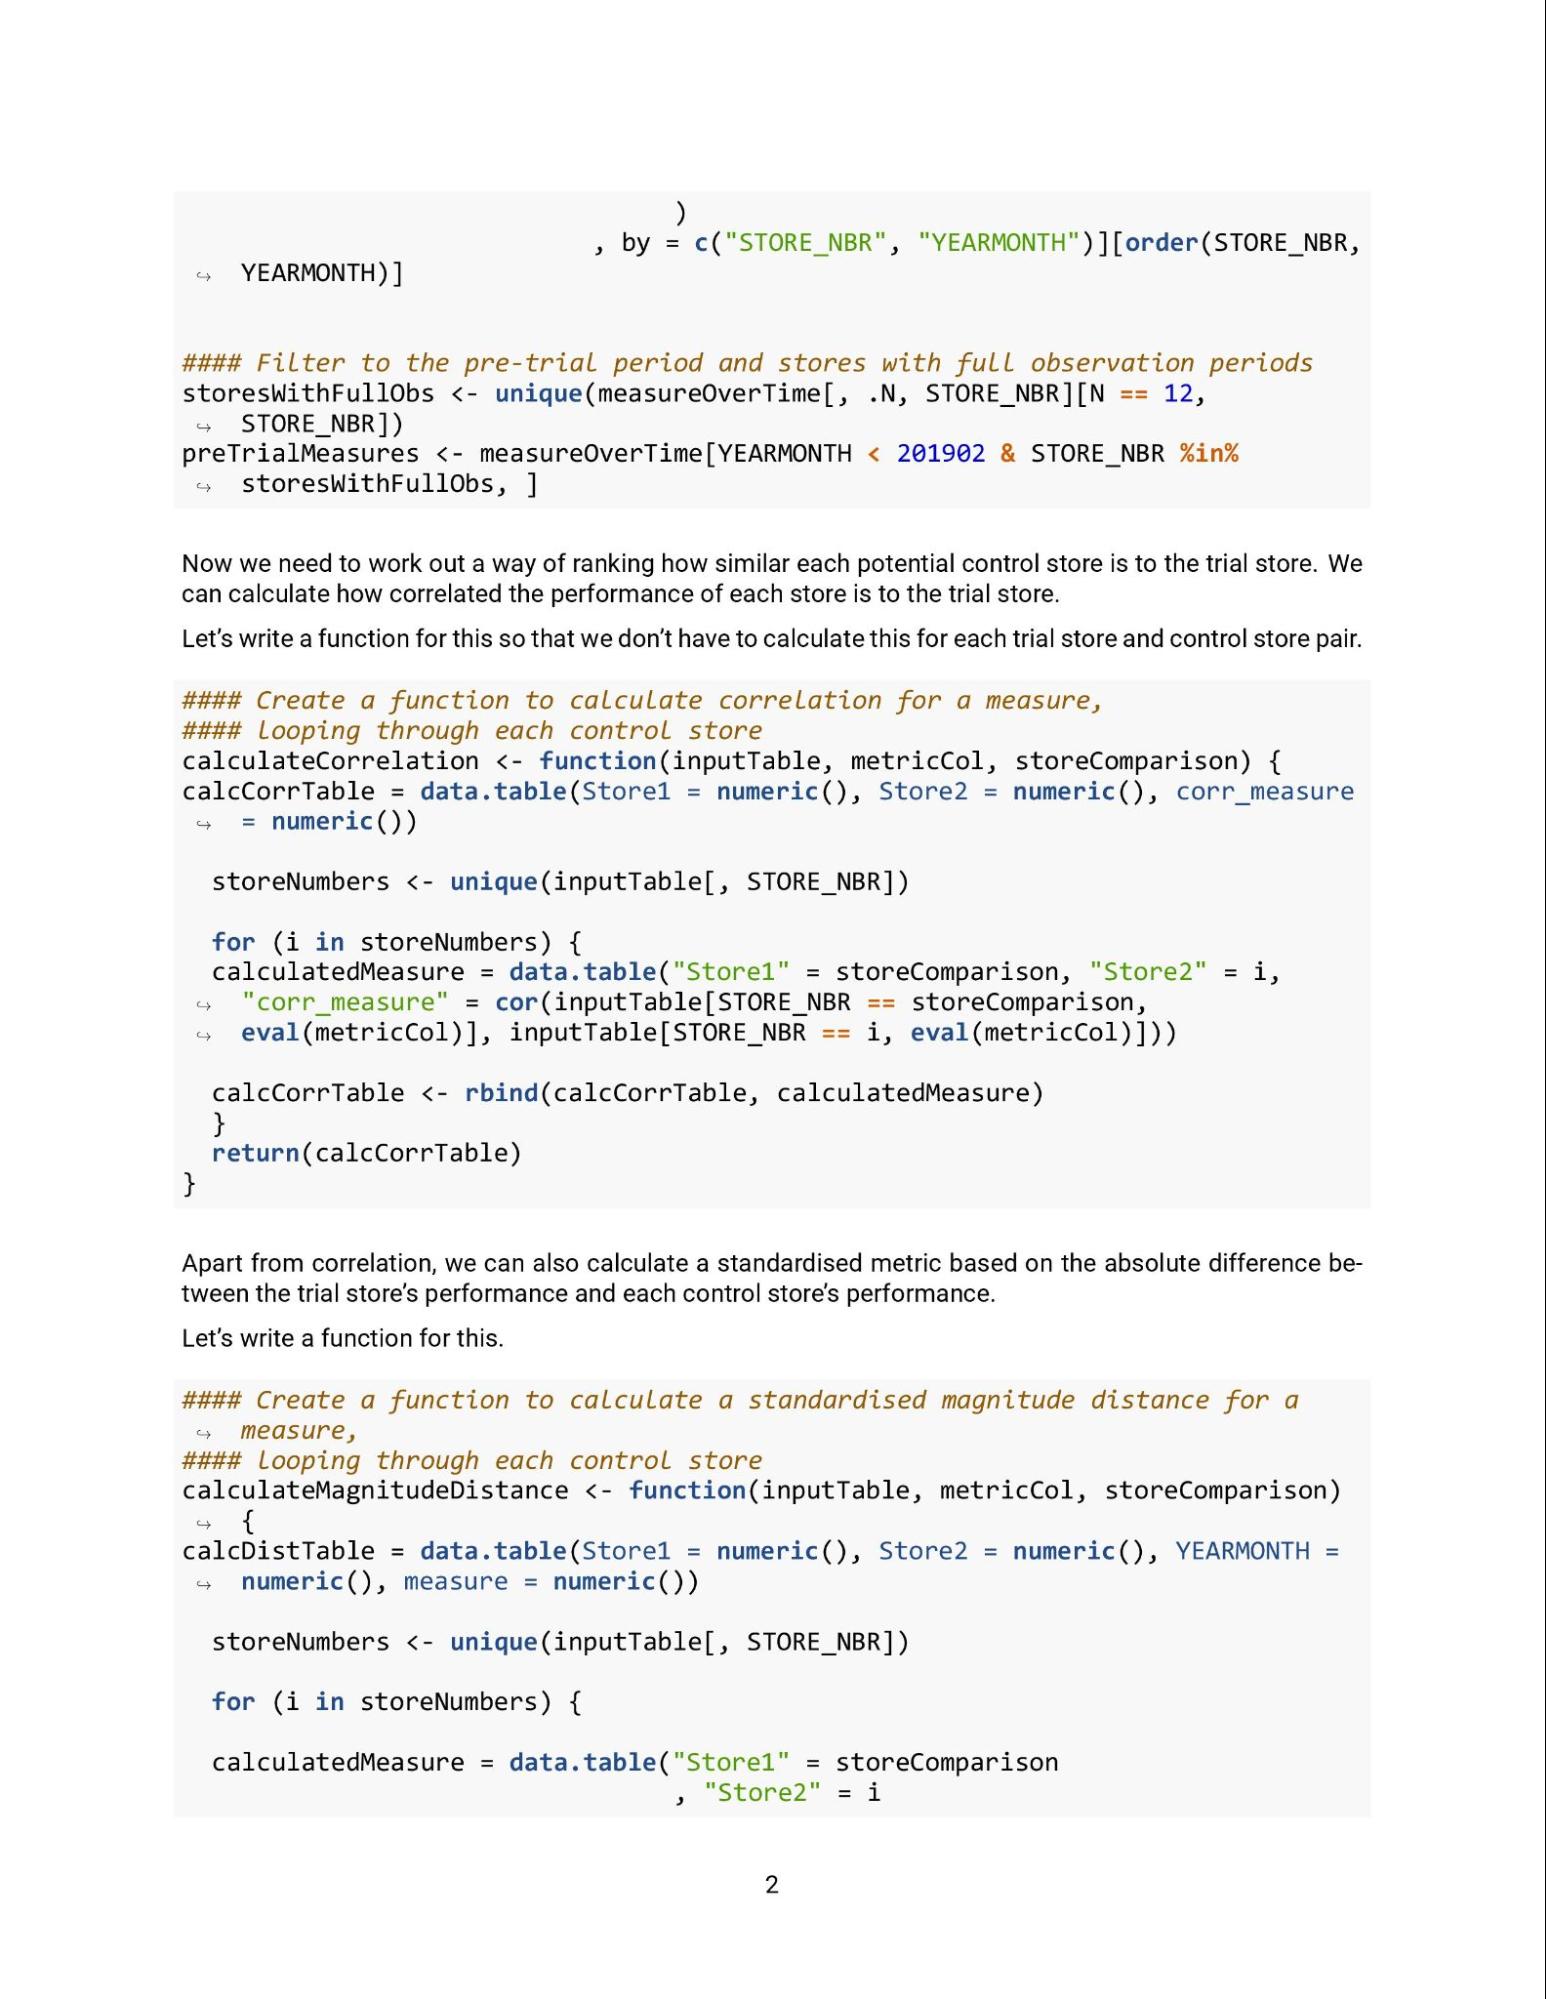
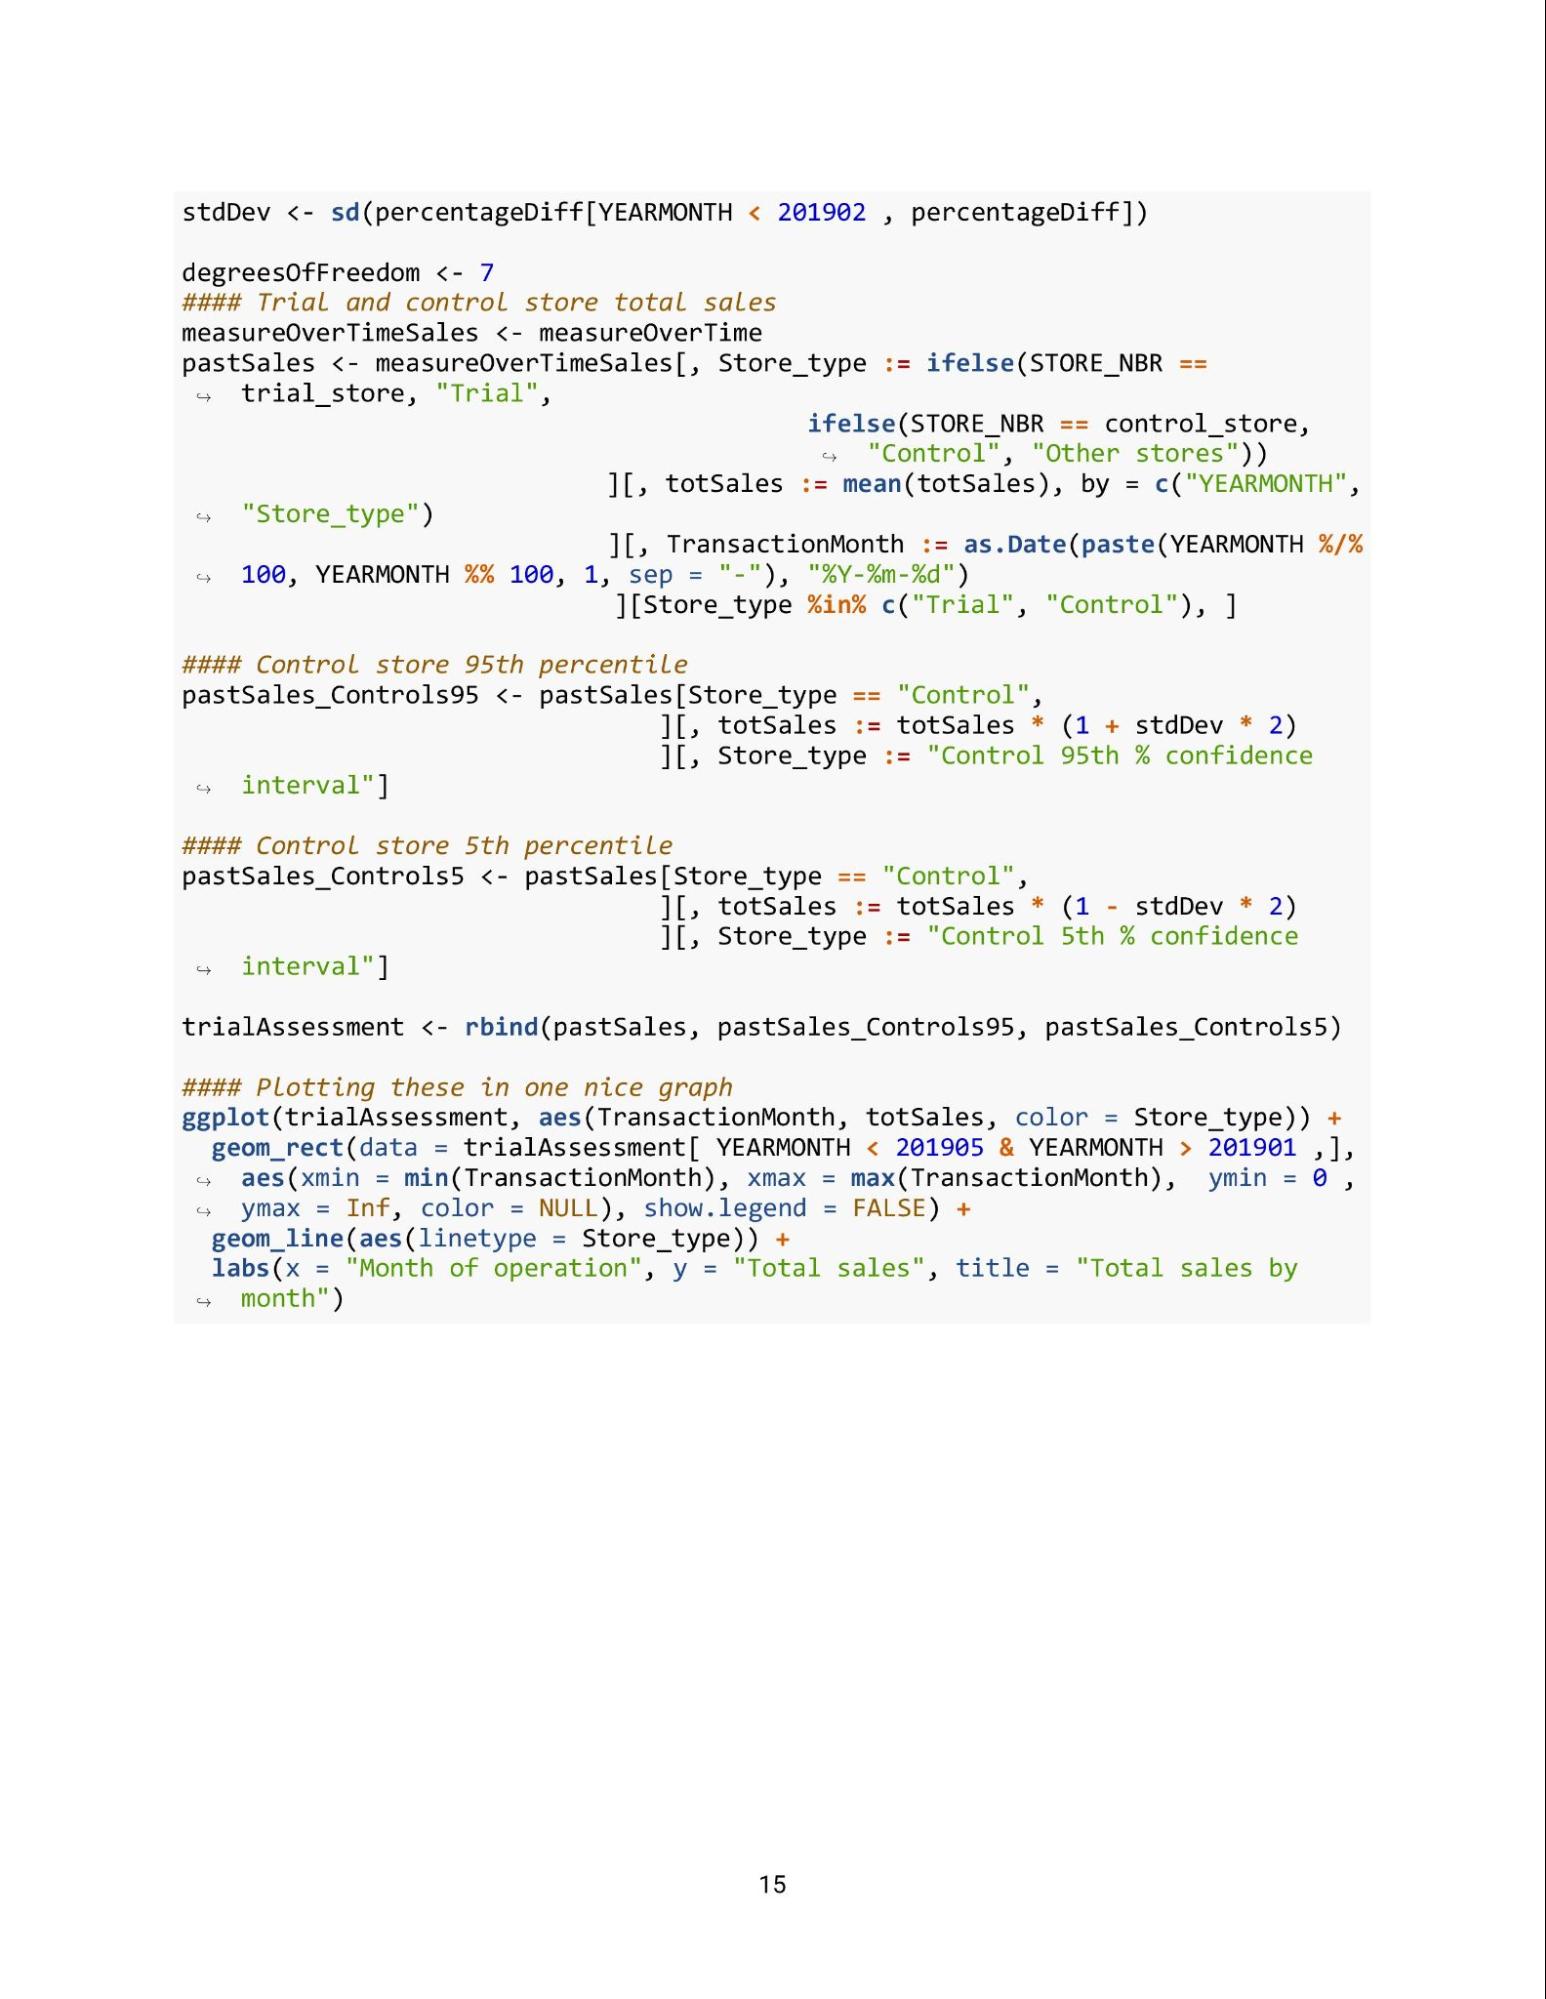
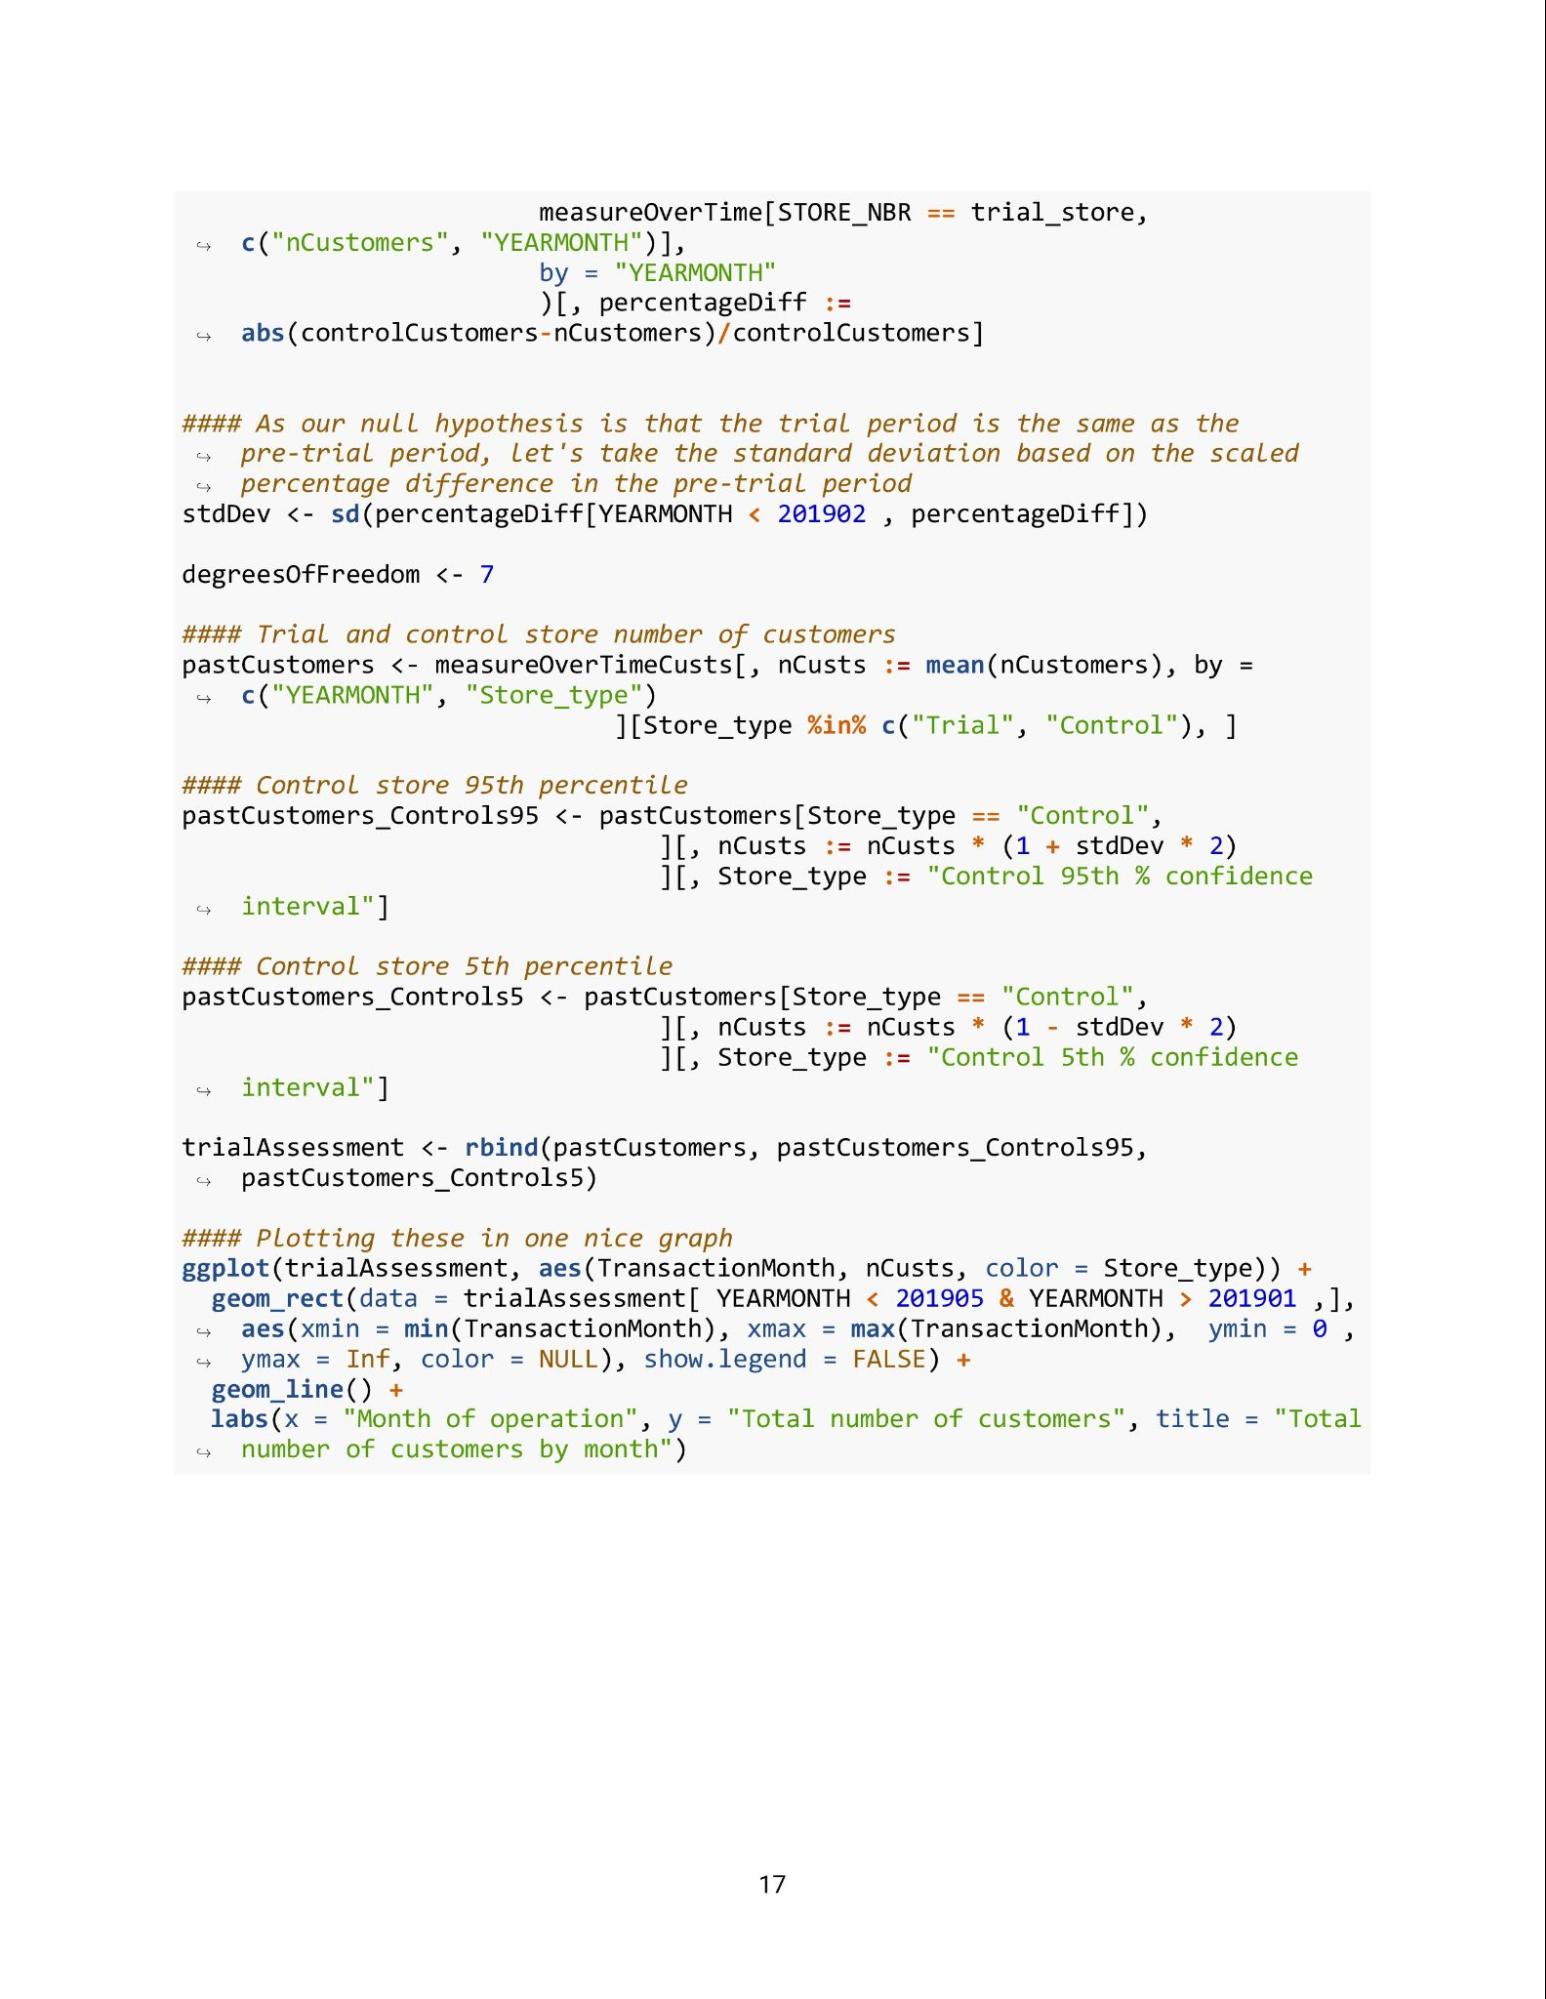
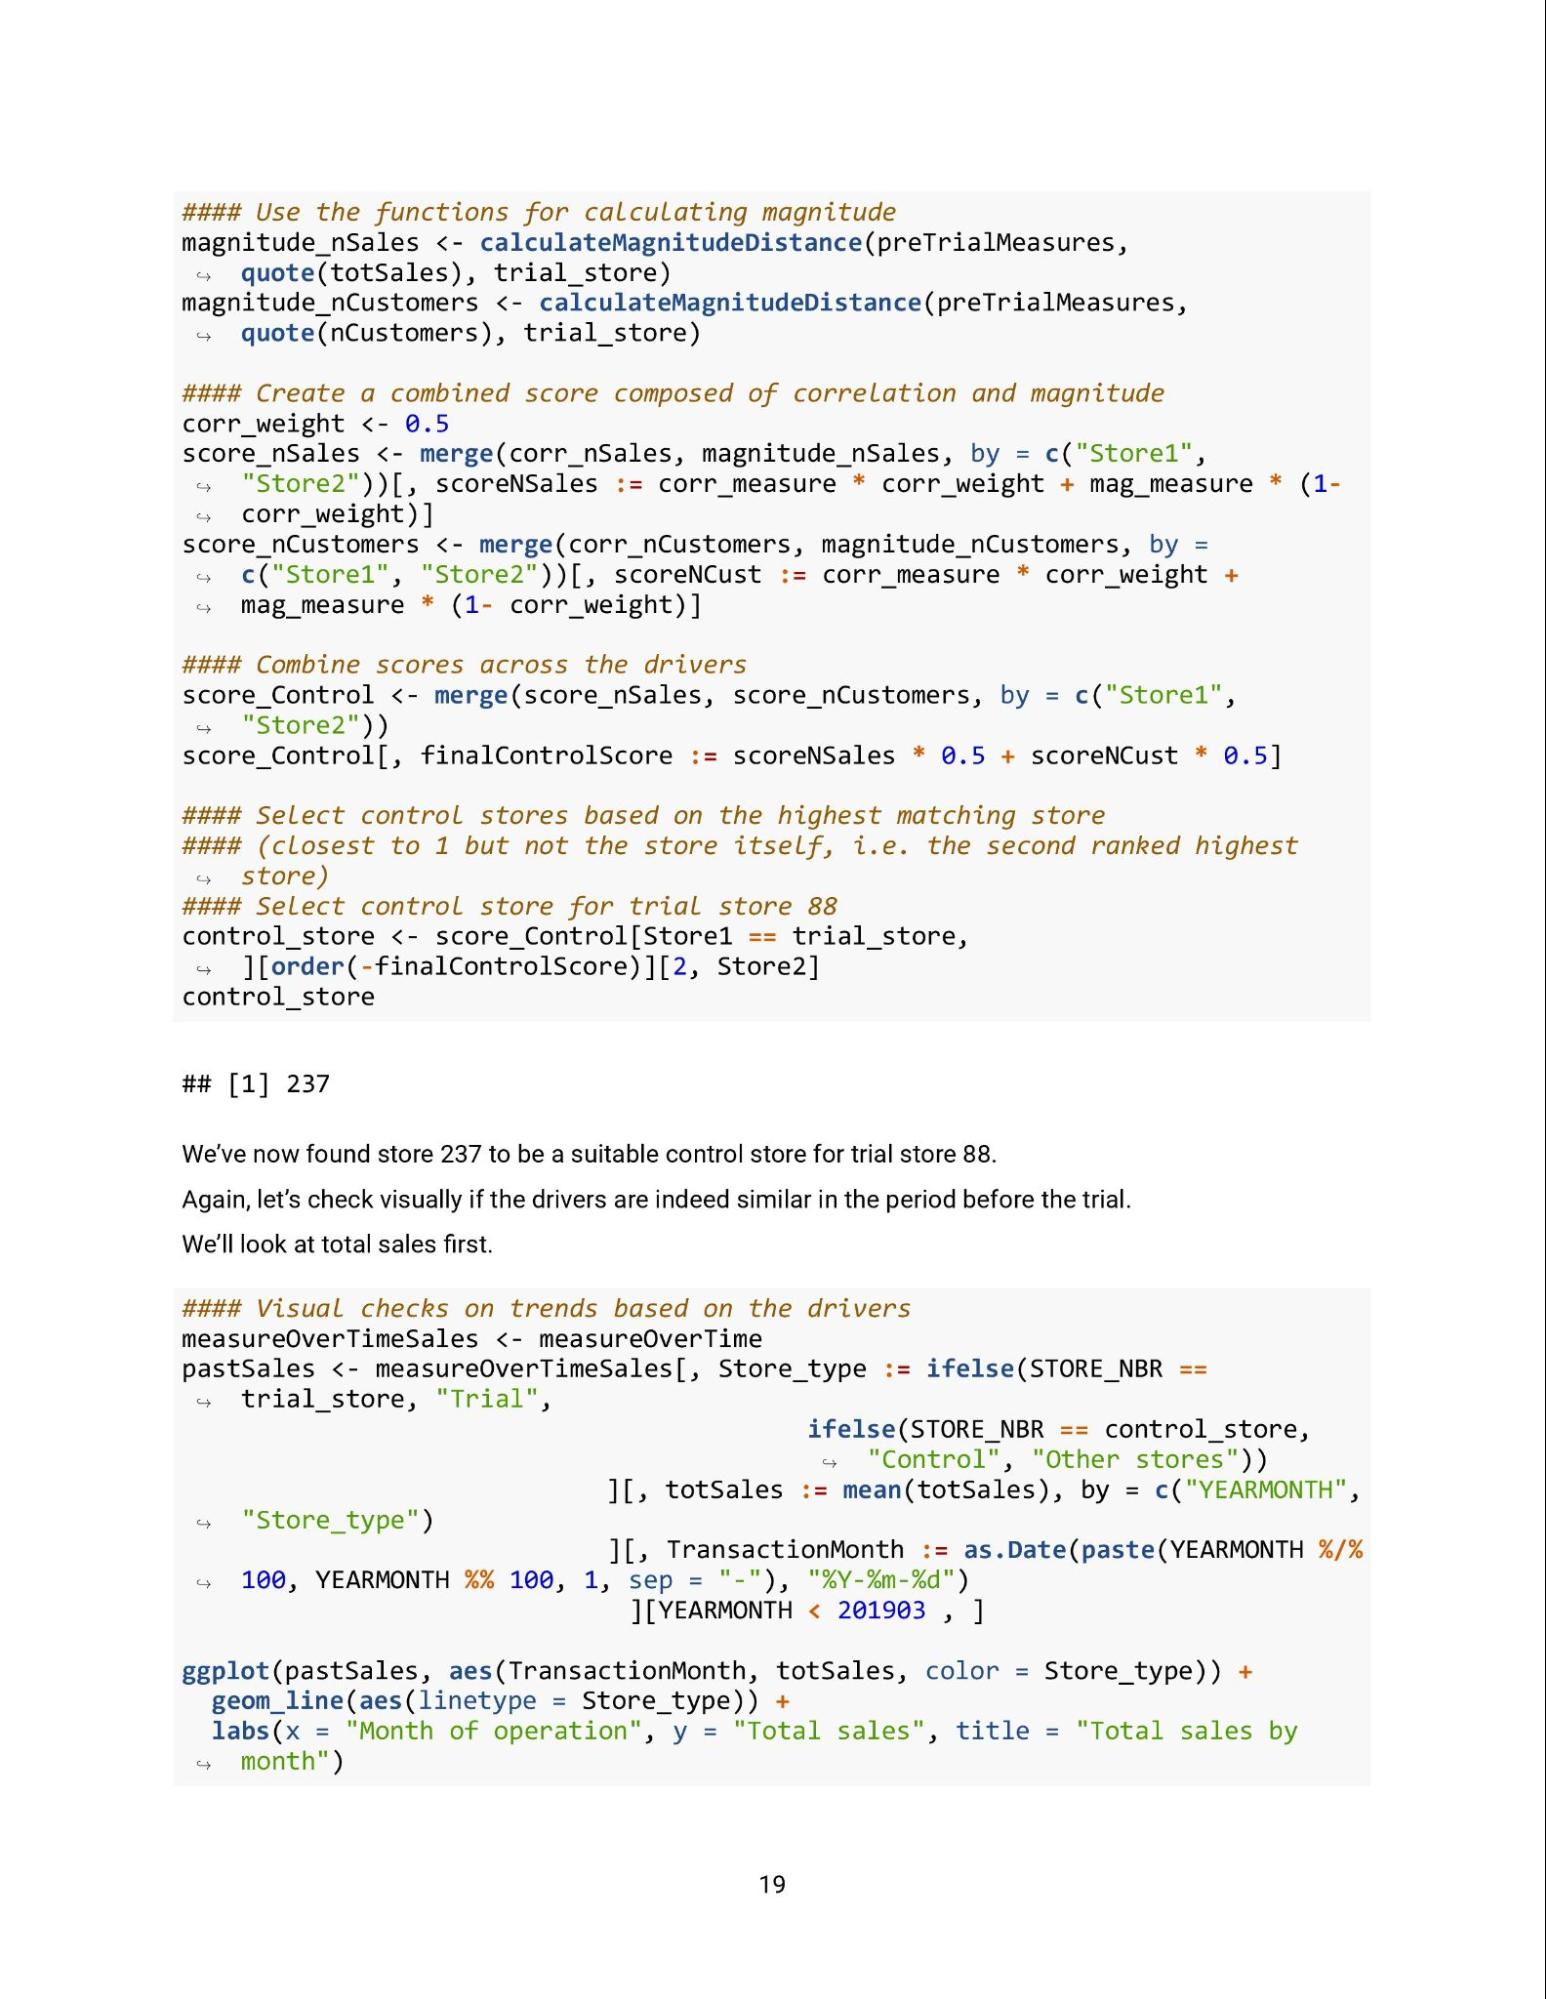
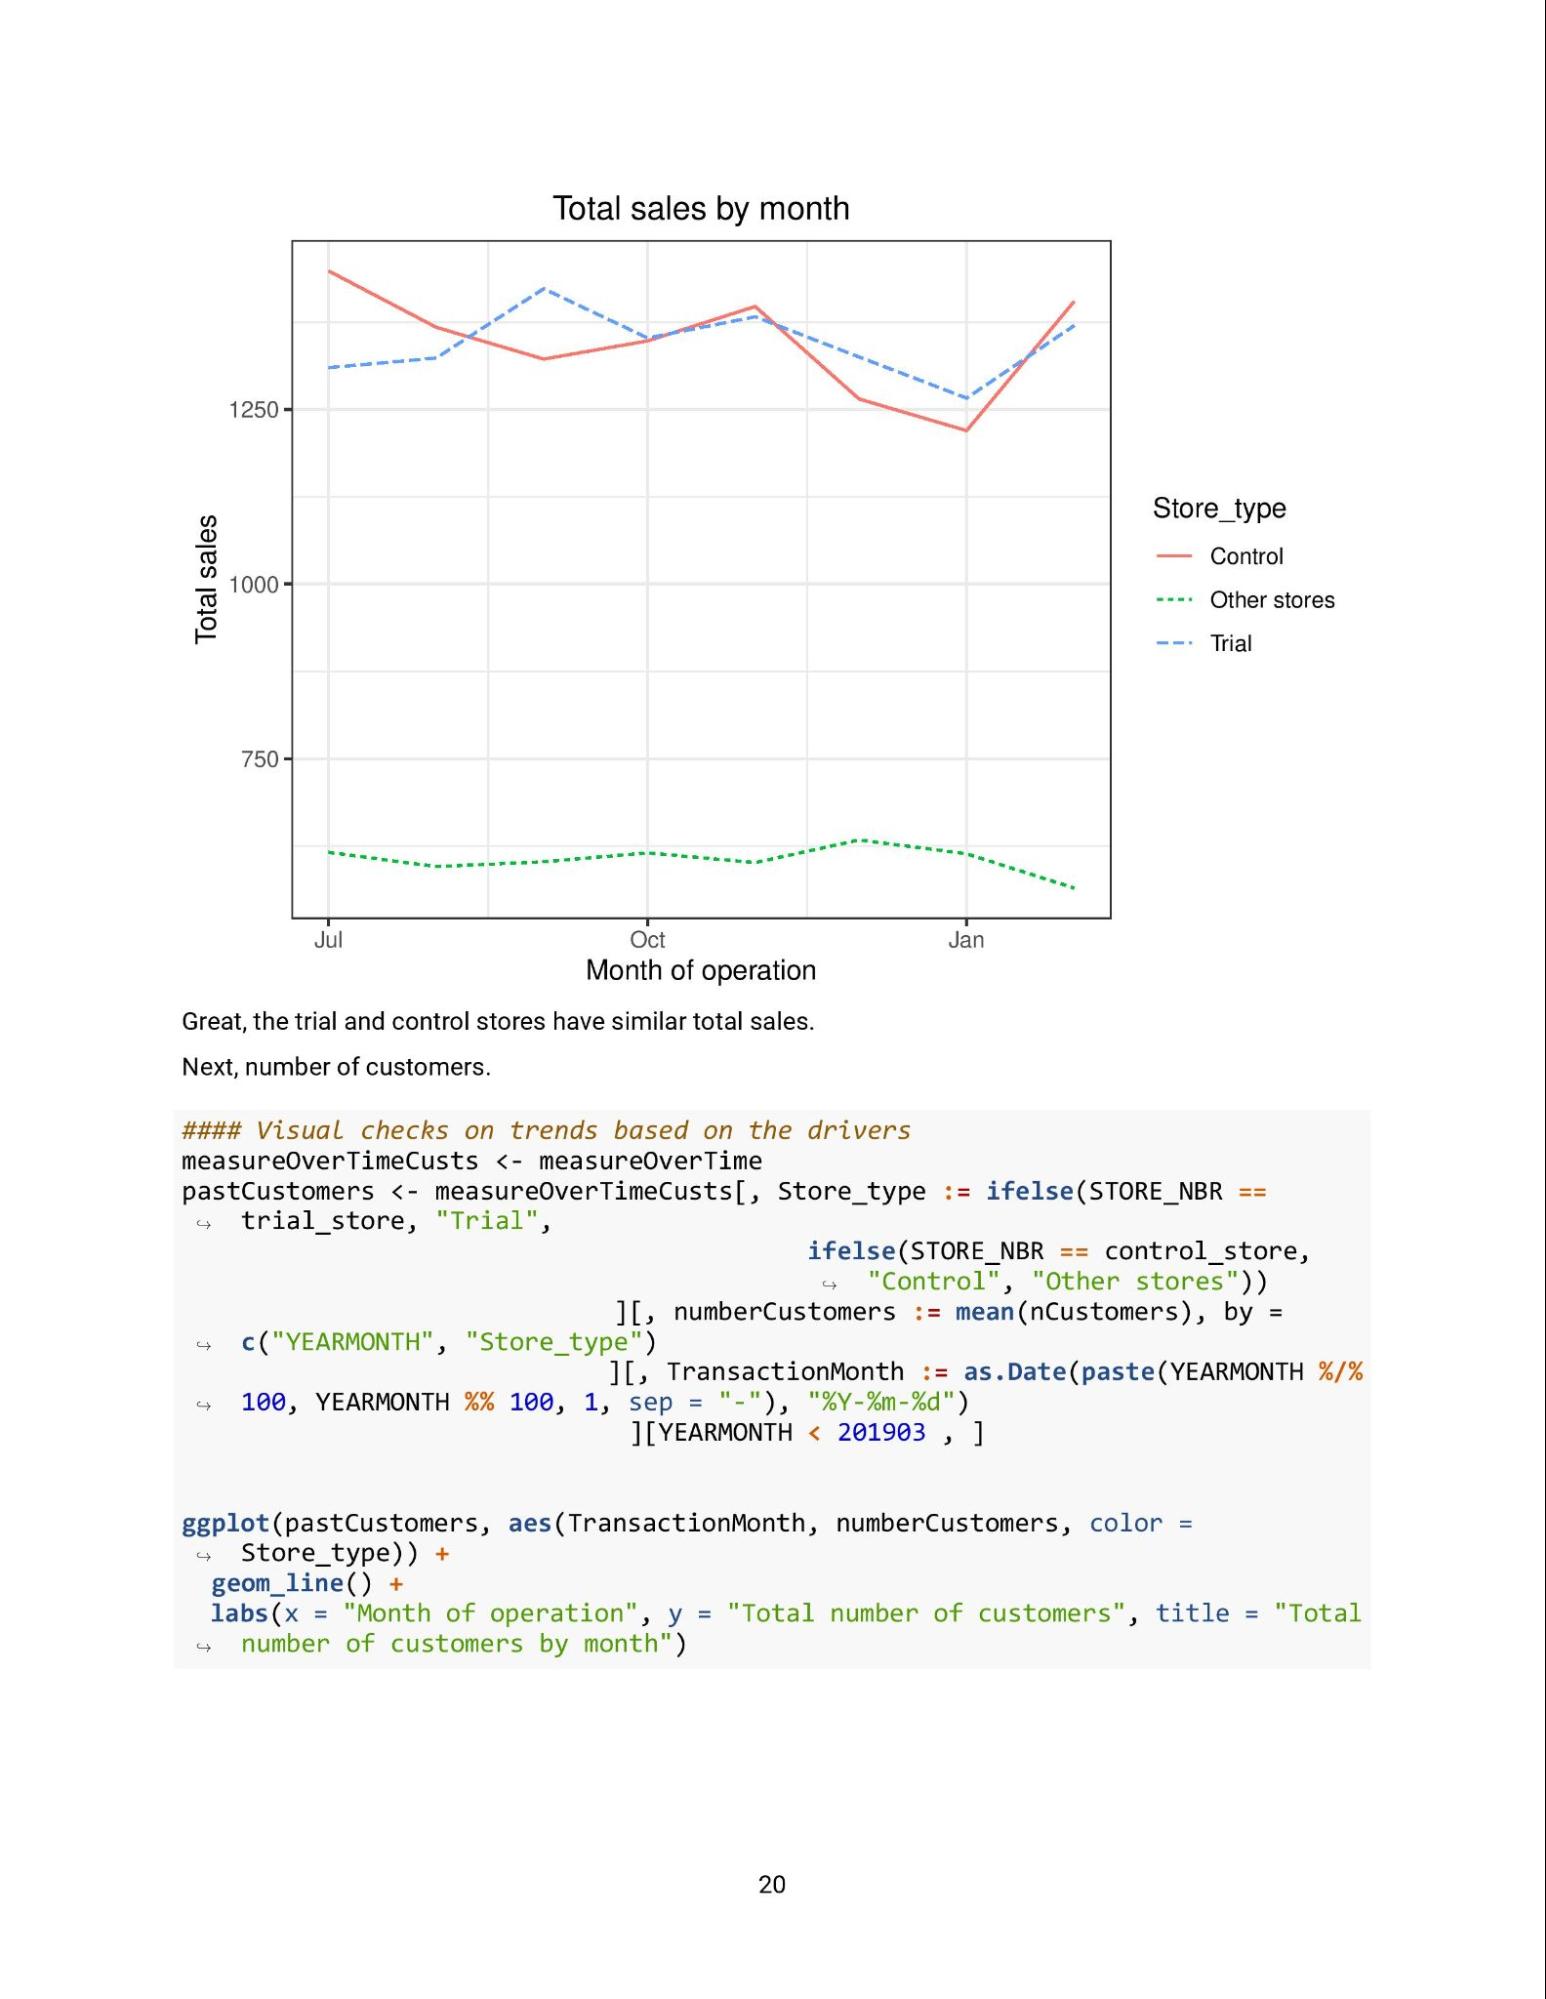
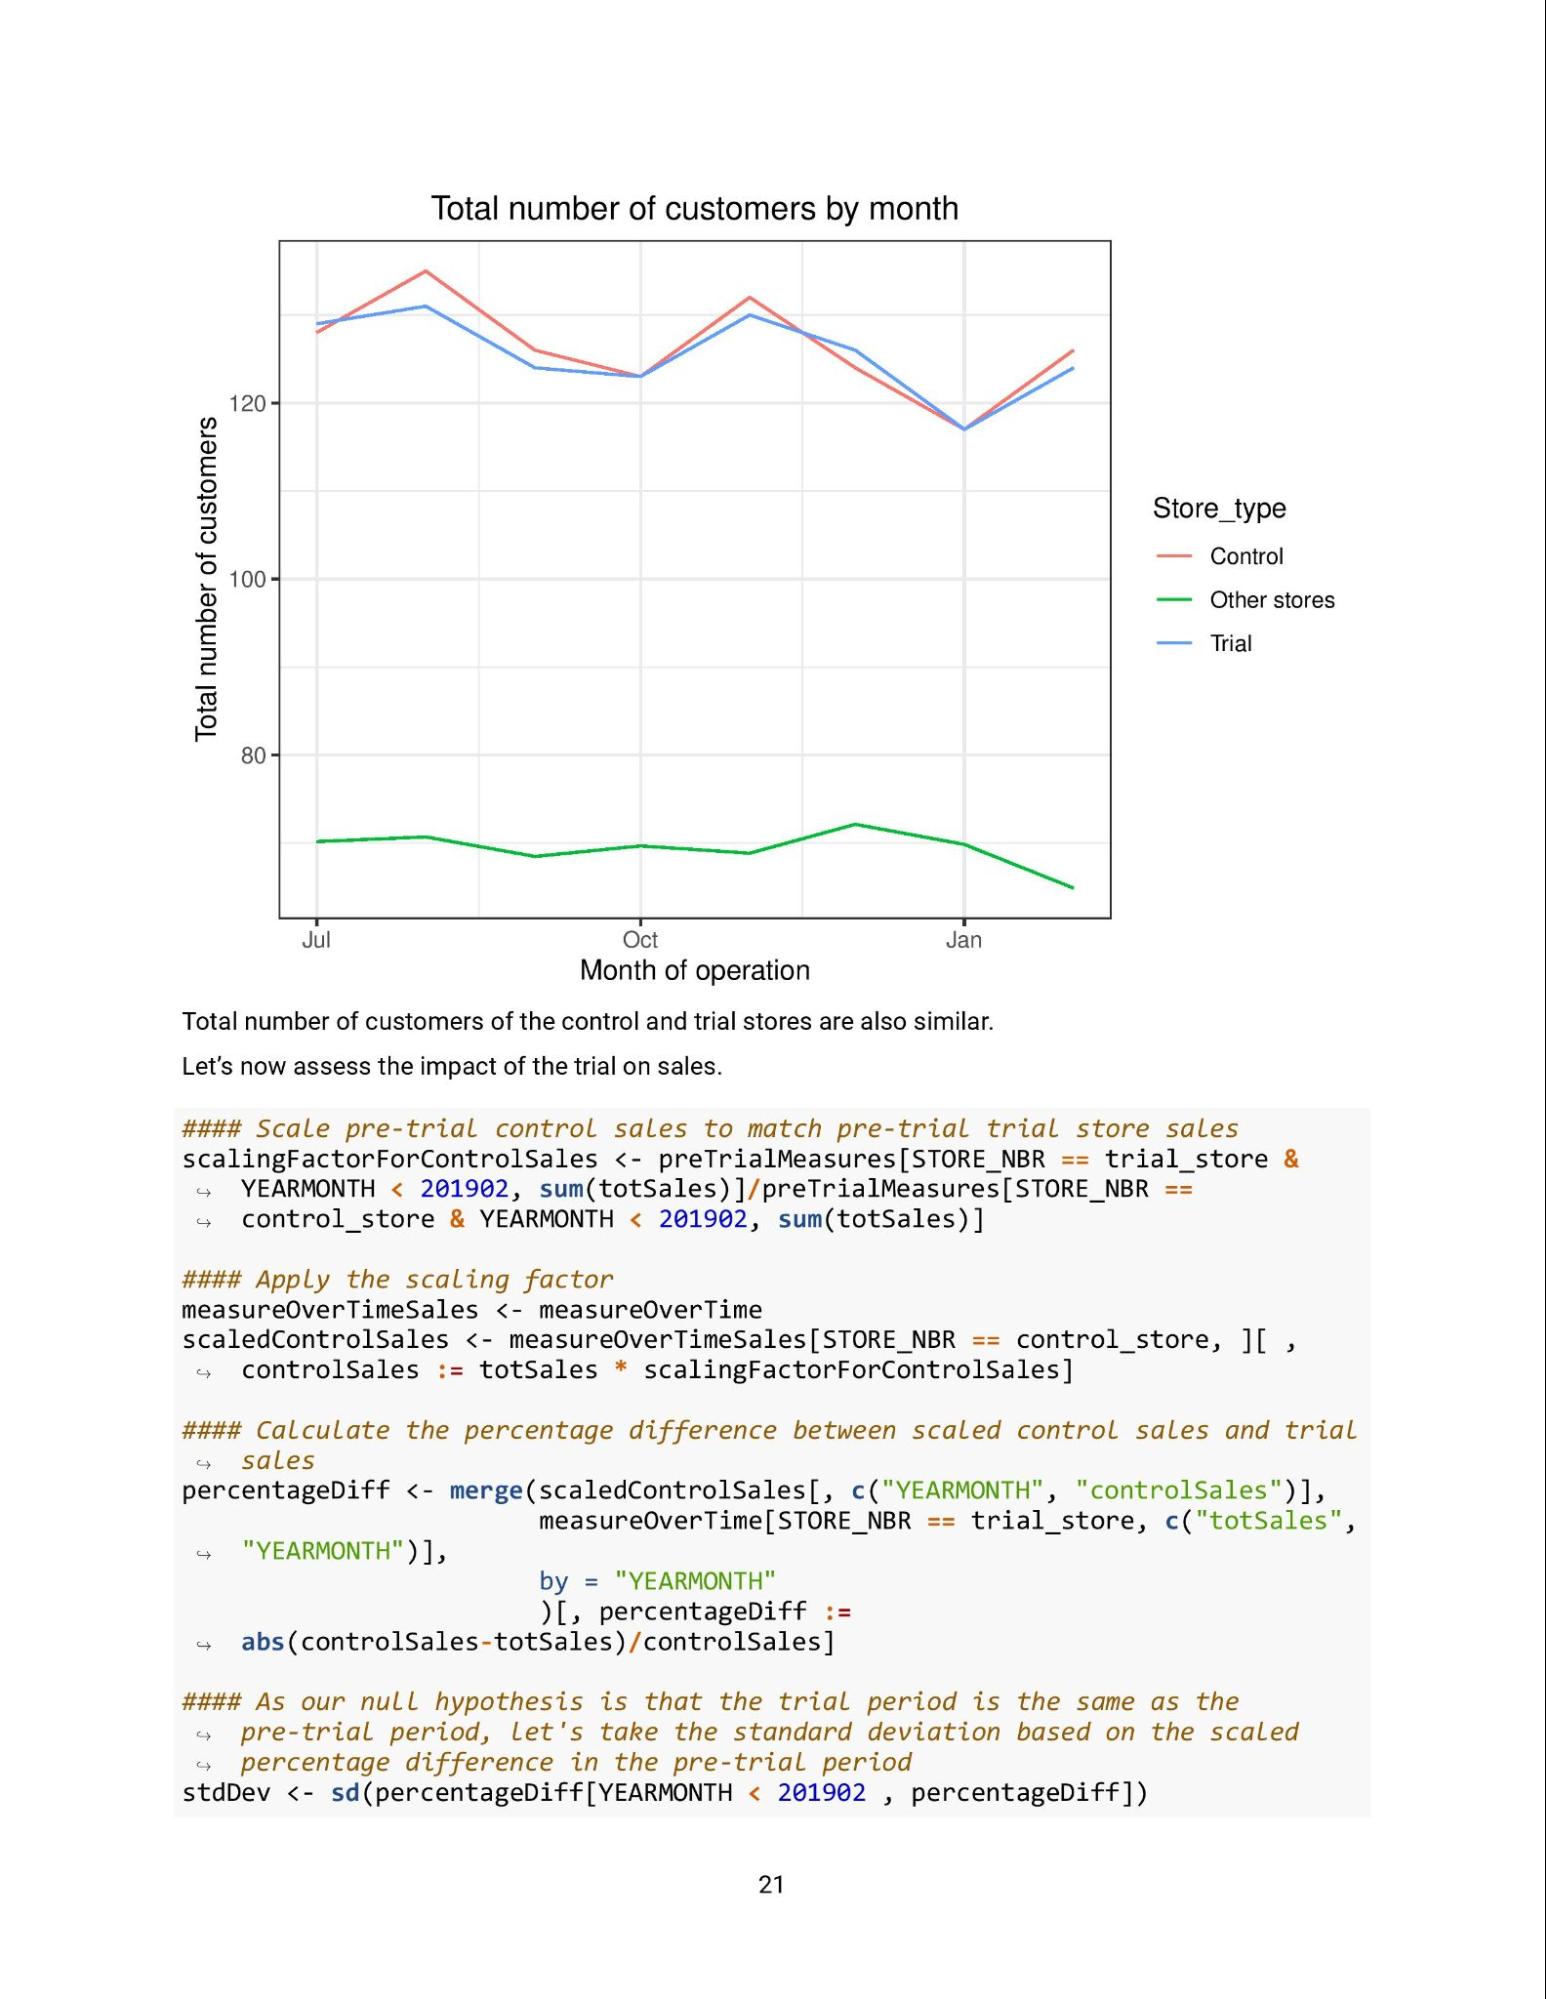
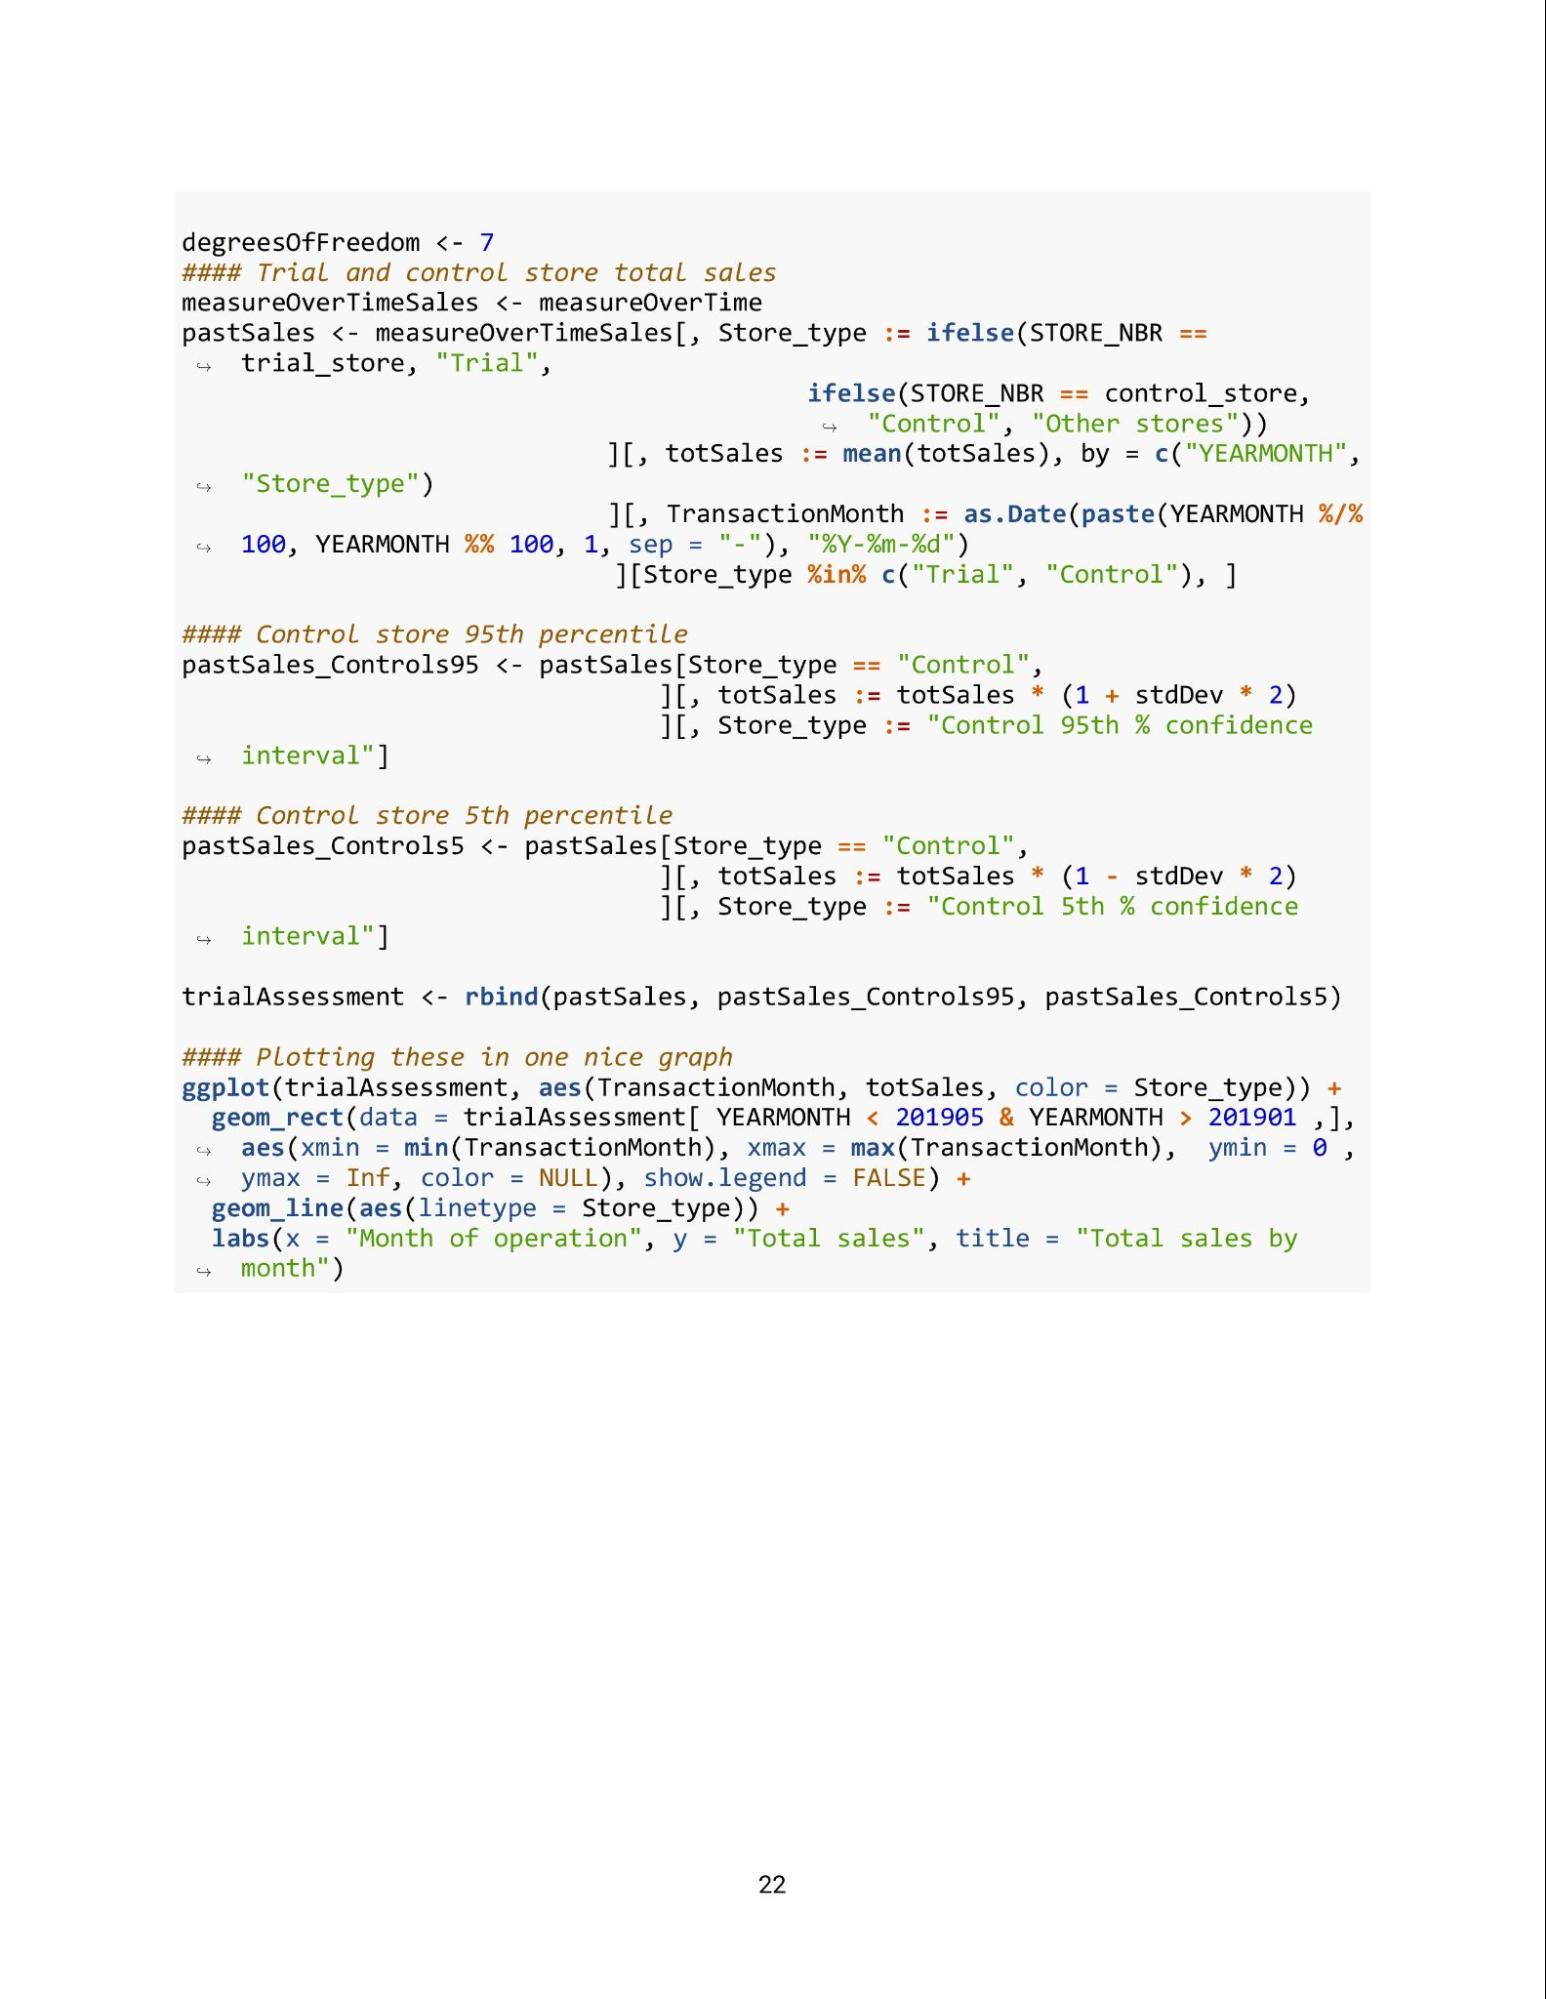
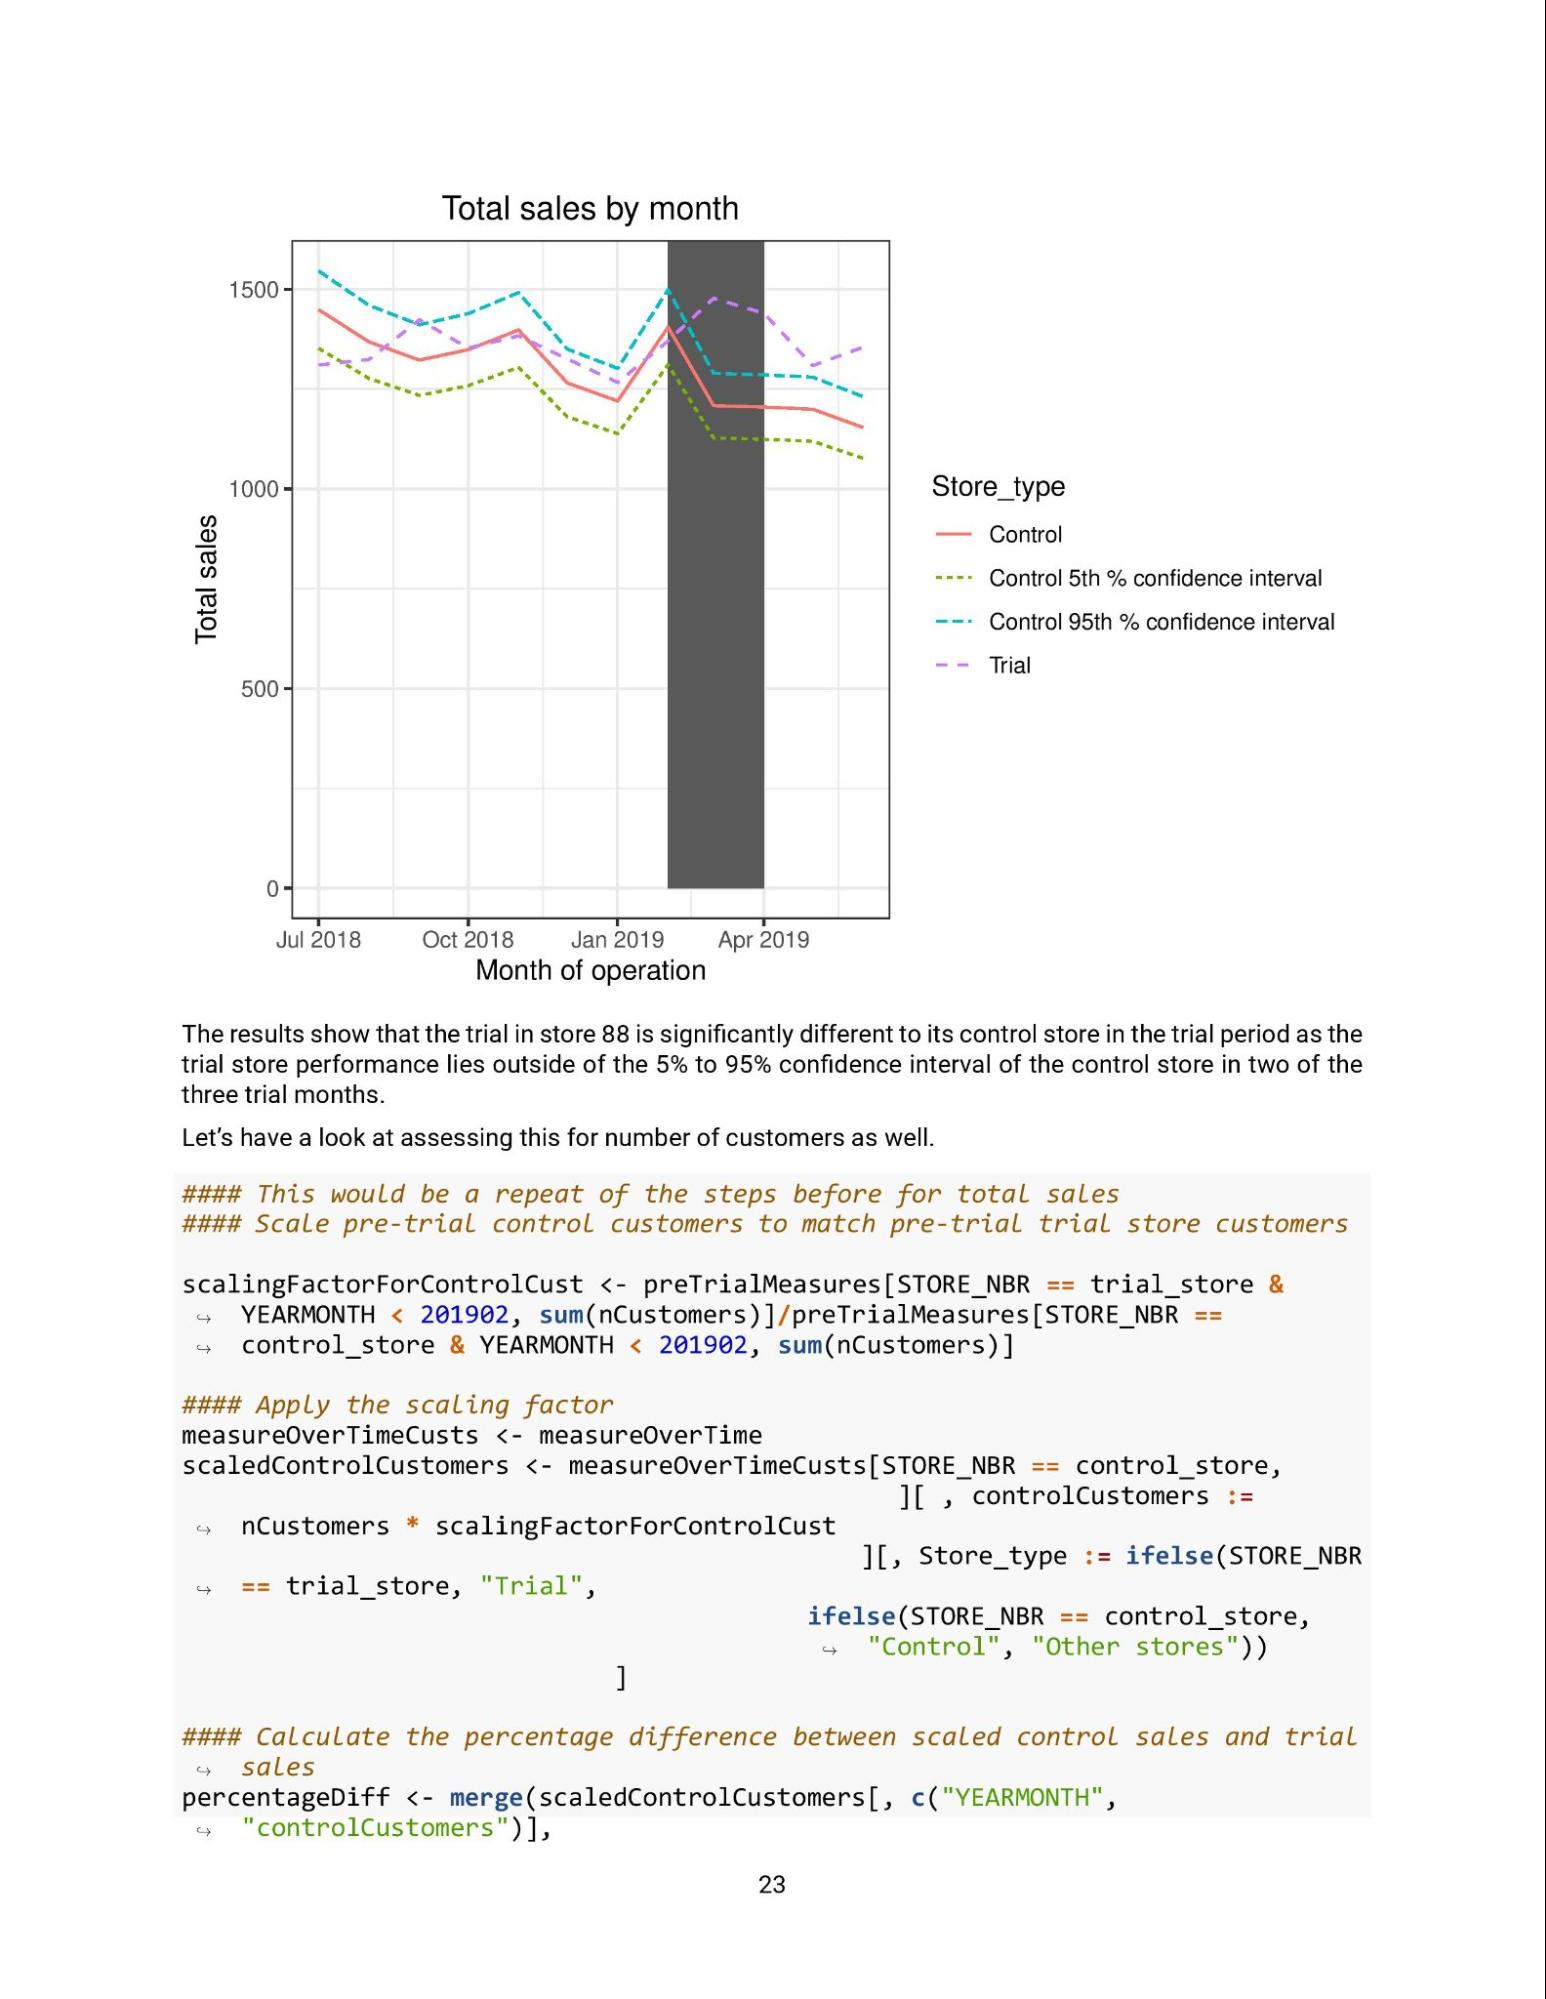
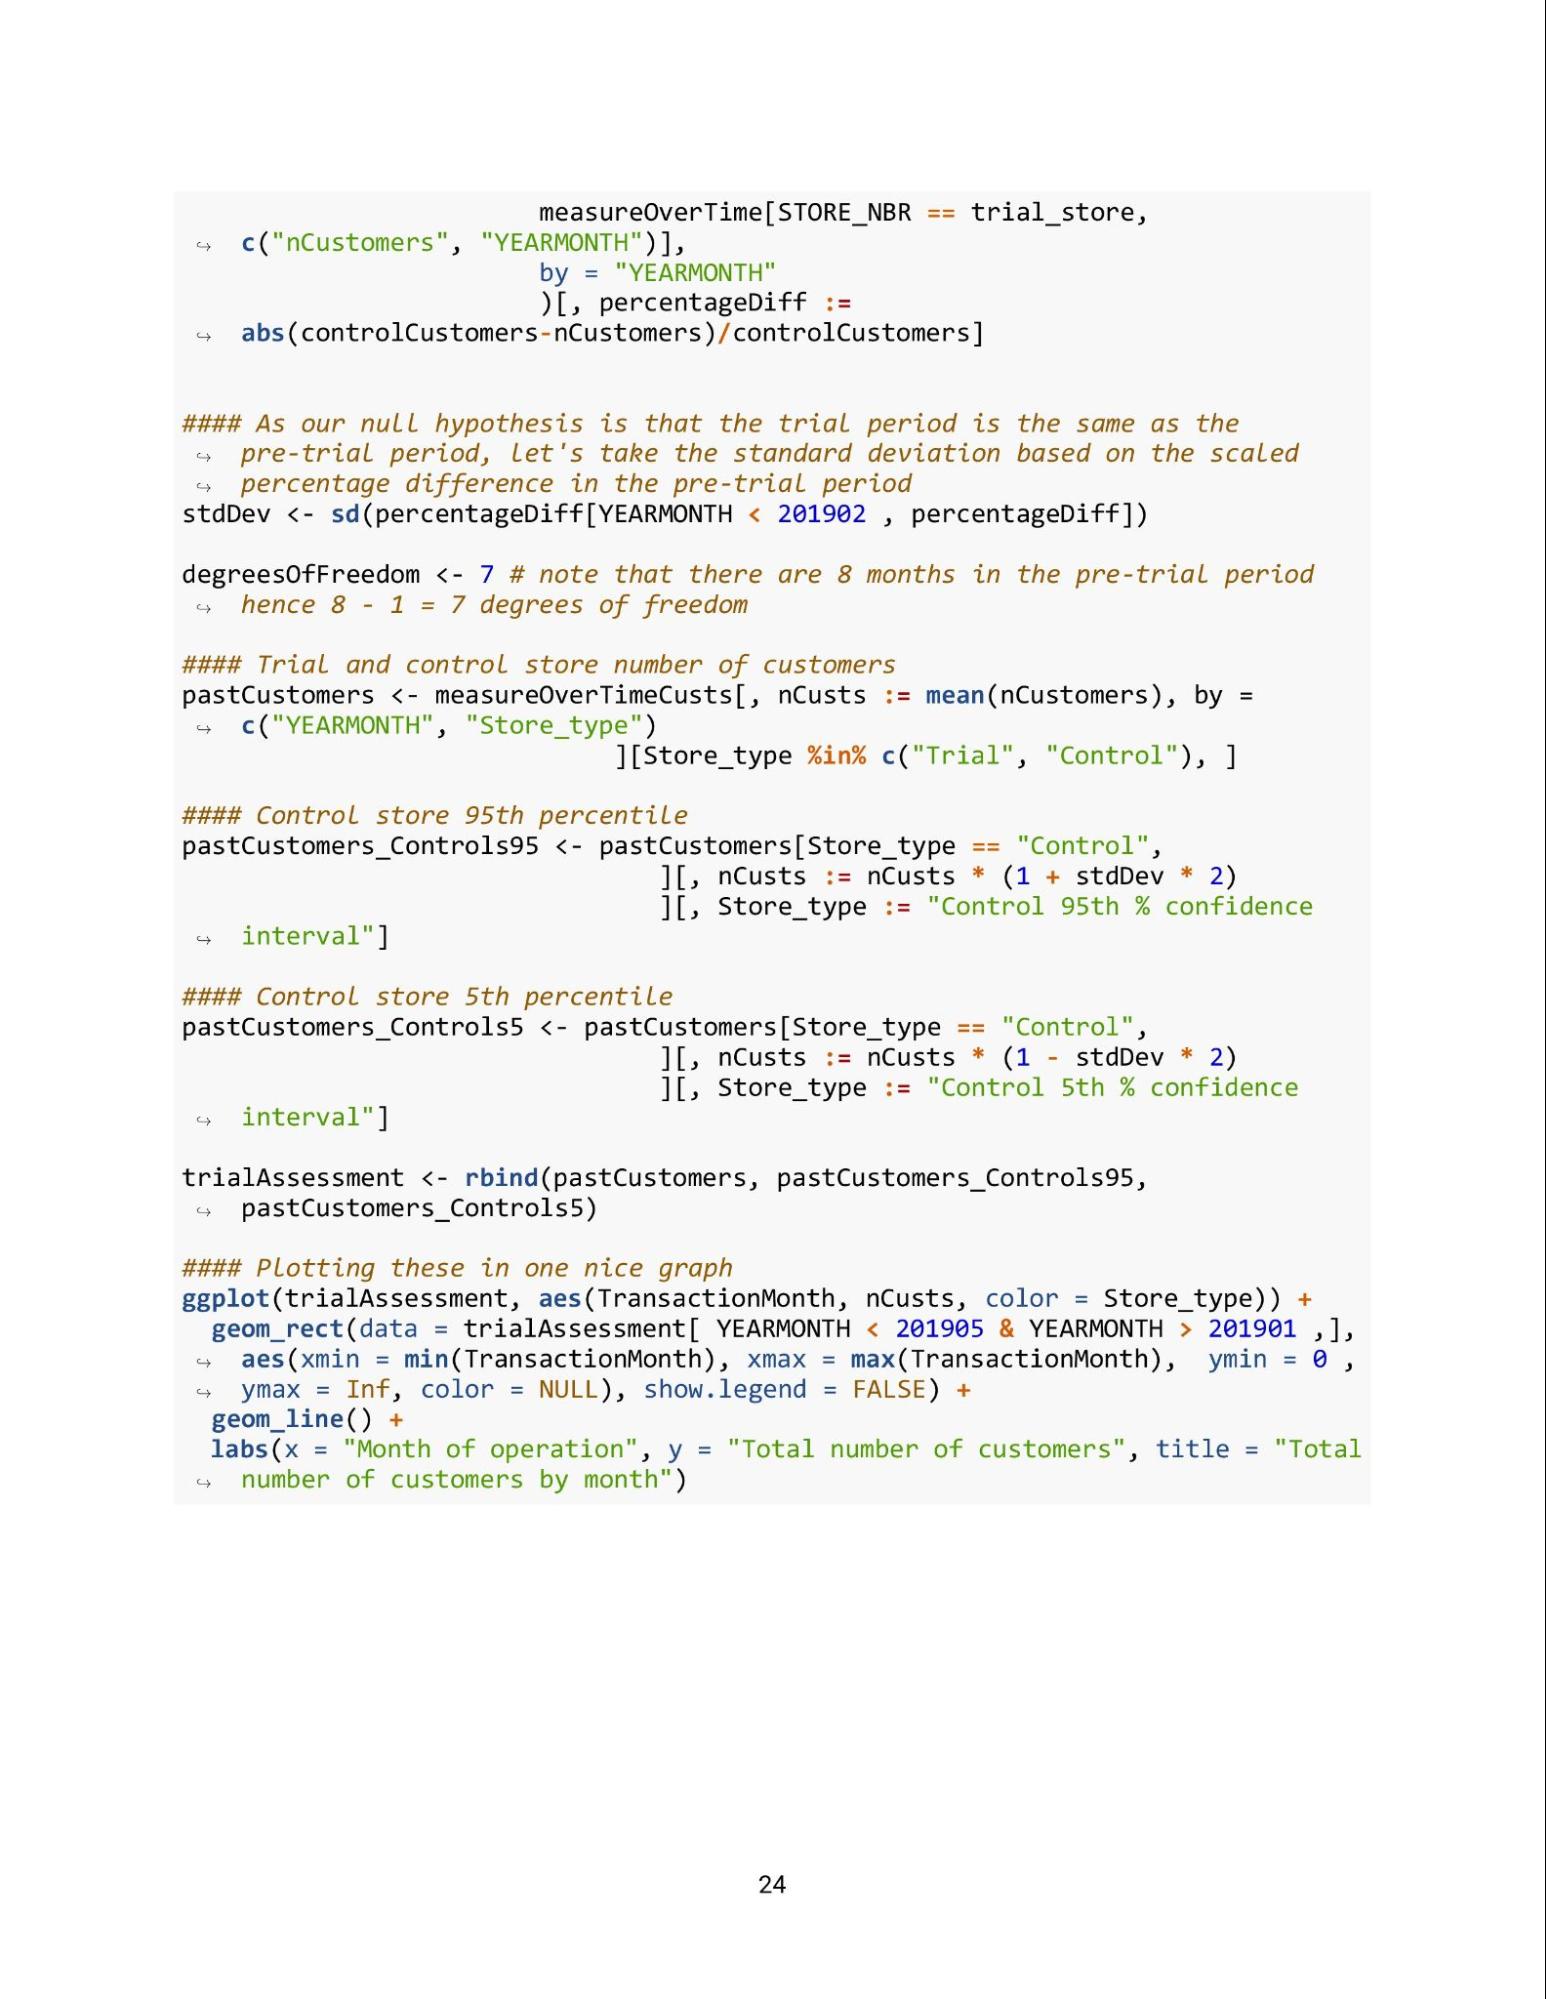
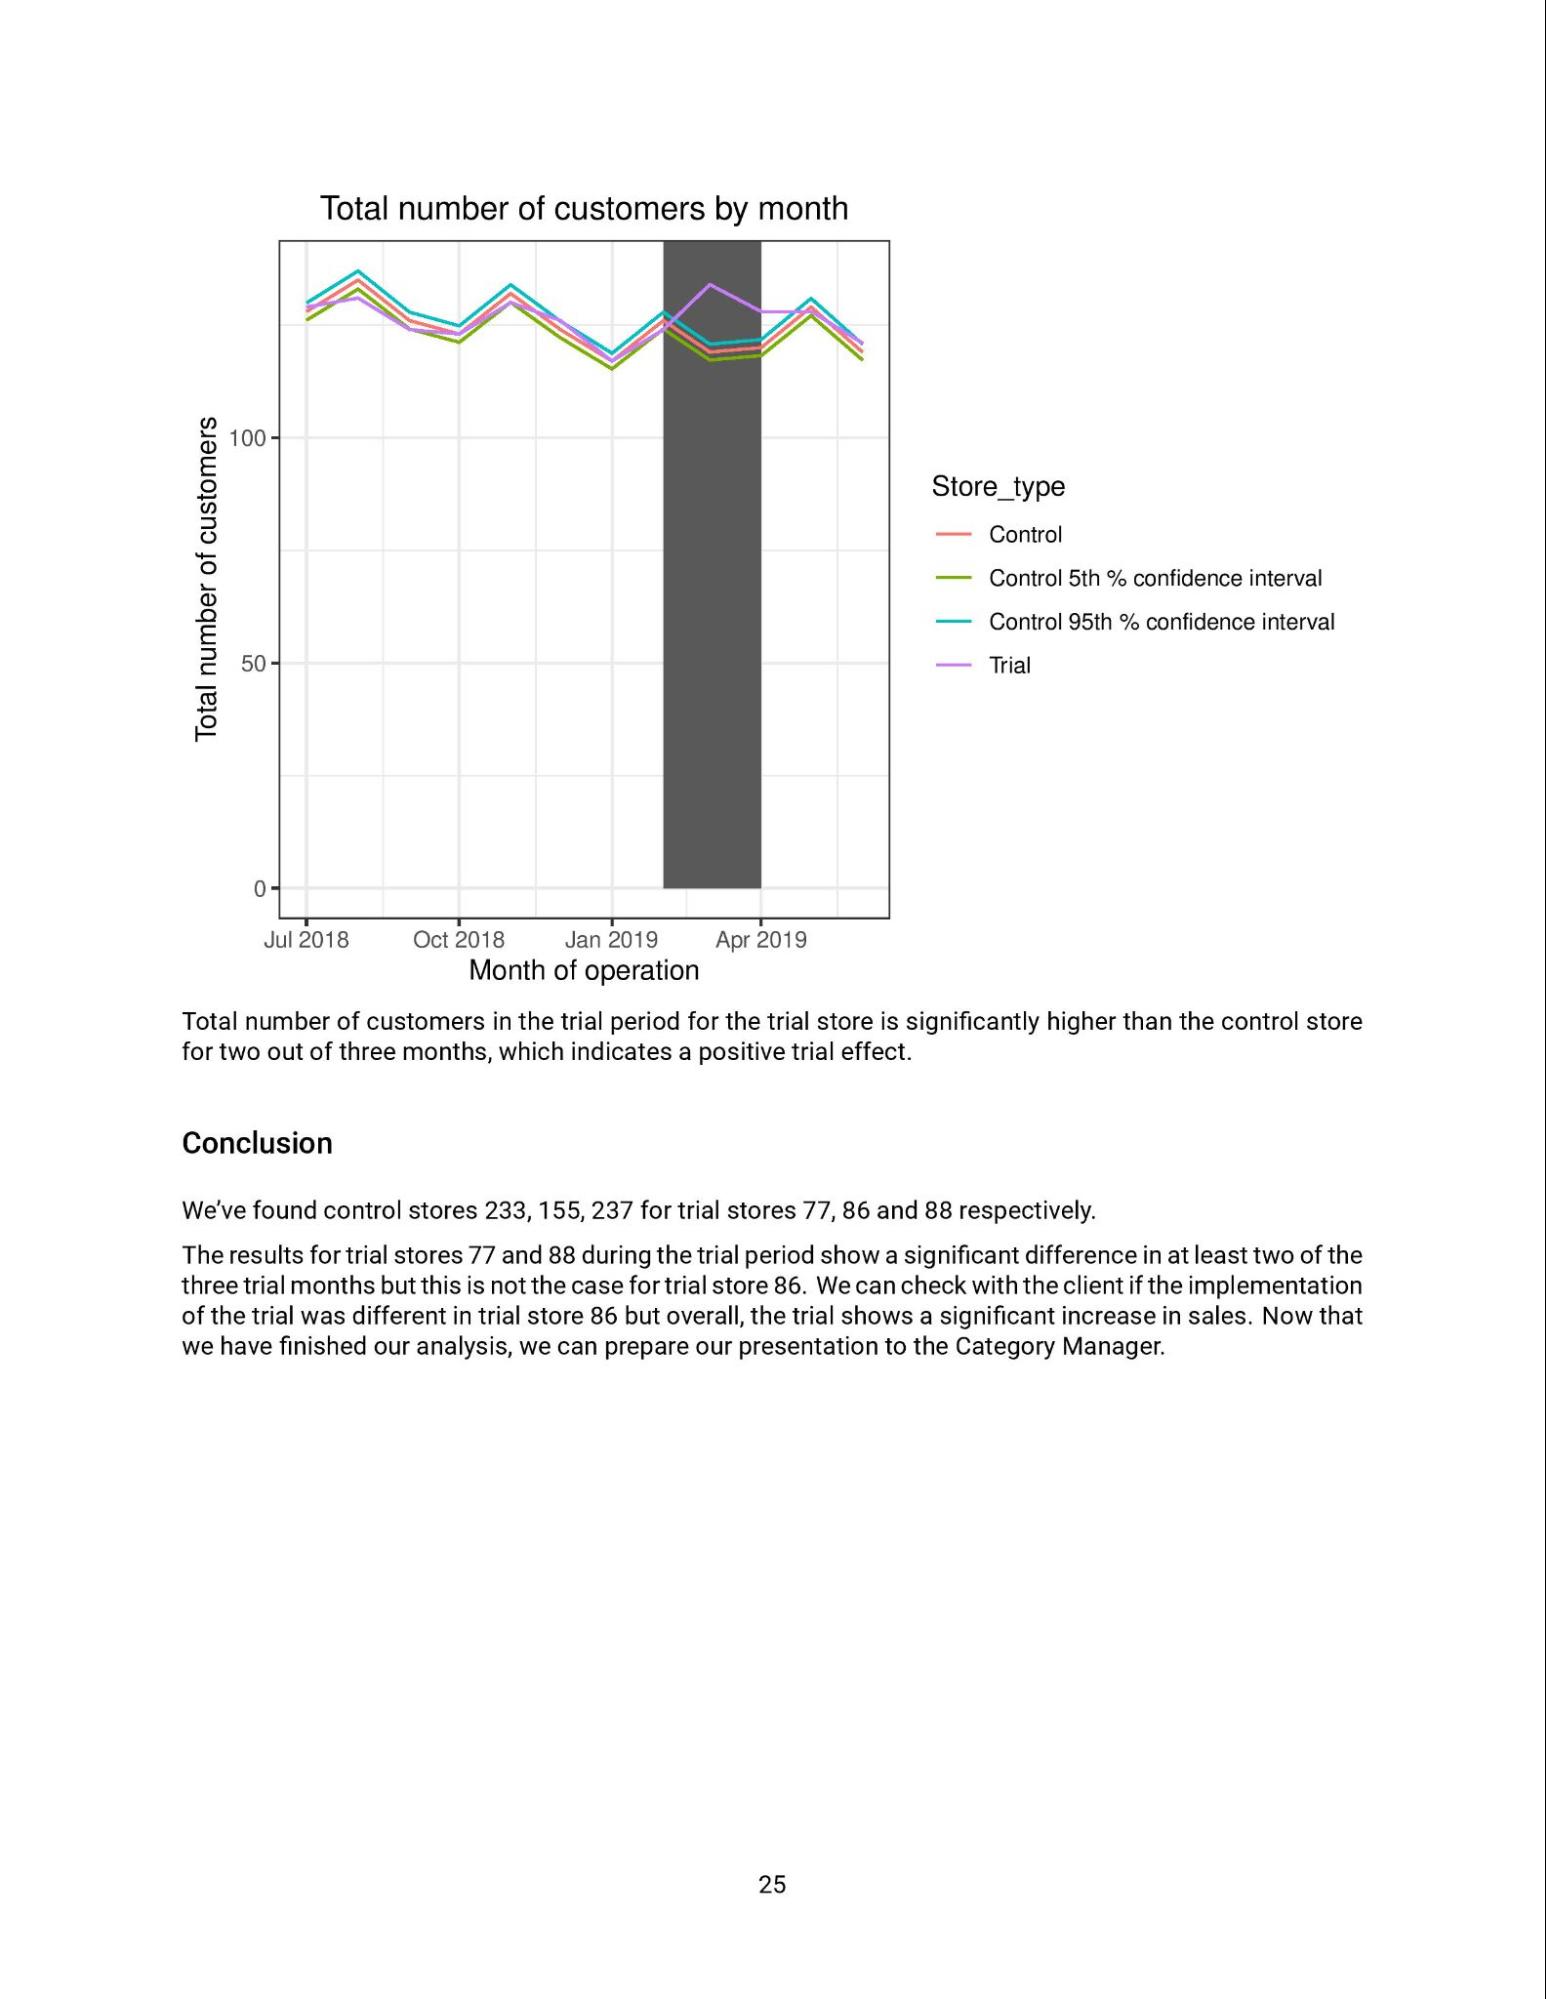
Once you have selected your control stores, compare each trial and control pair during the trial period. You want to test if total sales are significantly different in the trial period and if so, check if the driver of change is more purchasing customers or more purchases per customers etc. As we are in the early stages of this analysis Zilinka has asked us to submit our initial findings, so please save your code as a .pdf file and upload it to unlock the example answer. Here are some resources to help youThis file should be transferred to an R Markup (.Rmd) Pro analytics Tip: While the data set would not normally be considered large some operations may still take some time to run. This is normal and to be expected when dealing with data sets at Quantium. Whilst your analysis is based on the whole data set you may want to try some strategies to try running sample solutions on a smaller subset of data I.e. create a sample solution using some of the data while it uploads. We think you've got everything you need for this task but if you're stuck and want a hand, drop us an email at admin@insidesherpa.com mentioning this task. To evaluate the performance of the store trials (Stores 77, 86, and 88), we will follow these steps in R: Step 1: Load and Inspect the Data
CodeR Copy code # Load necessary libraries library(tidyverse) library(lubridate) # Load the data qvi_data <- read.csv("QVI_data.csv") # Preview the data glimpse(qvi_data) summary(qvi_data) Step 2: Define MetricsFor each store, compute:
CodeR Copy code # Convert DATE to datetime format qvi_data$DATE <- as.Date(qvi_data$DATE, format = "%Y-%m-%d") # Monthly metrics calculation store_metrics <- qvi_data %>% group_by(STORE, month = floor_date(DATE, "month")) %>% summarise( total_sales = sum(TOT_SALES, na.rm = TRUE), total_customers = n_distinct(CUSTOMER_ID), avg_transactions_per_customer = n() / n_distinct(CUSTOMER_ID) ) Step 3: Control Store Selection
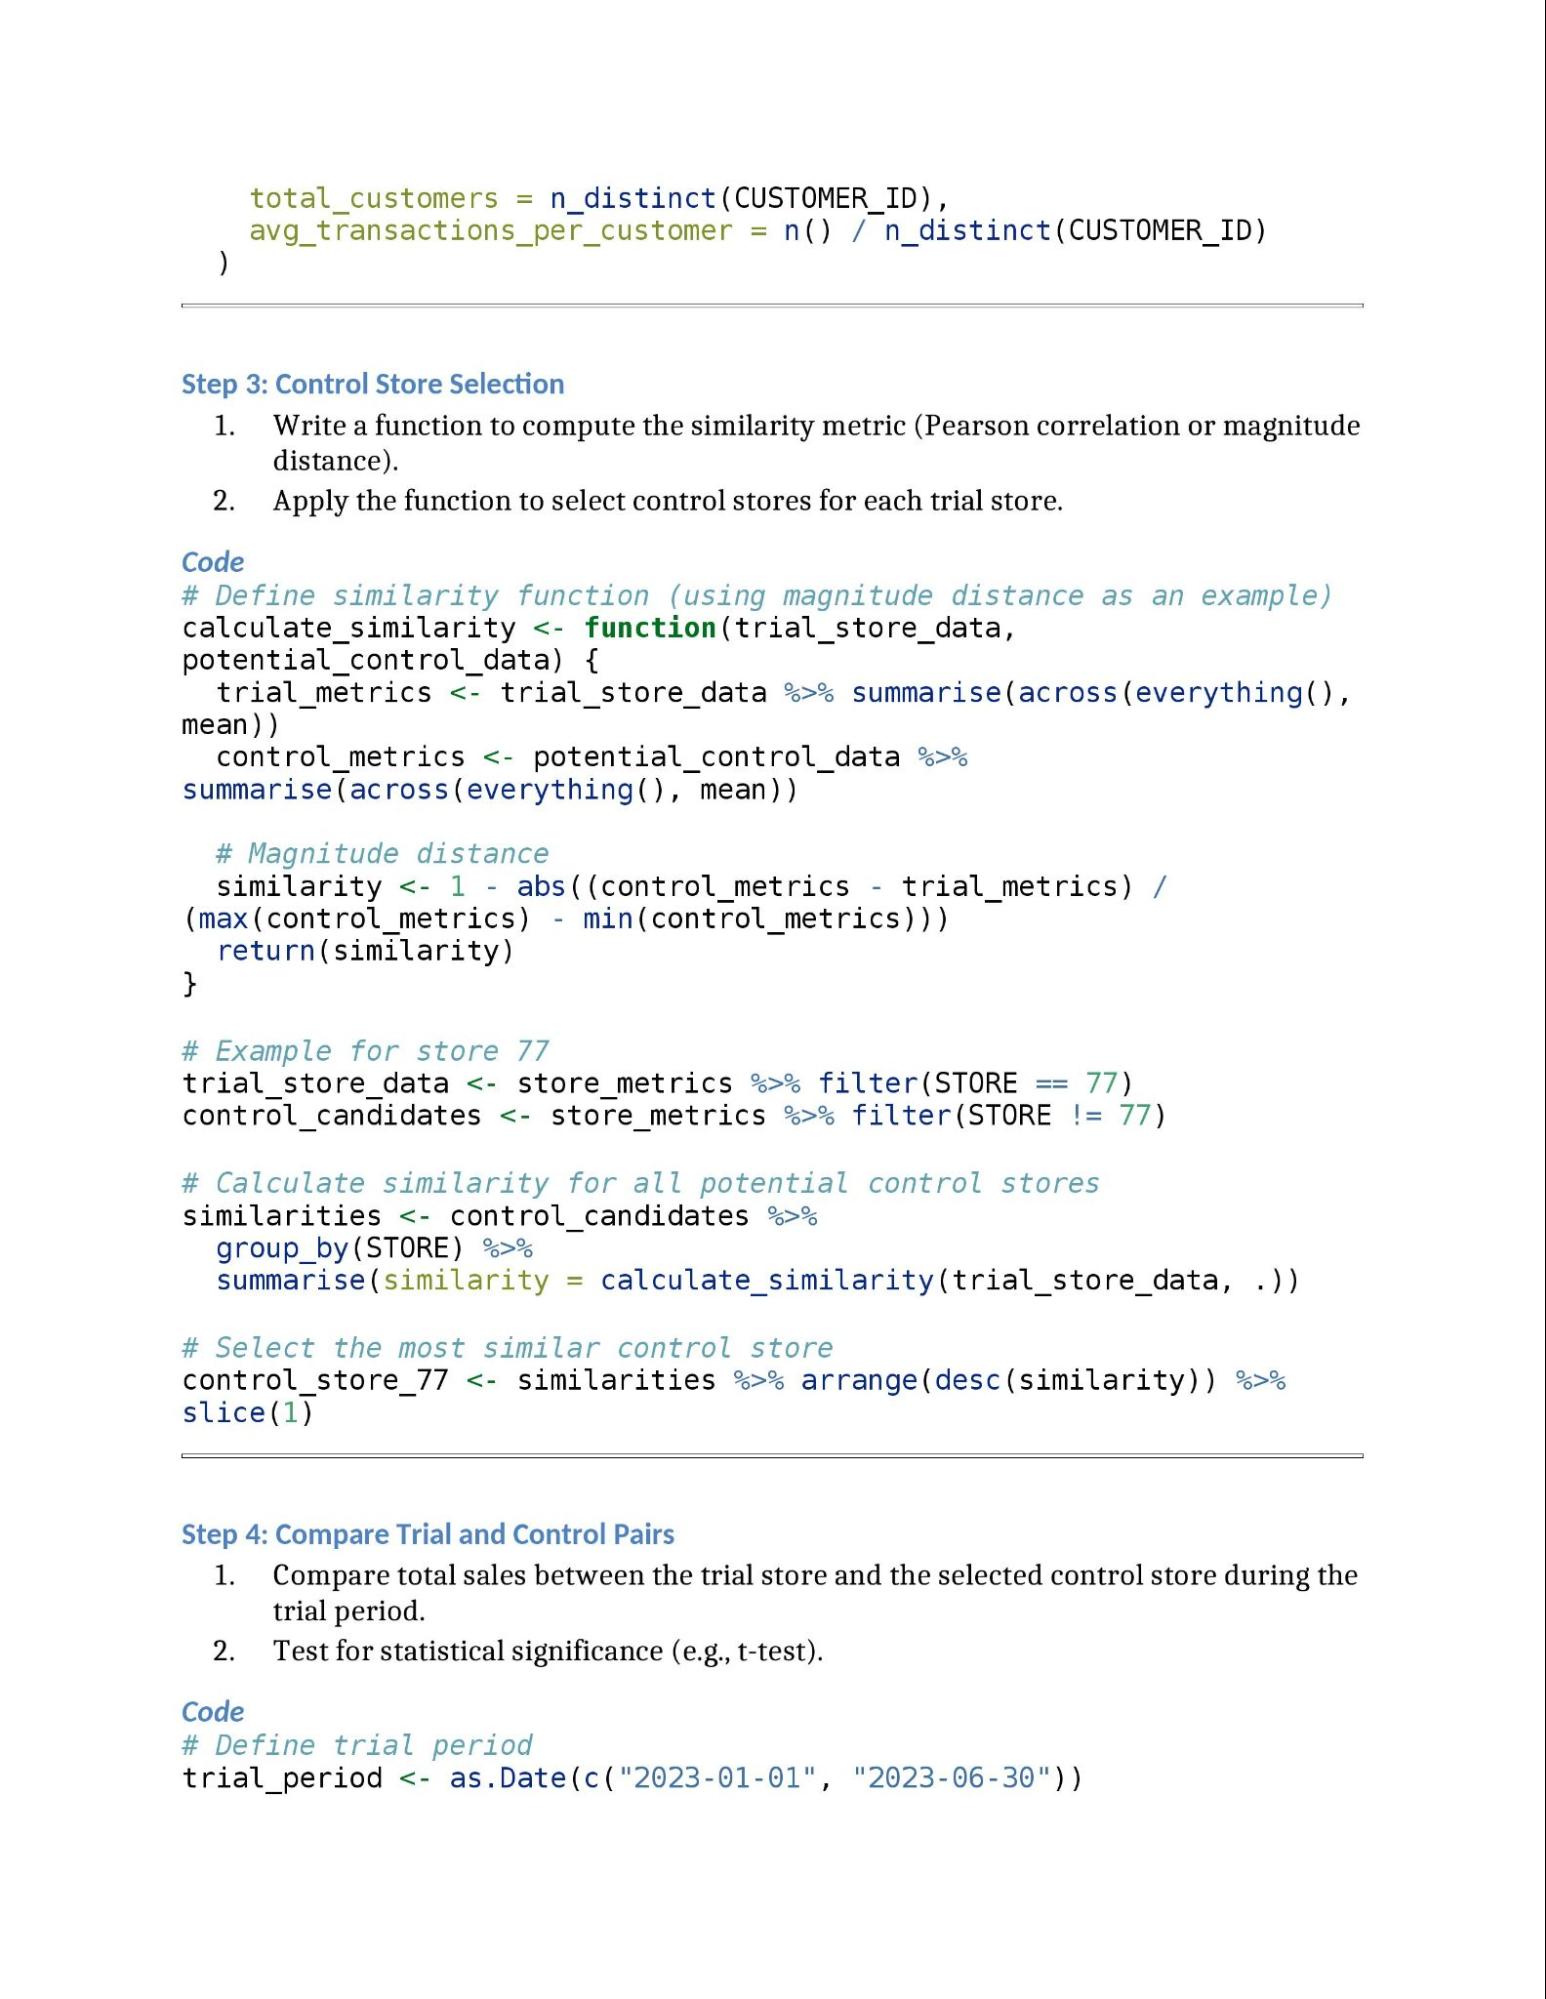
CodeR Copy code # Define similarity function (using magnitude distance as an example) calculate_similarity <- function(trial_store_data, potential_control_data) { trial_metrics <- trial_store_data %>% summarise(across(everything(), mean)) control_metrics <- potential_control_data %>% summarise(across(everything(), mean))
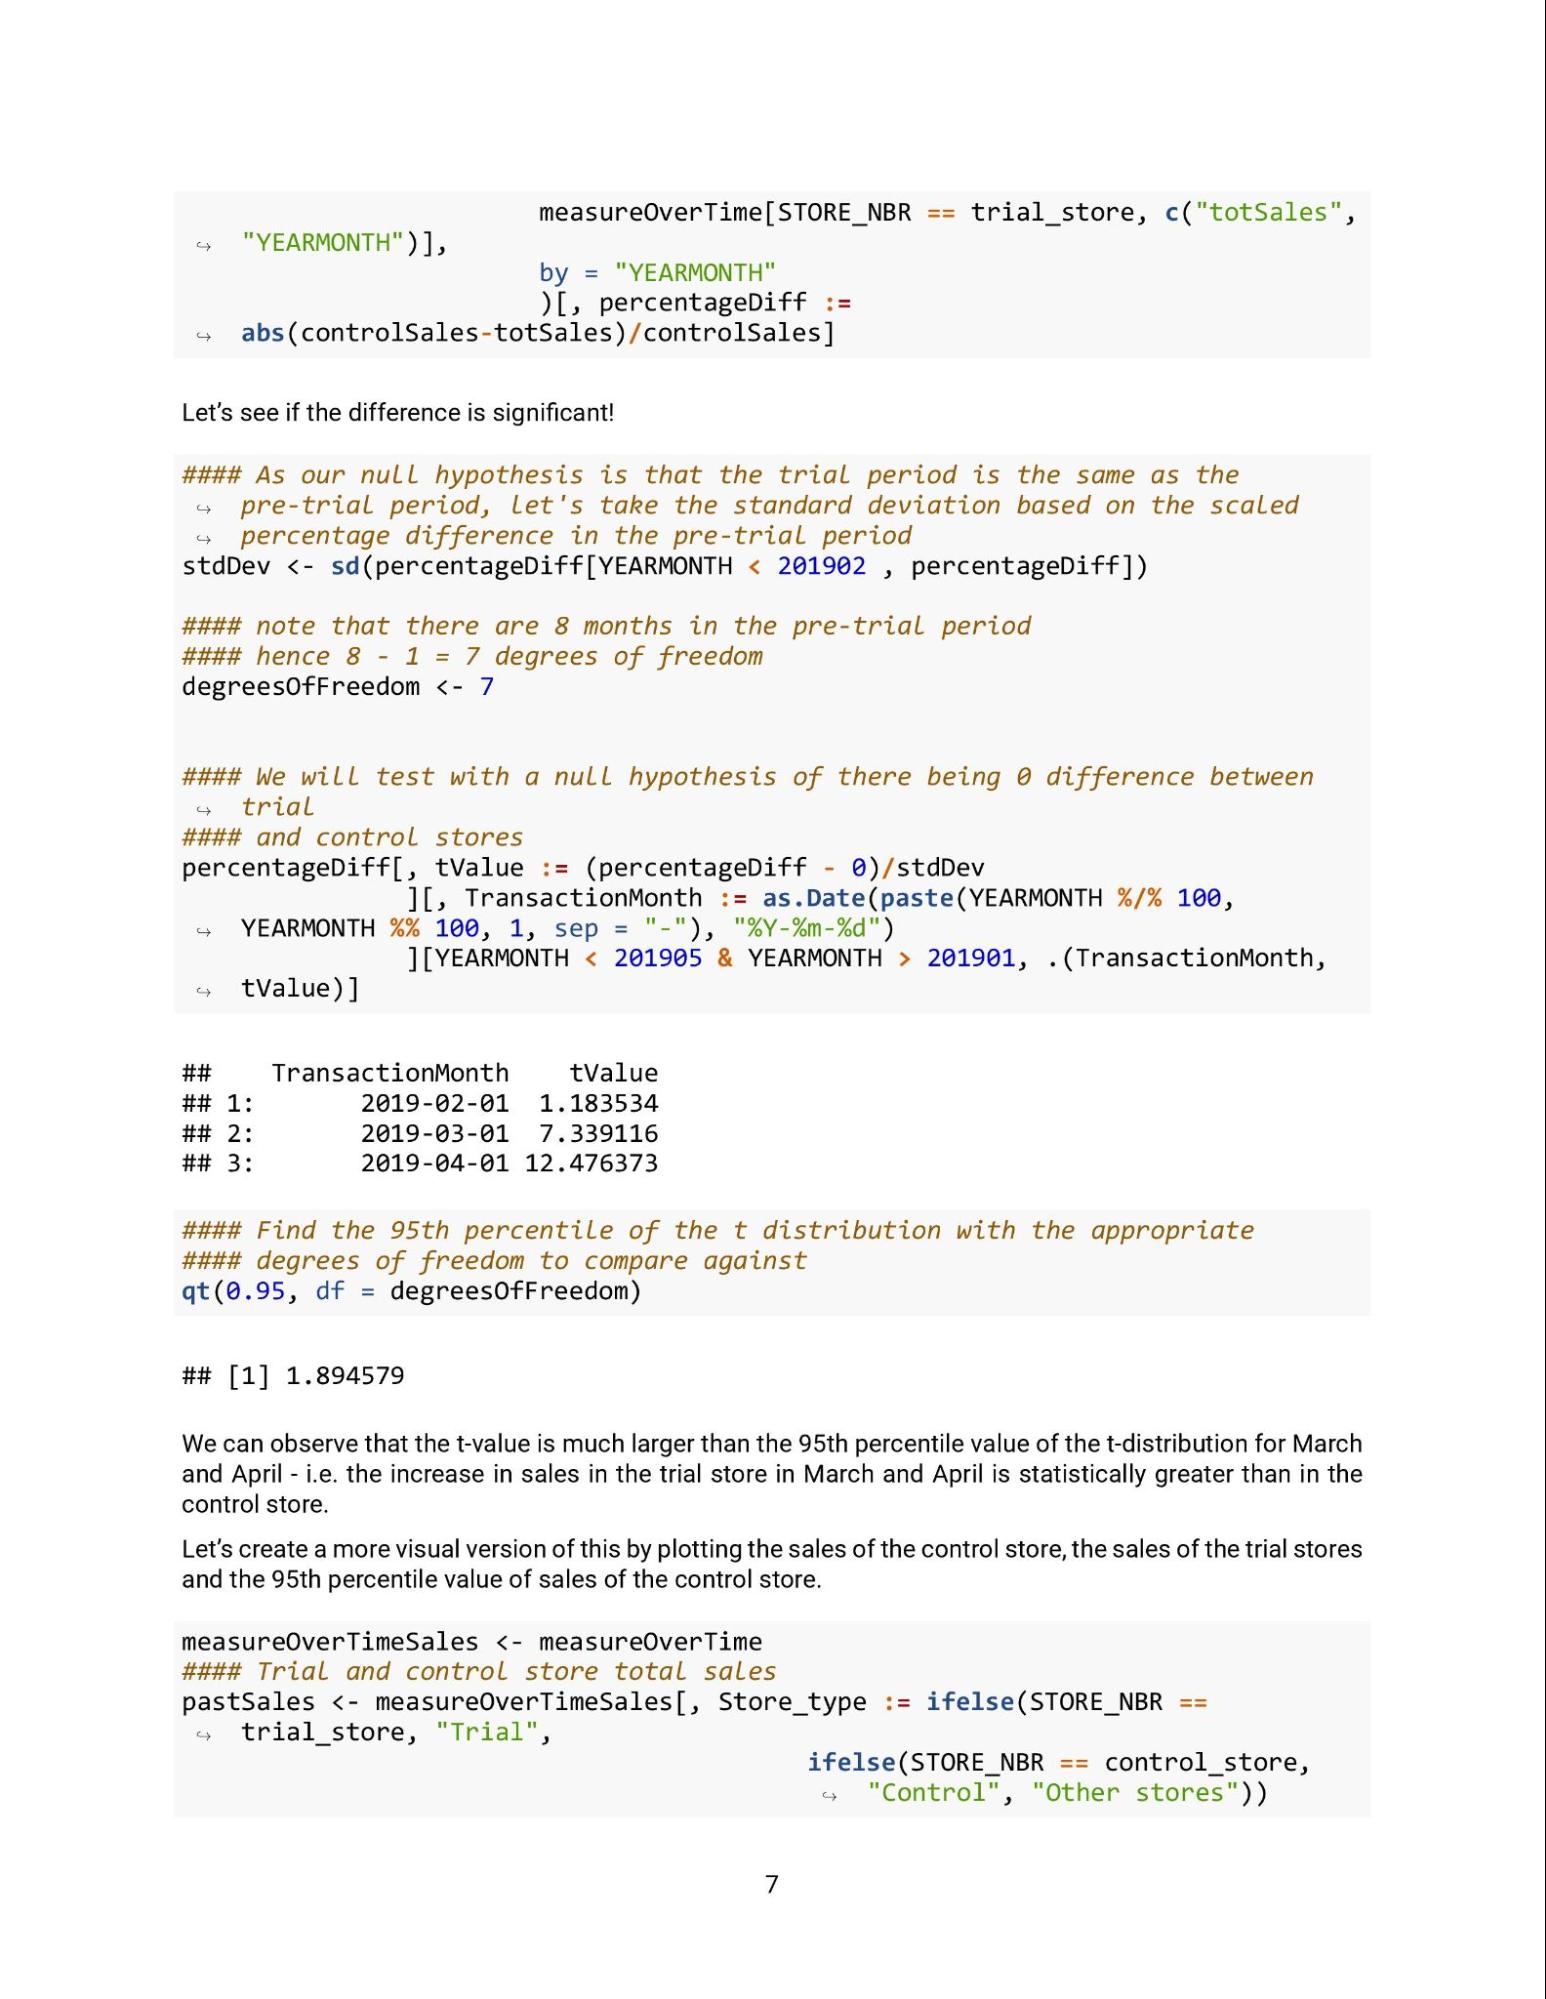
# Magnitude distance similarity <- 1 - abs((control_metrics - trial_metrics) / (max(control_metrics) - min(control_metrics))) return(similarity) } # Example for store 77 trial_store_data <- store_metrics %>% filter(STORE == 77) control_candidates <- store_metrics %>% filter(STORE != 77) # Calculate similarity for all potential control stores similarities <- control_candidates %>% group_by(STORE) %>% summarise(similarity = calculate_similarity(trial_store_data, .)) # Select the most similar control store control_store_77 <- similarities %>% arrange(desc(similarity)) %>% slice(1) Step 4: Compare Trial and Control Pairs
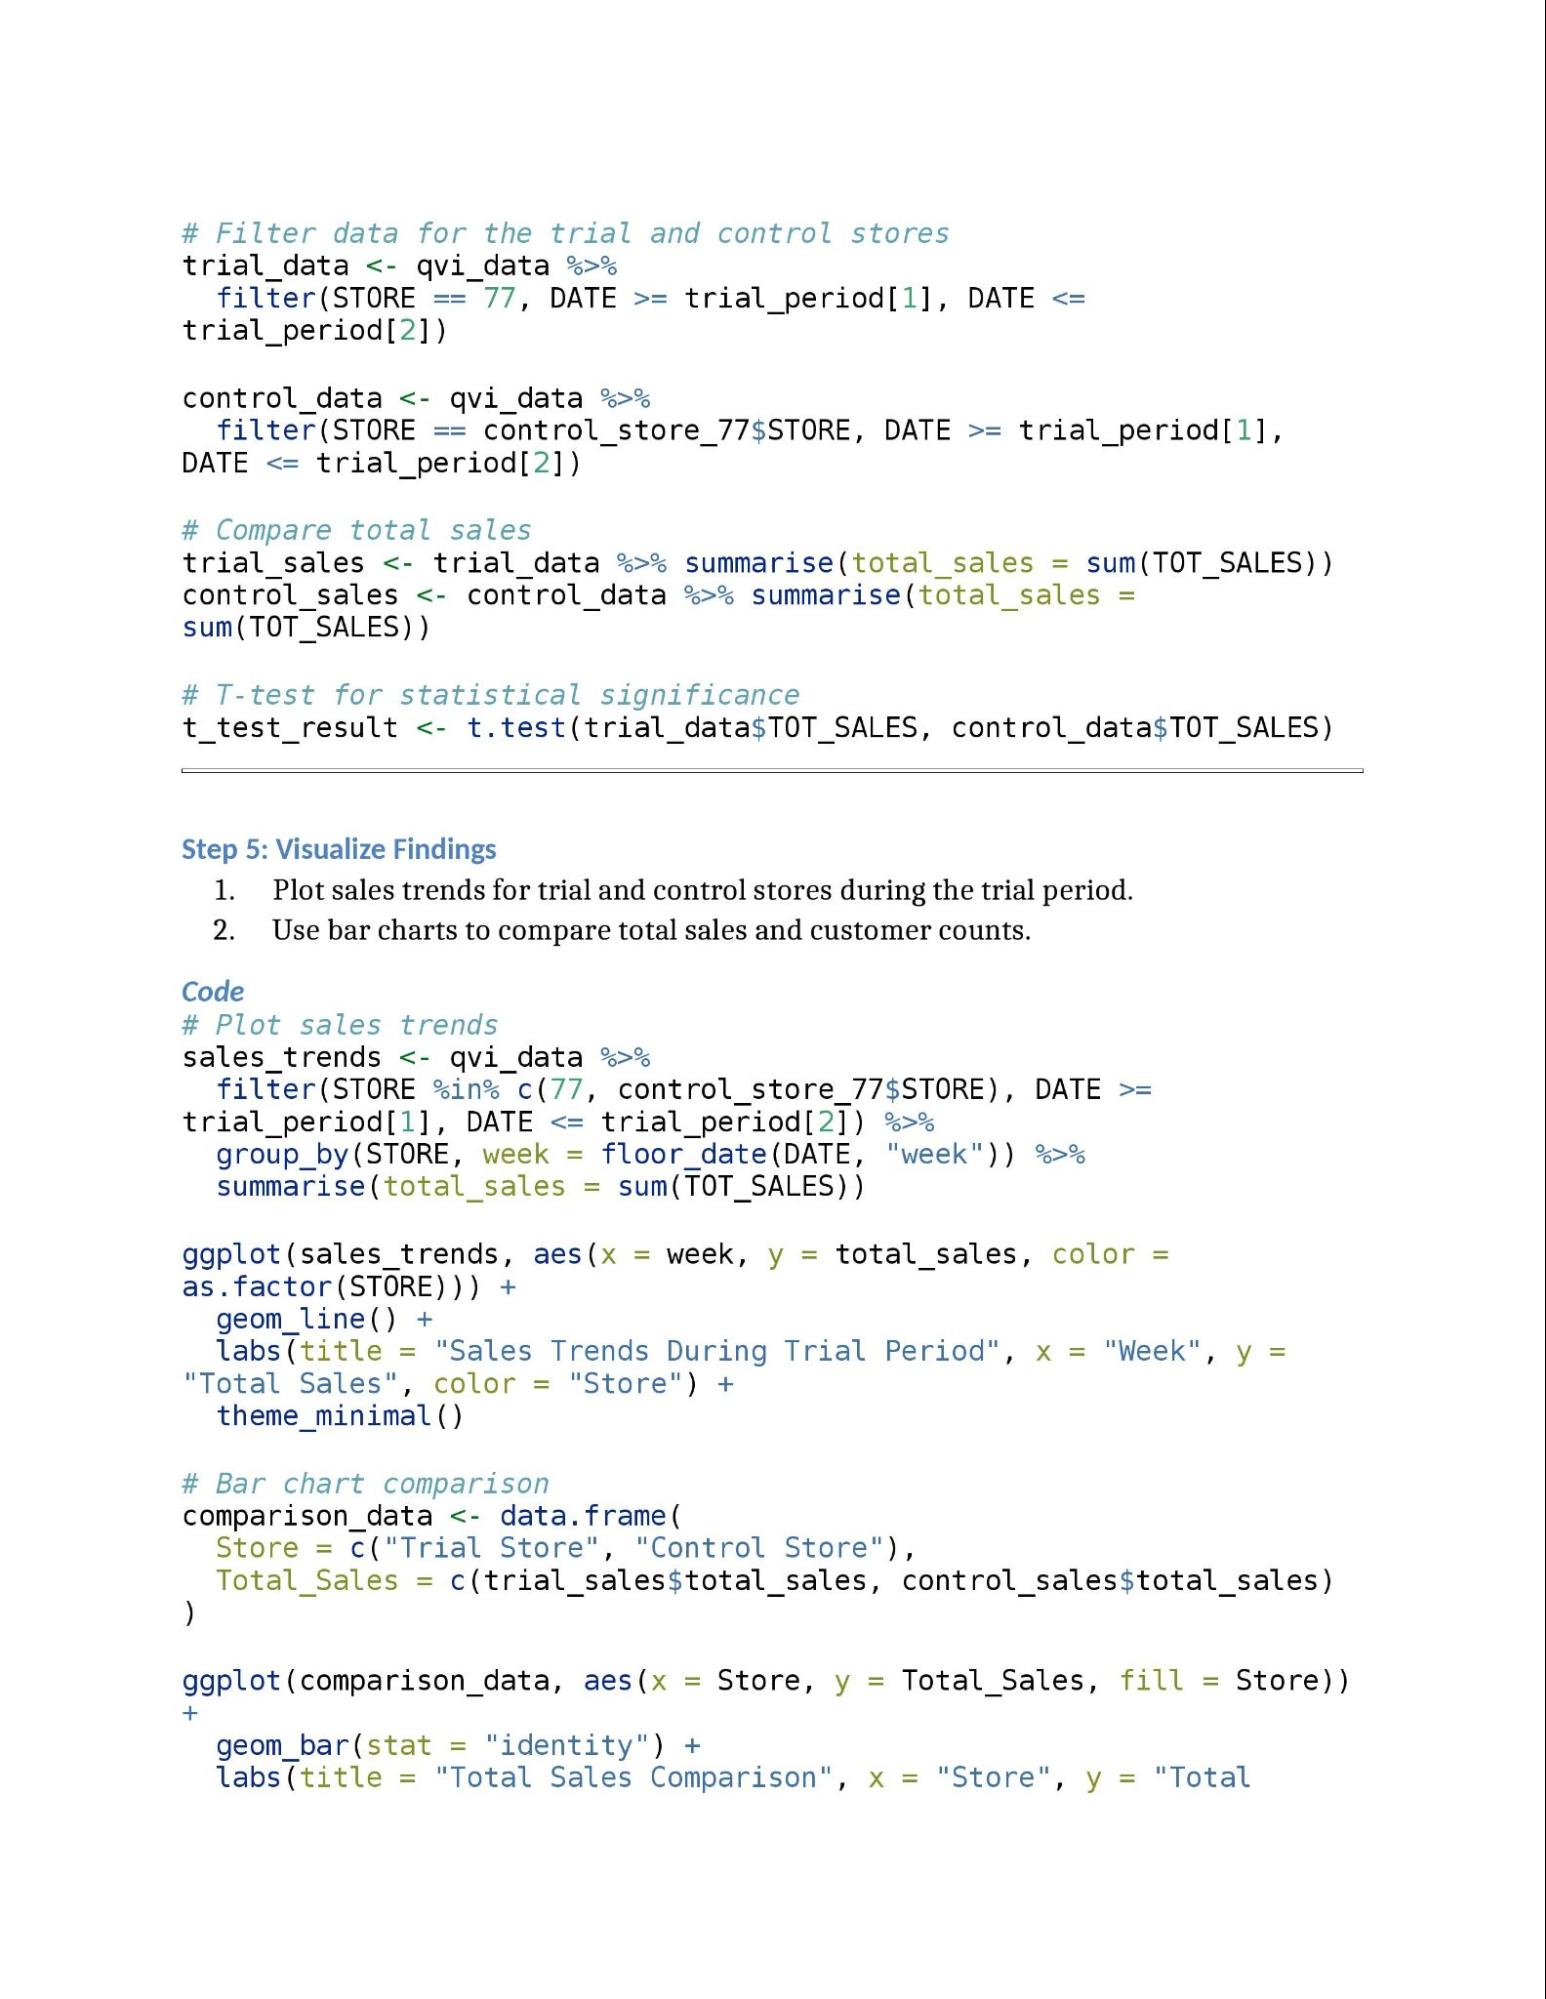
CodeR Copy code # Define trial period trial_period <- as.Date(c("2023-01-01", "2023-06-30")) # Filter data for the trial and control stores trial_data <- qvi_data %>% filter(STORE == 77, DATE >= trial_period[1], DATE <= trial_period[2]) control_data <- qvi_data %>% filter(STORE == control_store_77$STORE, DATE >= trial_period[1], DATE <= trial_period[2]) # Compare total sales trial_sales <- trial_data %>% summarise(total_sales = sum(TOT_SALES)) control_sales <- control_data %>% summarise(total_sales = sum(TOT_SALES)) # T-test for statistical significance t_test_result <- t.test(trial_data$TOT_SALES, control_data$TOT_SALES) Step 5: Visualize Findings
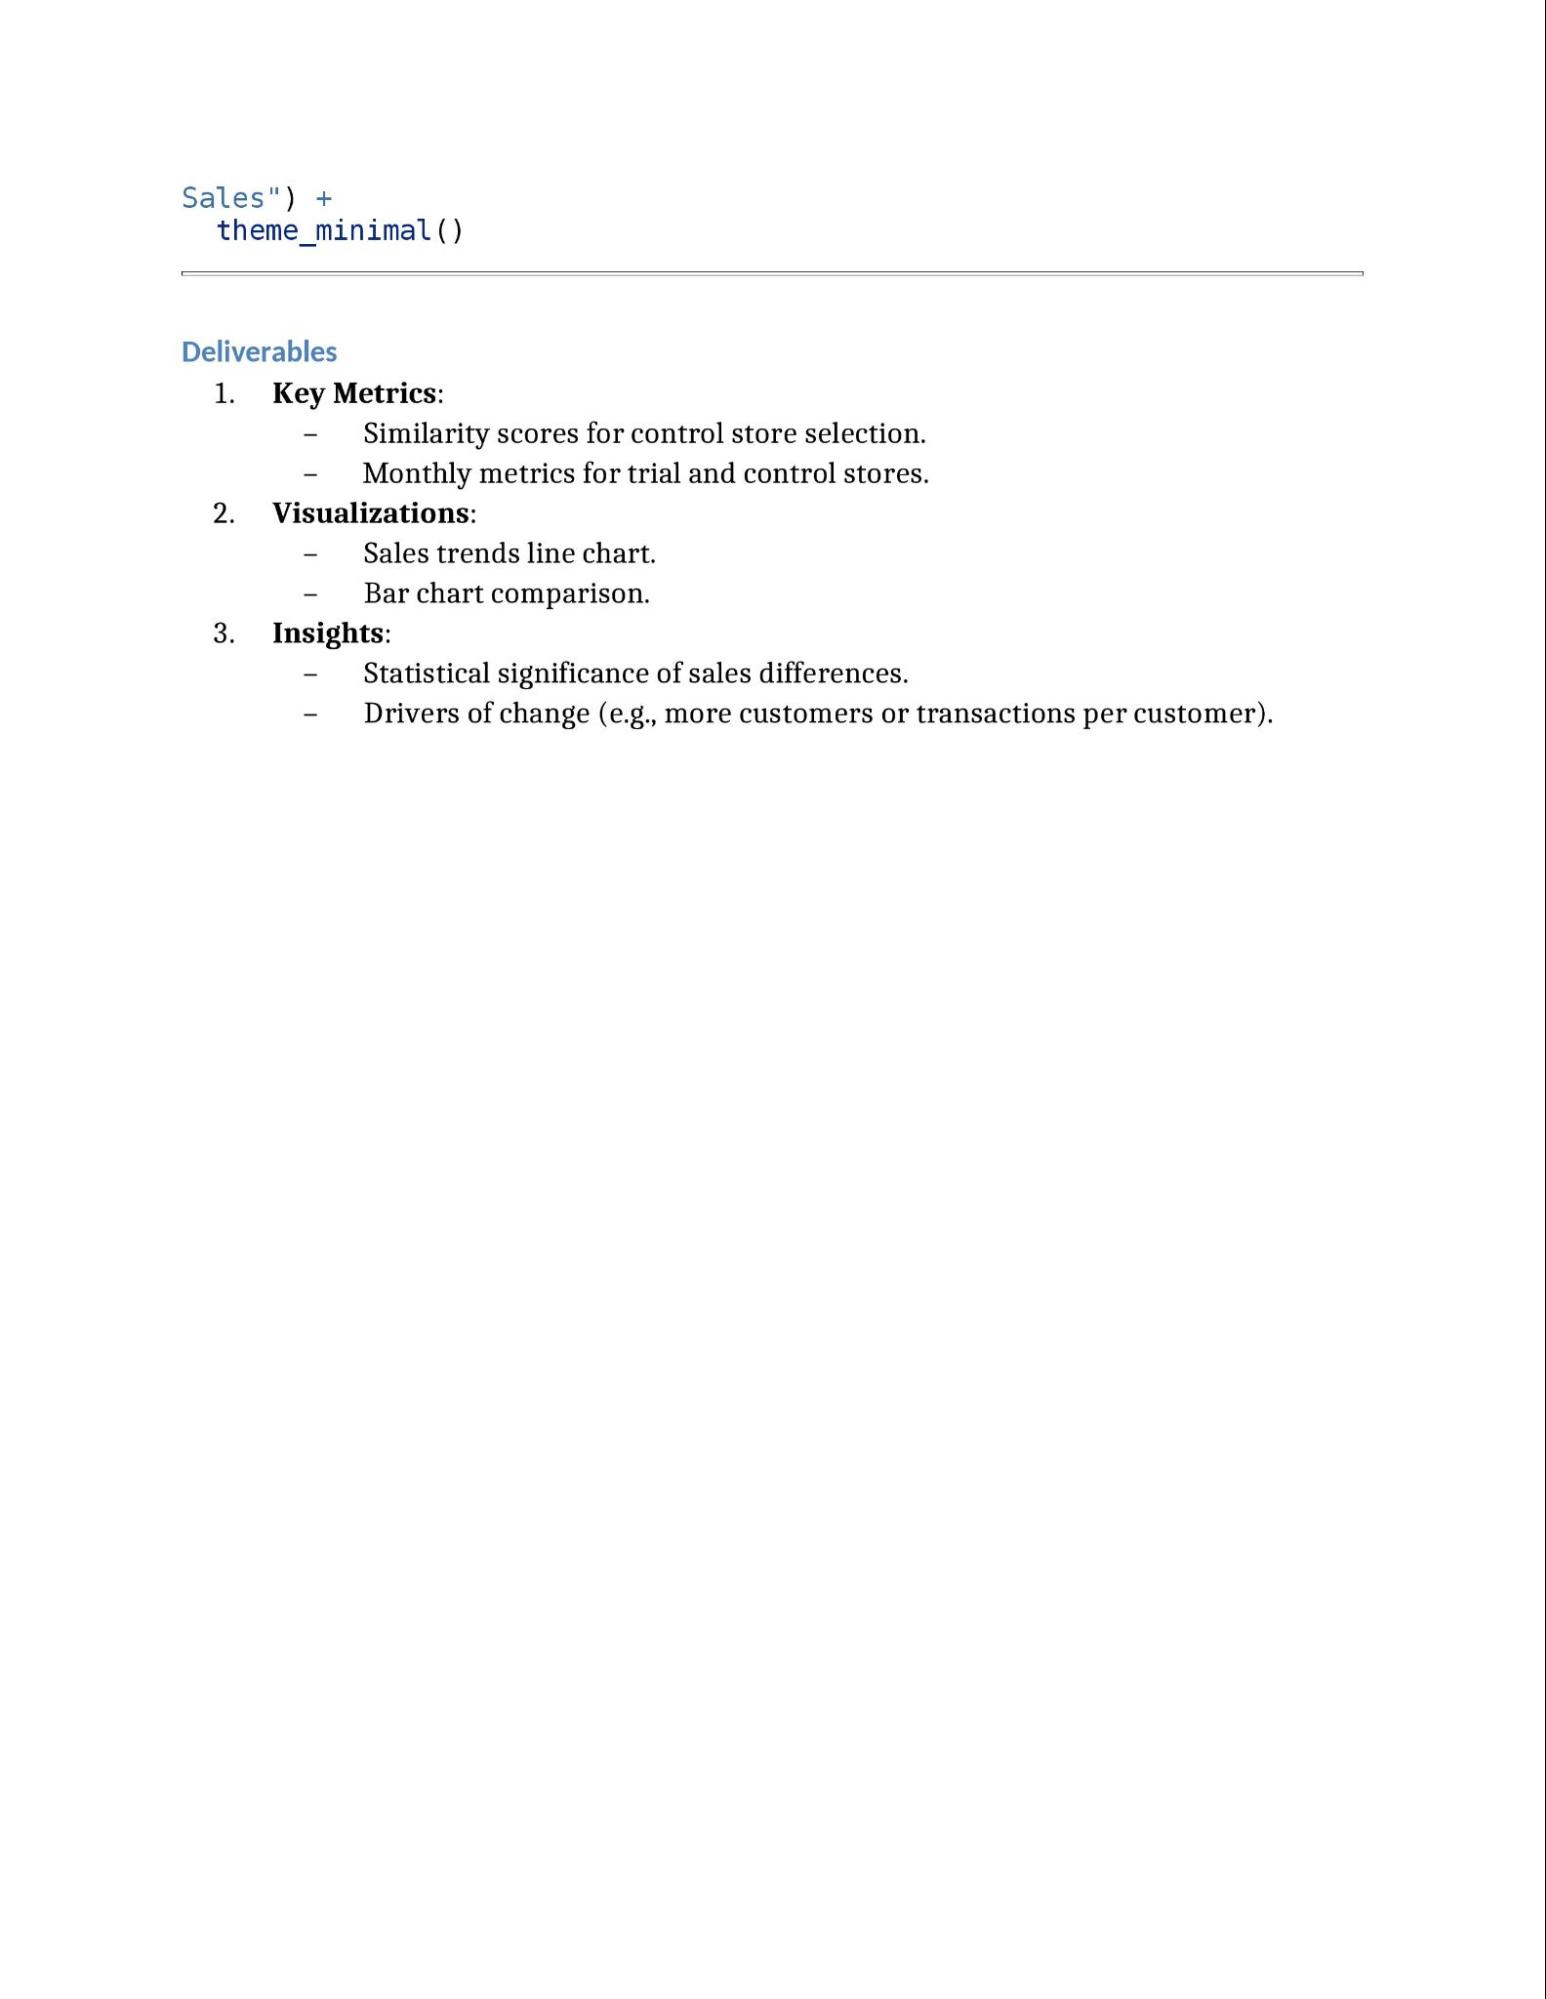
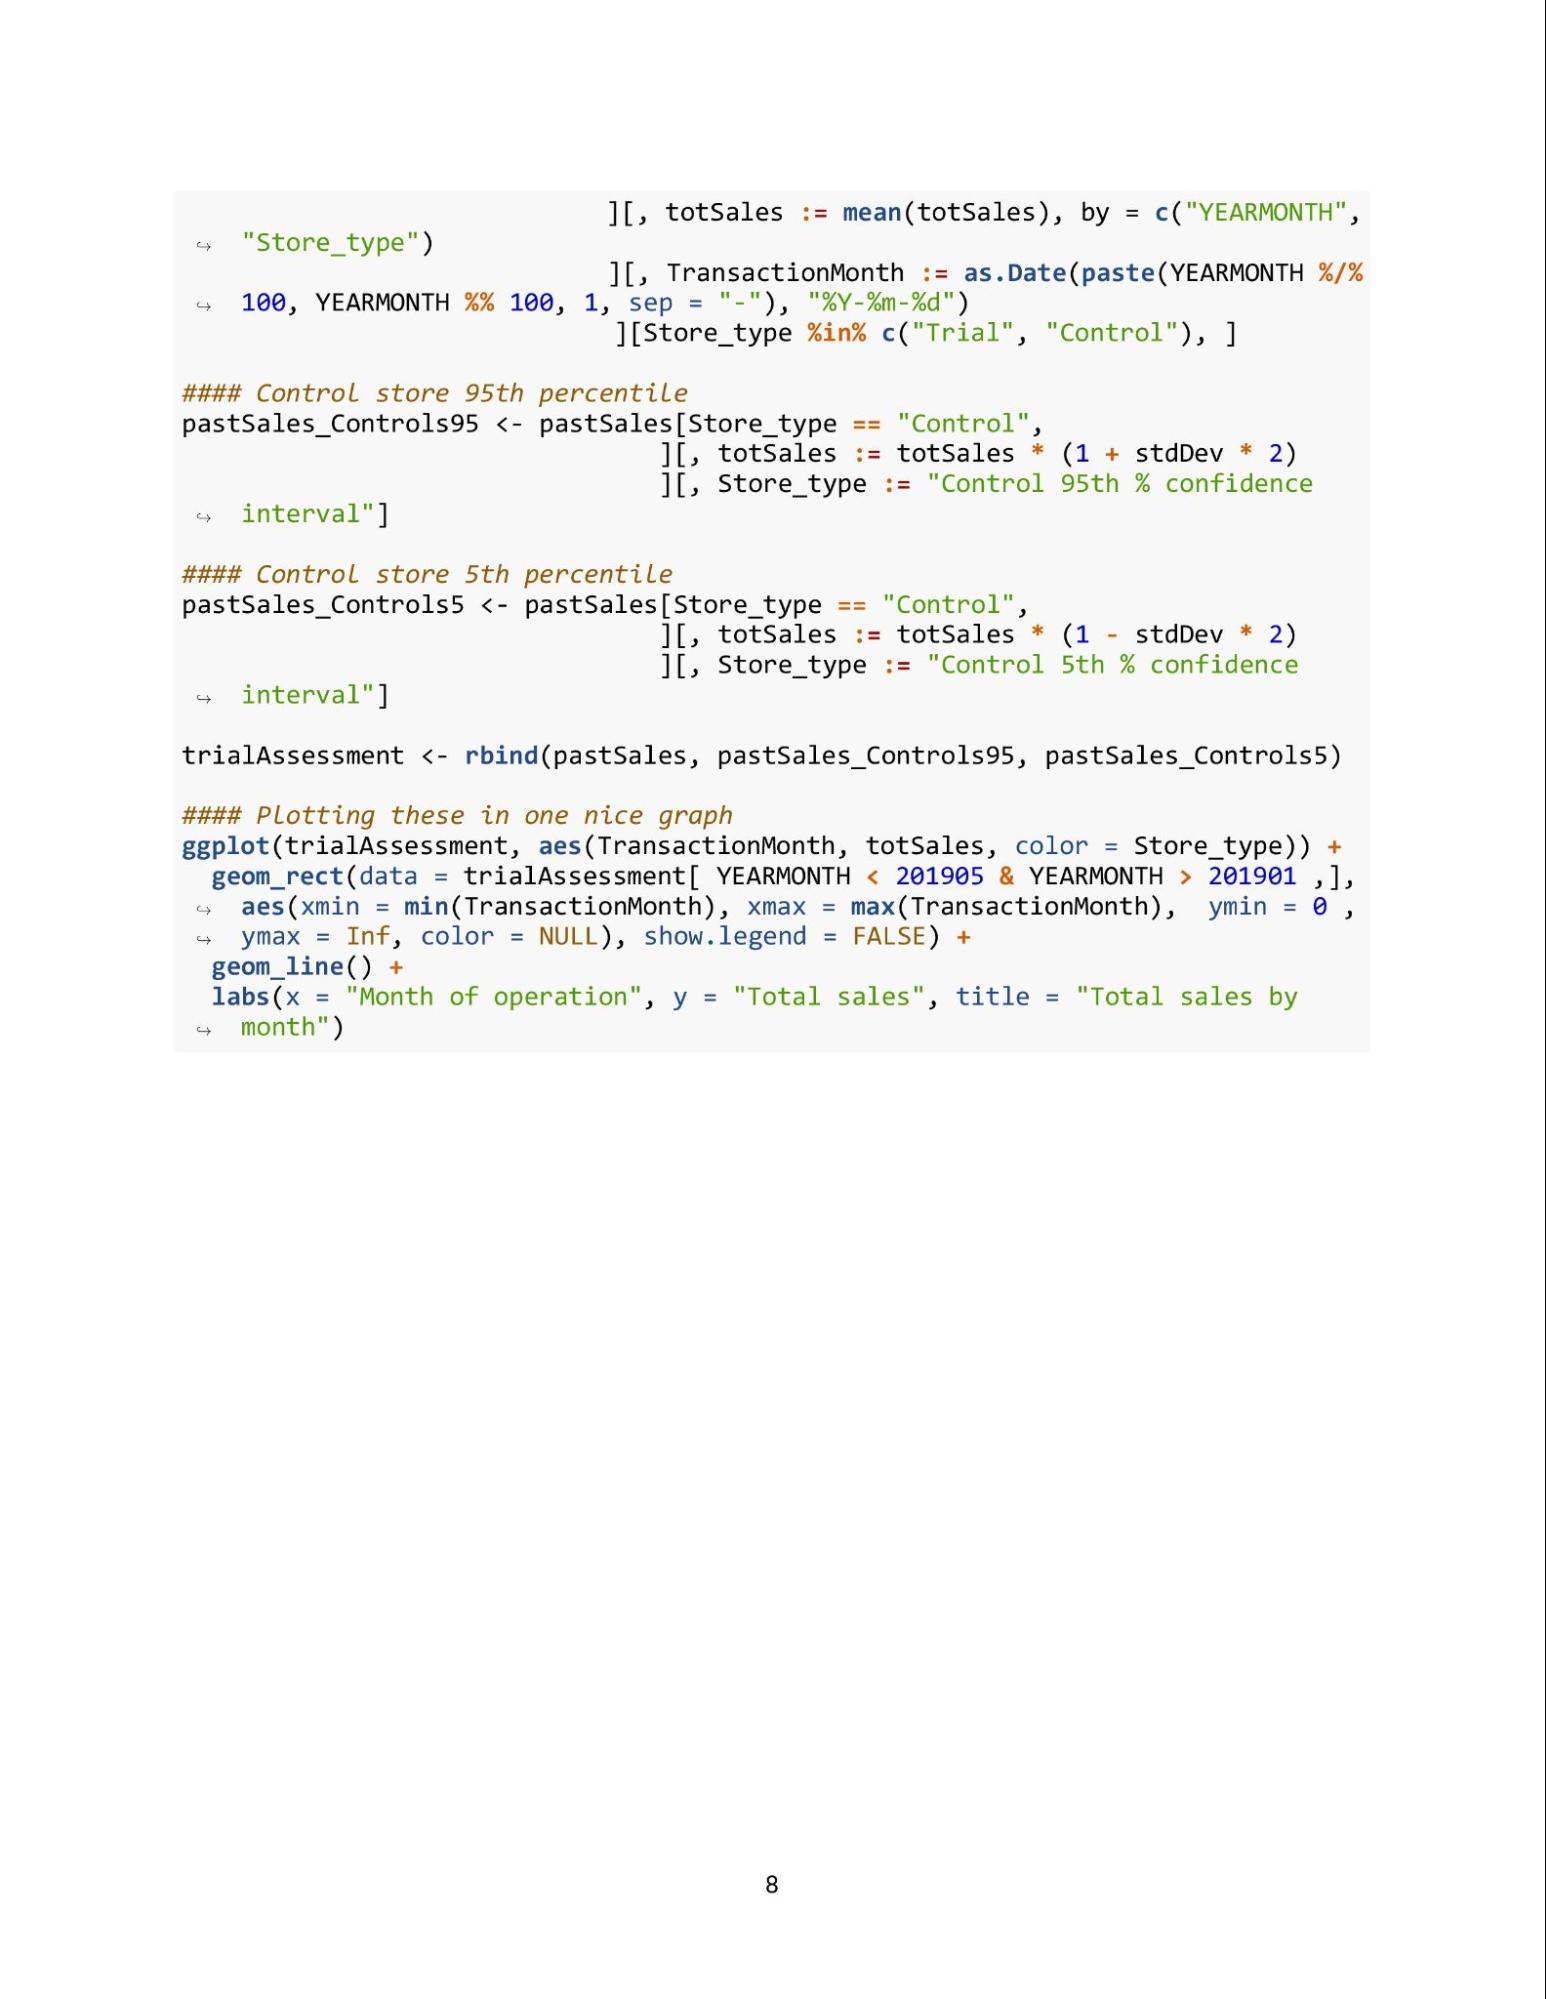
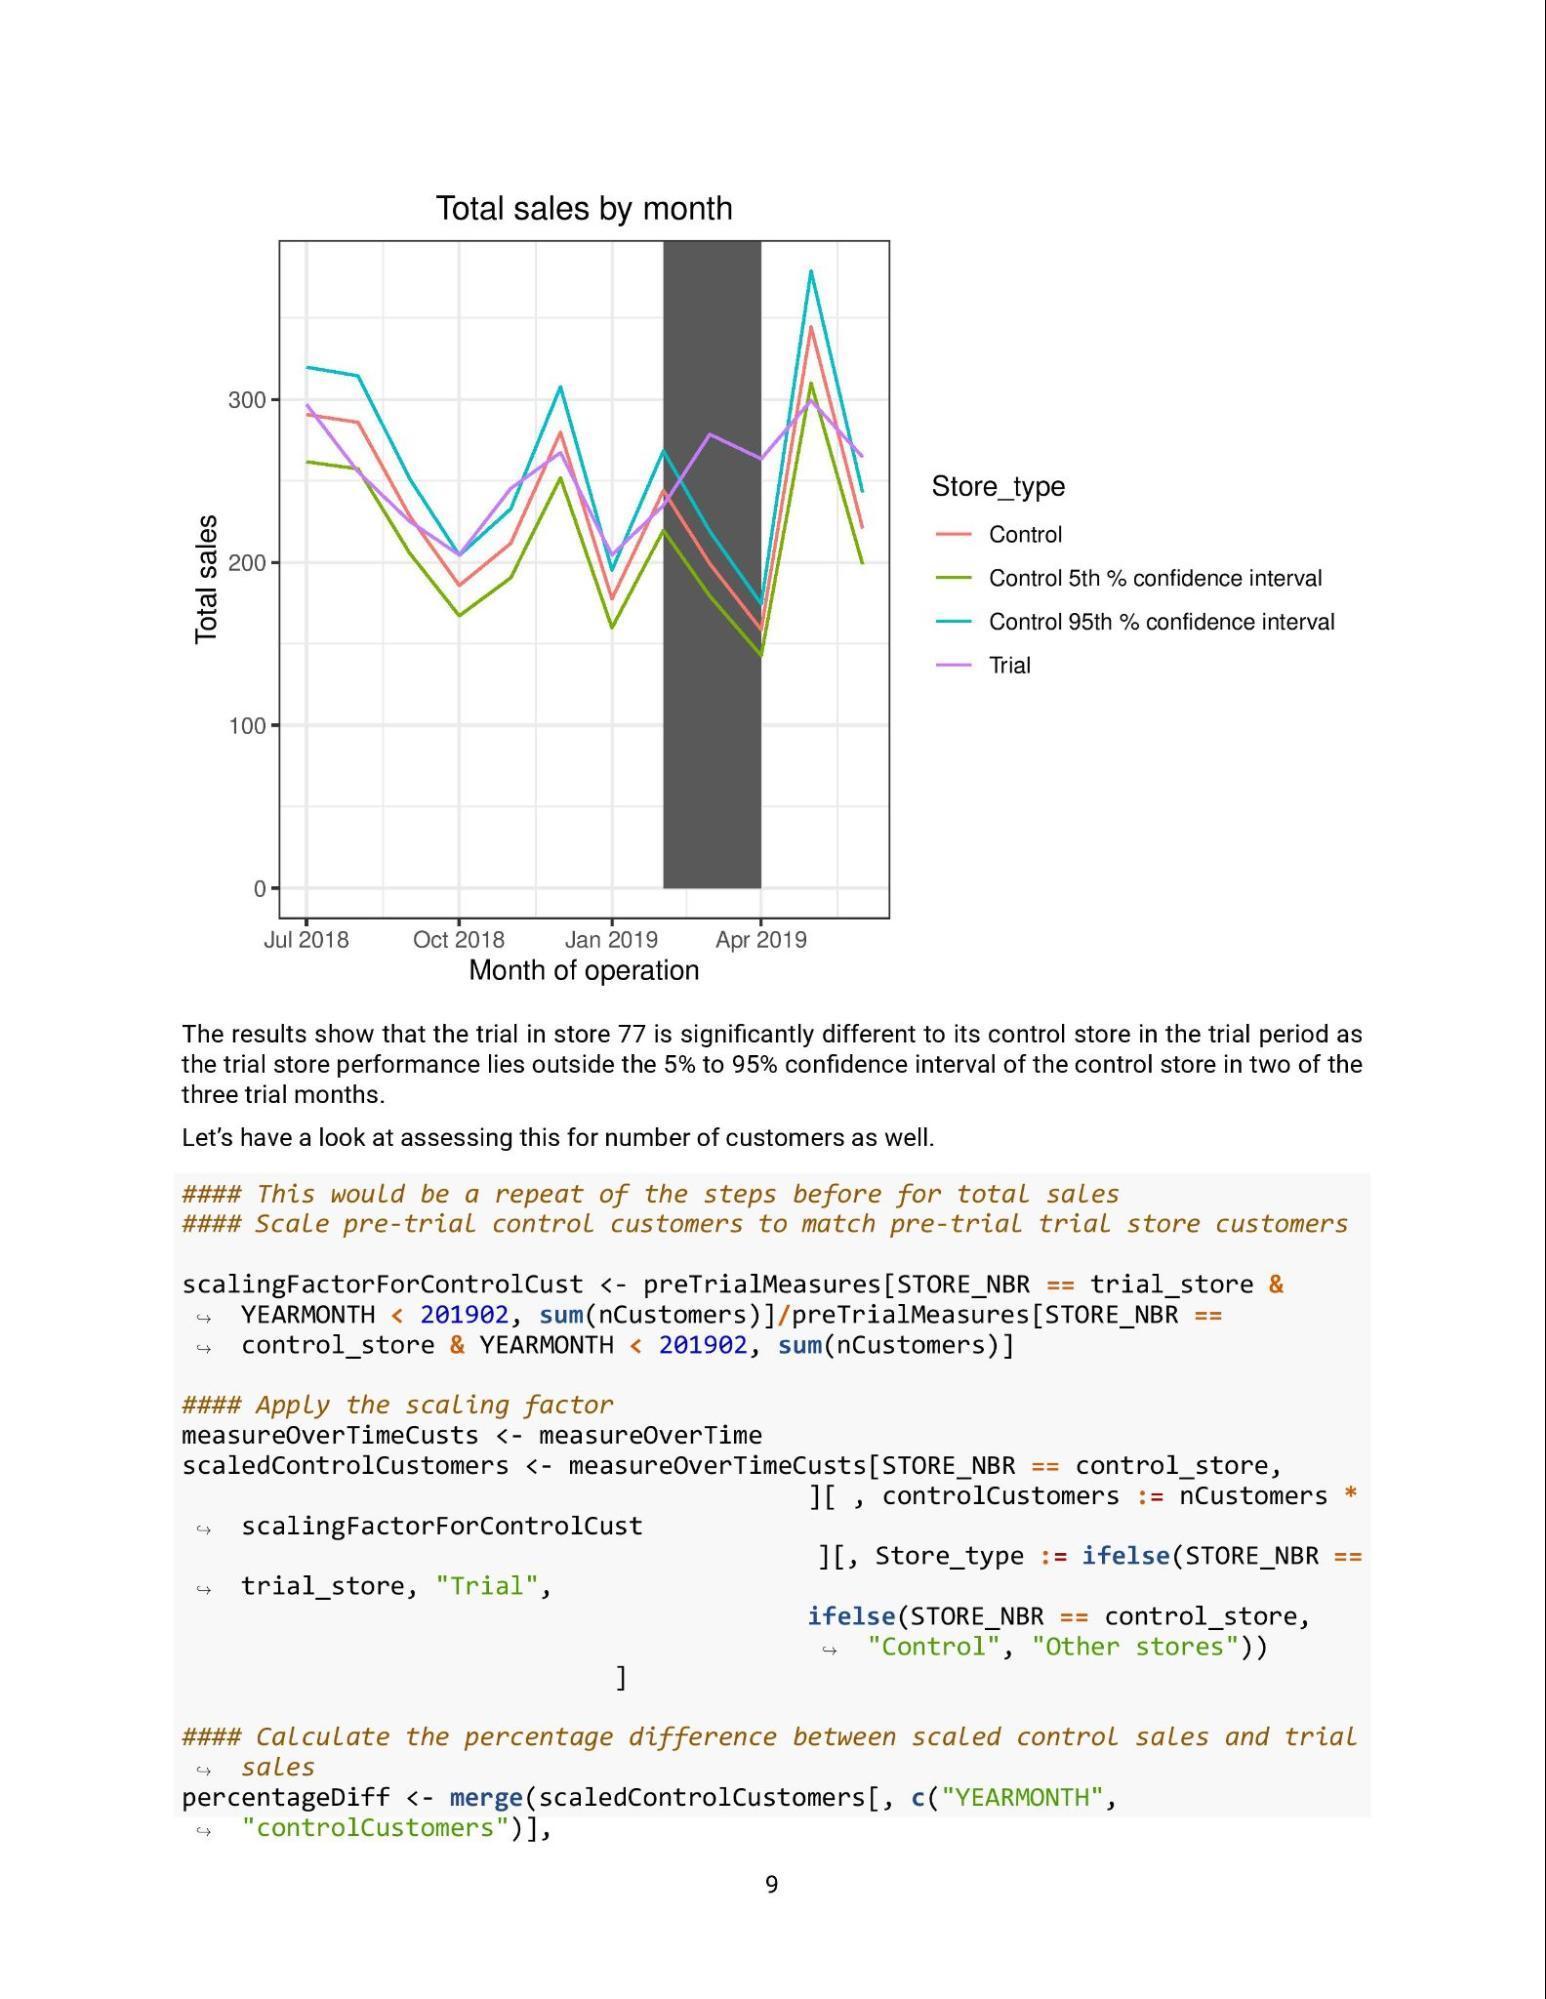
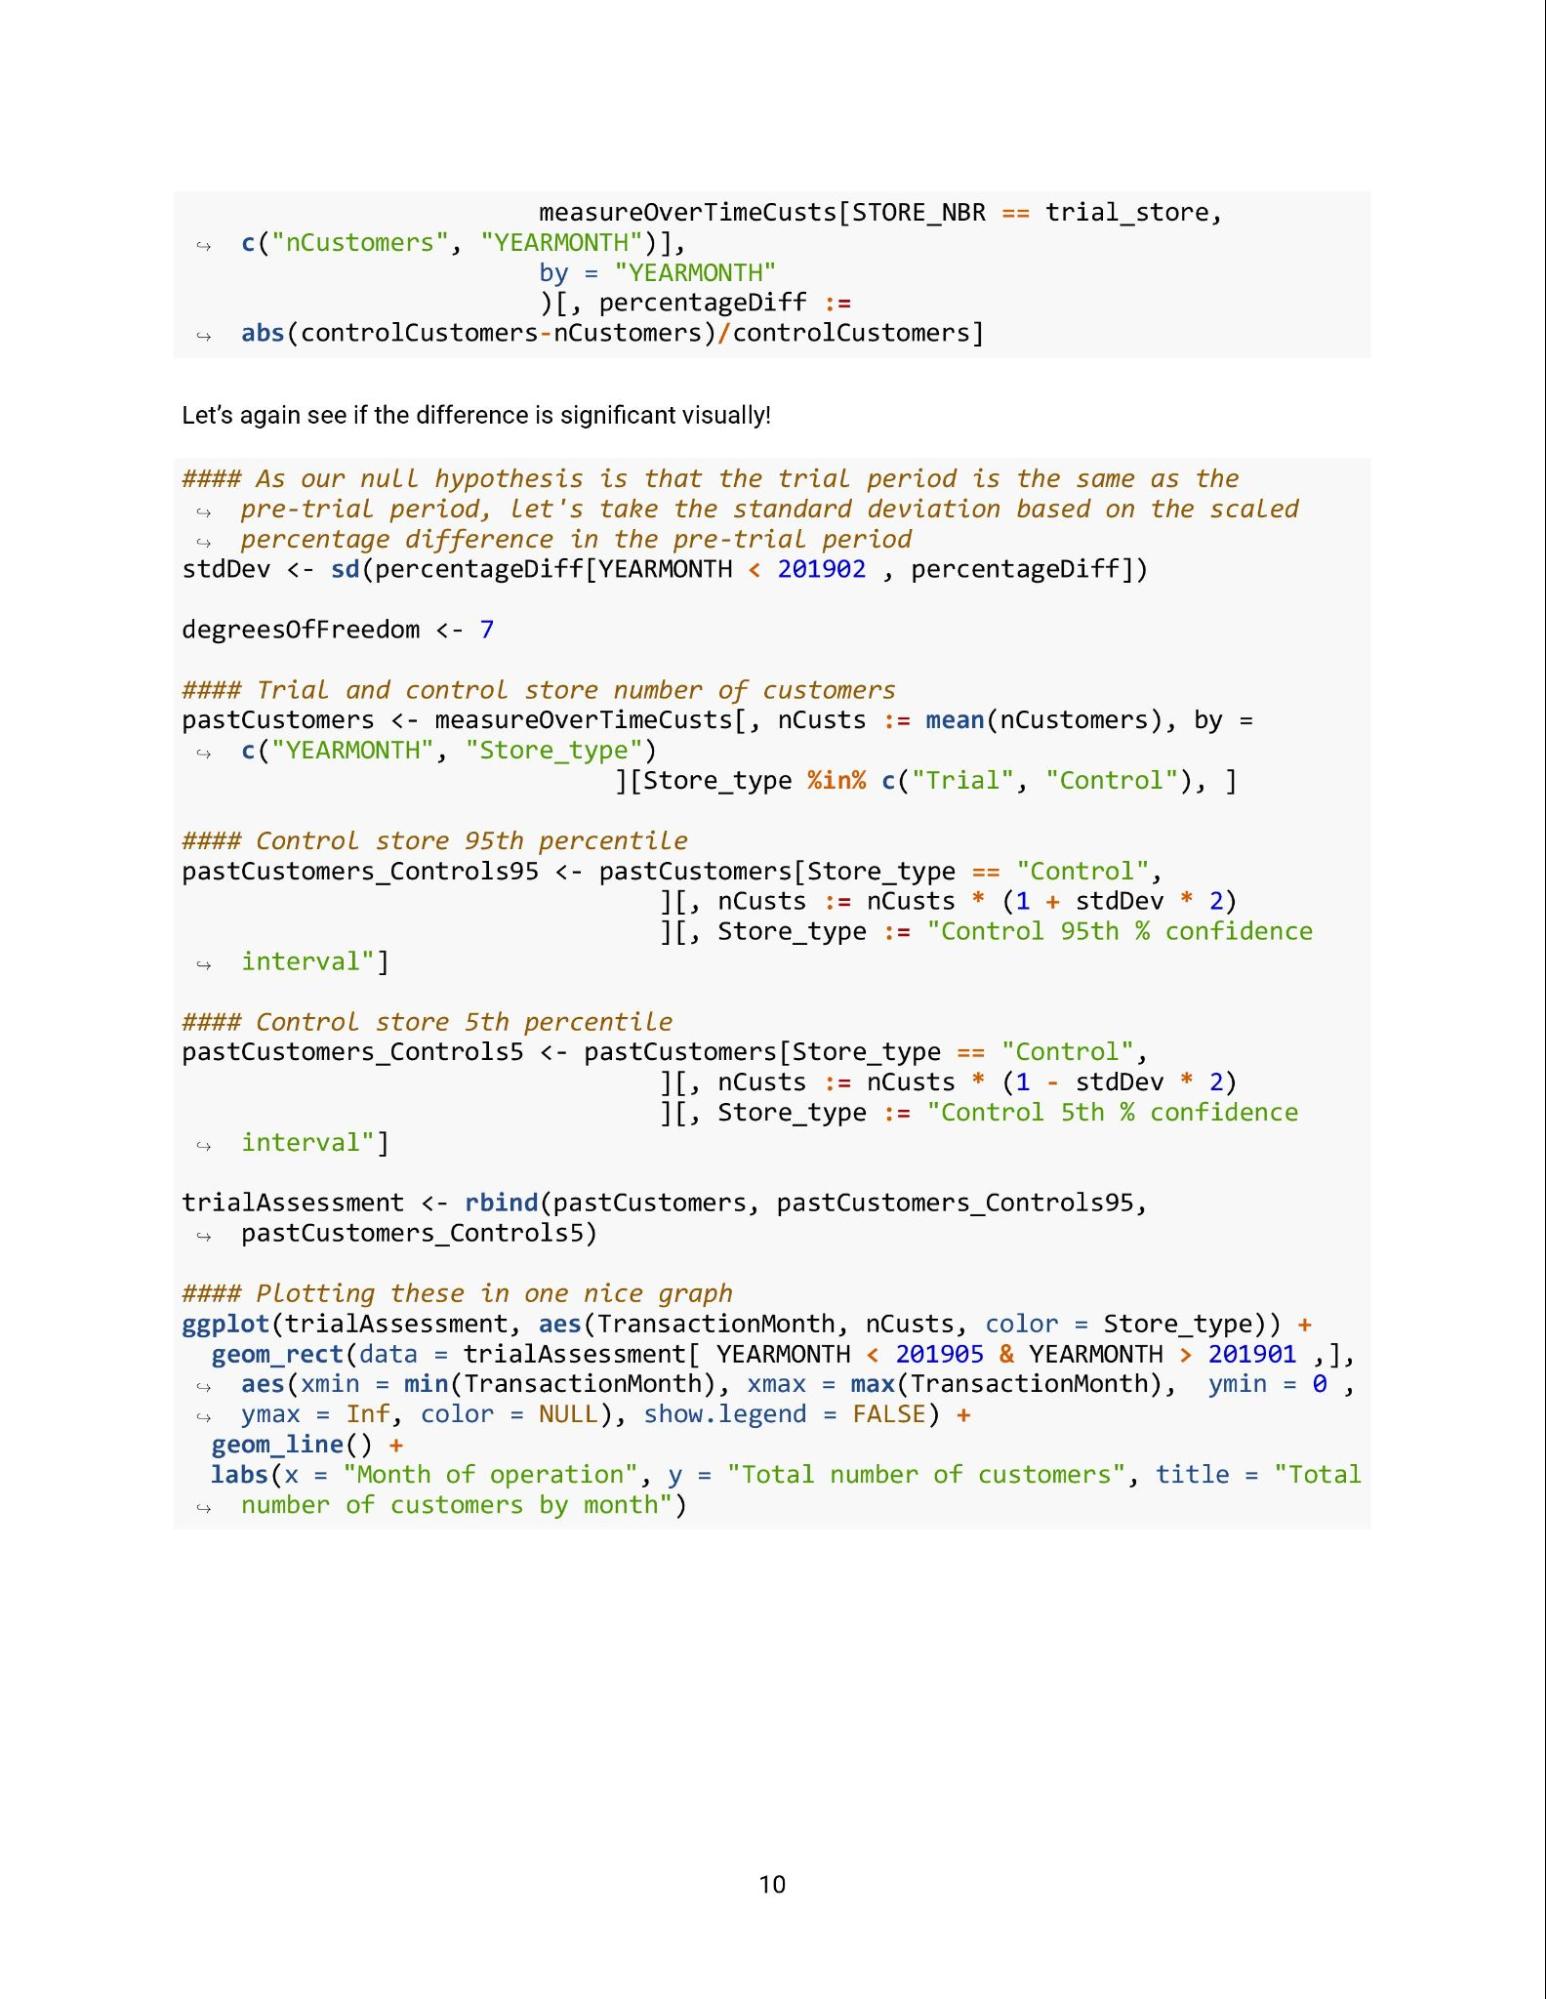
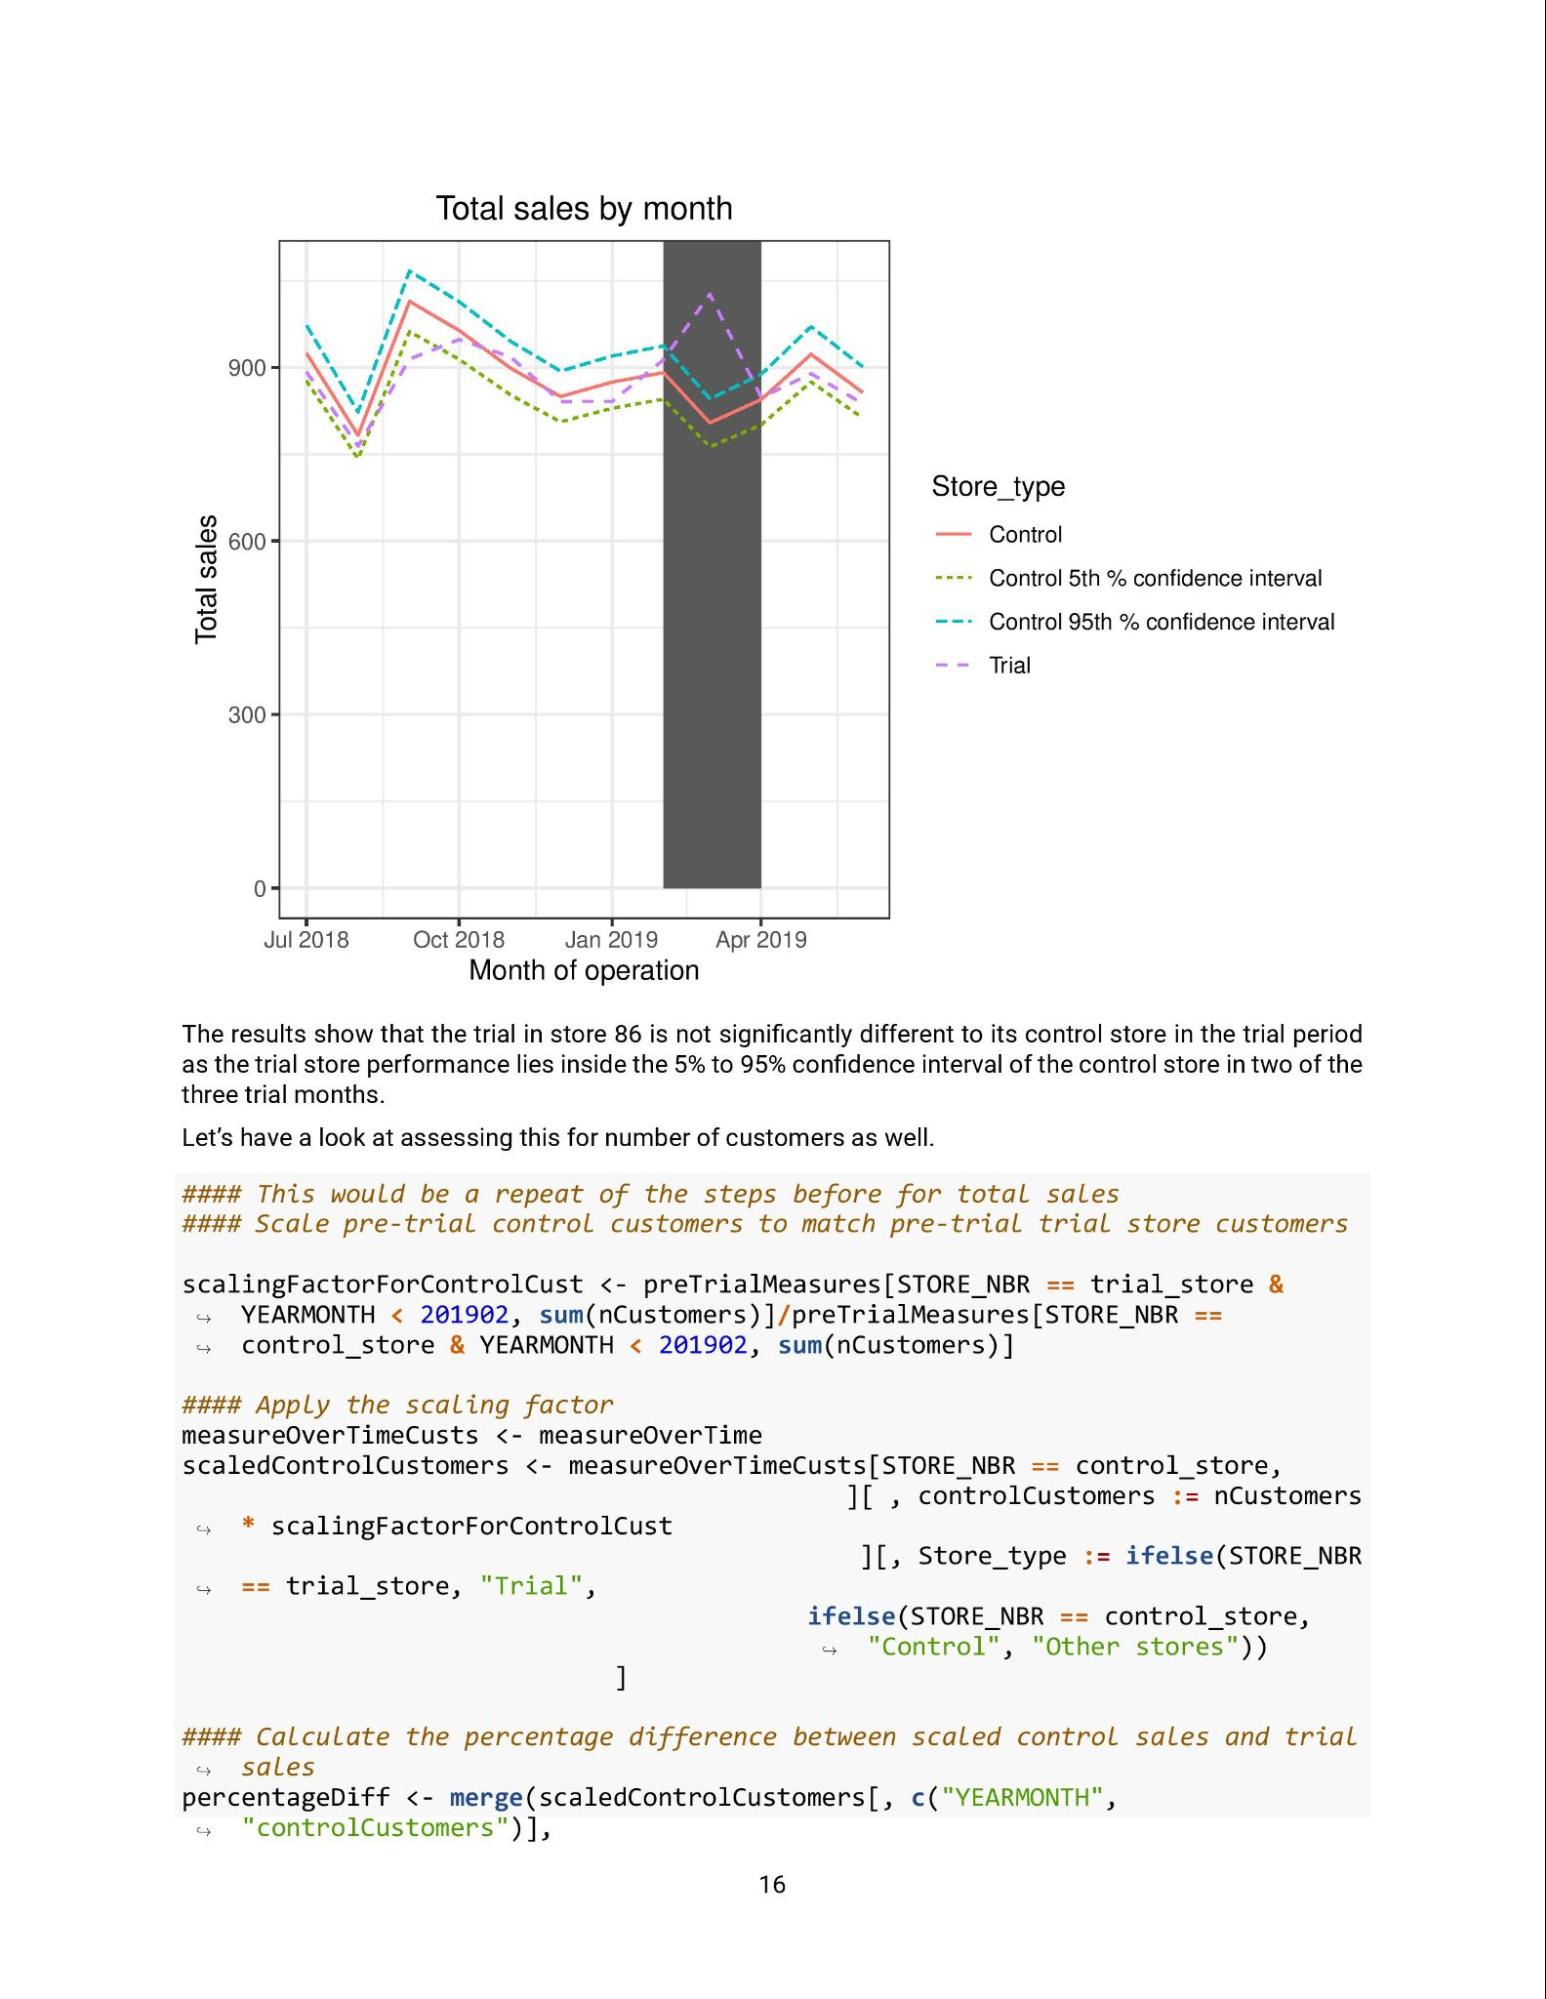
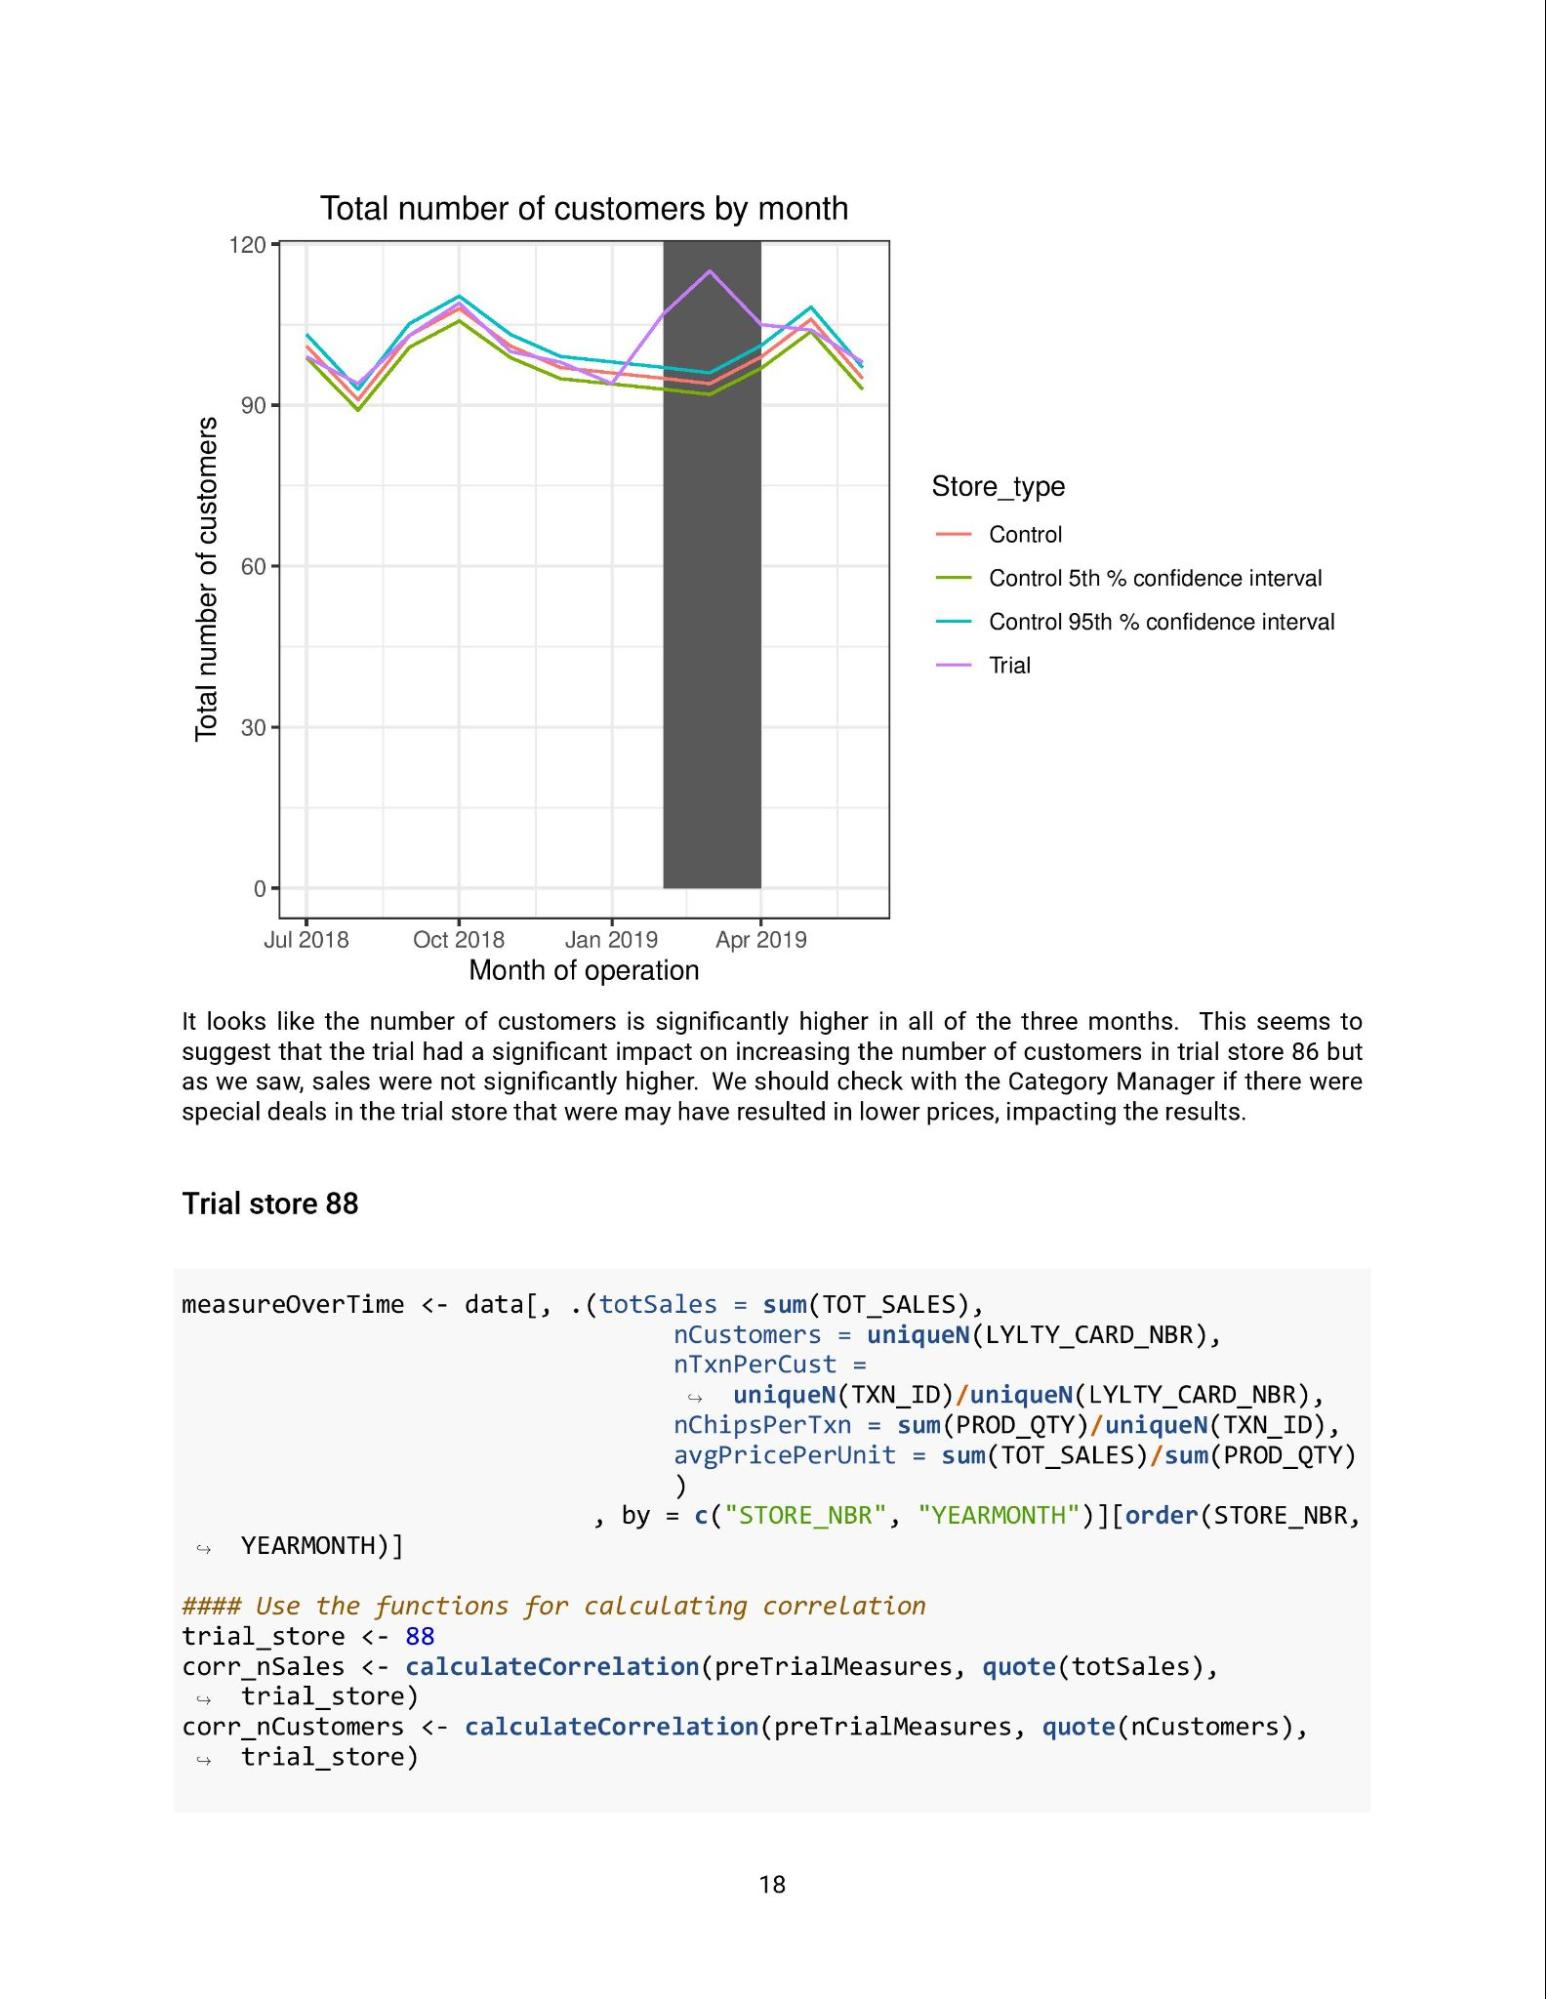
CodeR Copy code # Plot sales trends sales_trends <- qvi_data %>% filter(STORE %in% c(77, control_store_77$STORE), DATE >= trial_period[1], DATE <= trial_period[2]) %>% group_by(STORE, week = floor_date(DATE, "week")) %>% summarise(total_sales = sum(TOT_SALES)) ggplot(sales_trends, aes(x = week, y = total_sales, color = as.factor(STORE))) + geom_line() + labs(title = "Sales Trends During Trial Period", x = "Week", y = "Total Sales", color = "Store") + theme_minimal() # Bar chart comparison comparison_data <- data.frame( Store = c("Trial Store", "Control Store"), Total_Sales = c(trial_sales$total_sales, control_sales$total_sales) ) ggplot(comparison_data, aes(x = Store, y = Total_Sales, fill = Store)) + geom_bar(stat = "identity") + labs(title = "Total Sales Comparison", x = "Store", y = "Total Sales") + theme_minimal() Deliverables
Let me know if you need assistance with the implementation or interpretation of results! | ||||||||||||||
4 Example Answer | Example AnswerGreat work! Take a look at the example answer below to see how a professional would have attempted this task. Think about what you did well and how you can improve. | ||||||||||||||
5 Completion | |||||||||||||||
Task Three: Analytics and commercial application | |||||||||||||||
1 Task Overview | Task OverviewWhat you'll learn
What you'll do
| ||||||||||||||
2 Here is the background information on your task | Here is the background information on your taskWe suggest you complete Tasks 1 and 2 before proceeding with this task. Task 3 is targeted specifically at building your ability to recognise commercial, actionable insights from your analysis and displaying it in a clear and concise way for your client, with minimal jargon. At Quantium, our analyst graduates sometimes work as what we like to call “hybrids” (a mix of analyst and consultant duties) so developing your presentation skills early is a huge win! As both technical tasks 1 and 2 were open ended in terms of insights, this model answer will focus on the layout and the order of your inclusions, including where to include graphs, taglines, written insights and recommendations. As part of Quantium’s retail analytics team, you have been conducting a range of analysis on transaction and purchase behaviour data to provide key recommendations to your client, the Category Manager of chips, who is putting together their strategic plan. | ||||||||||||||
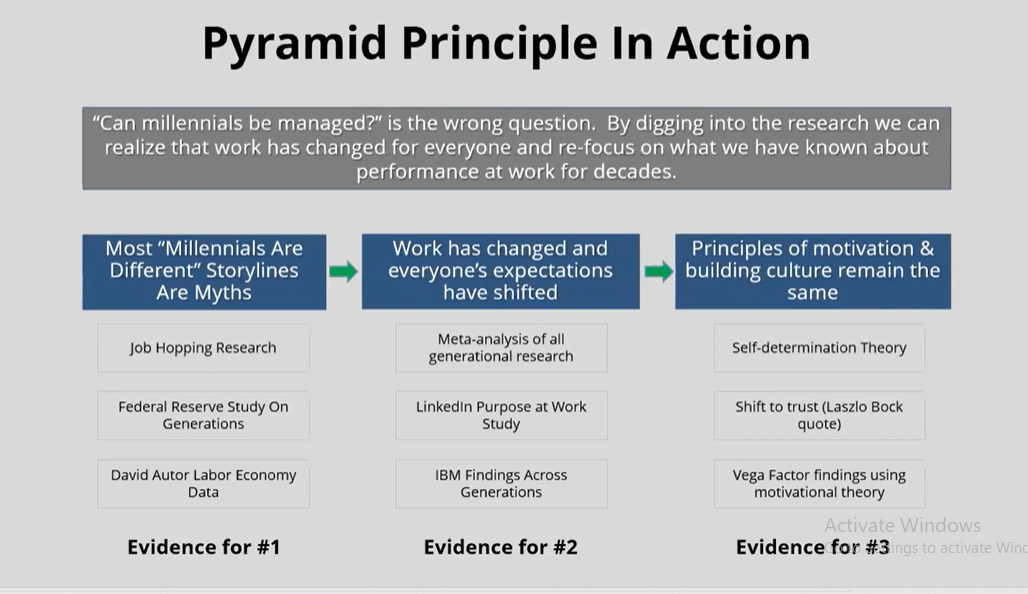
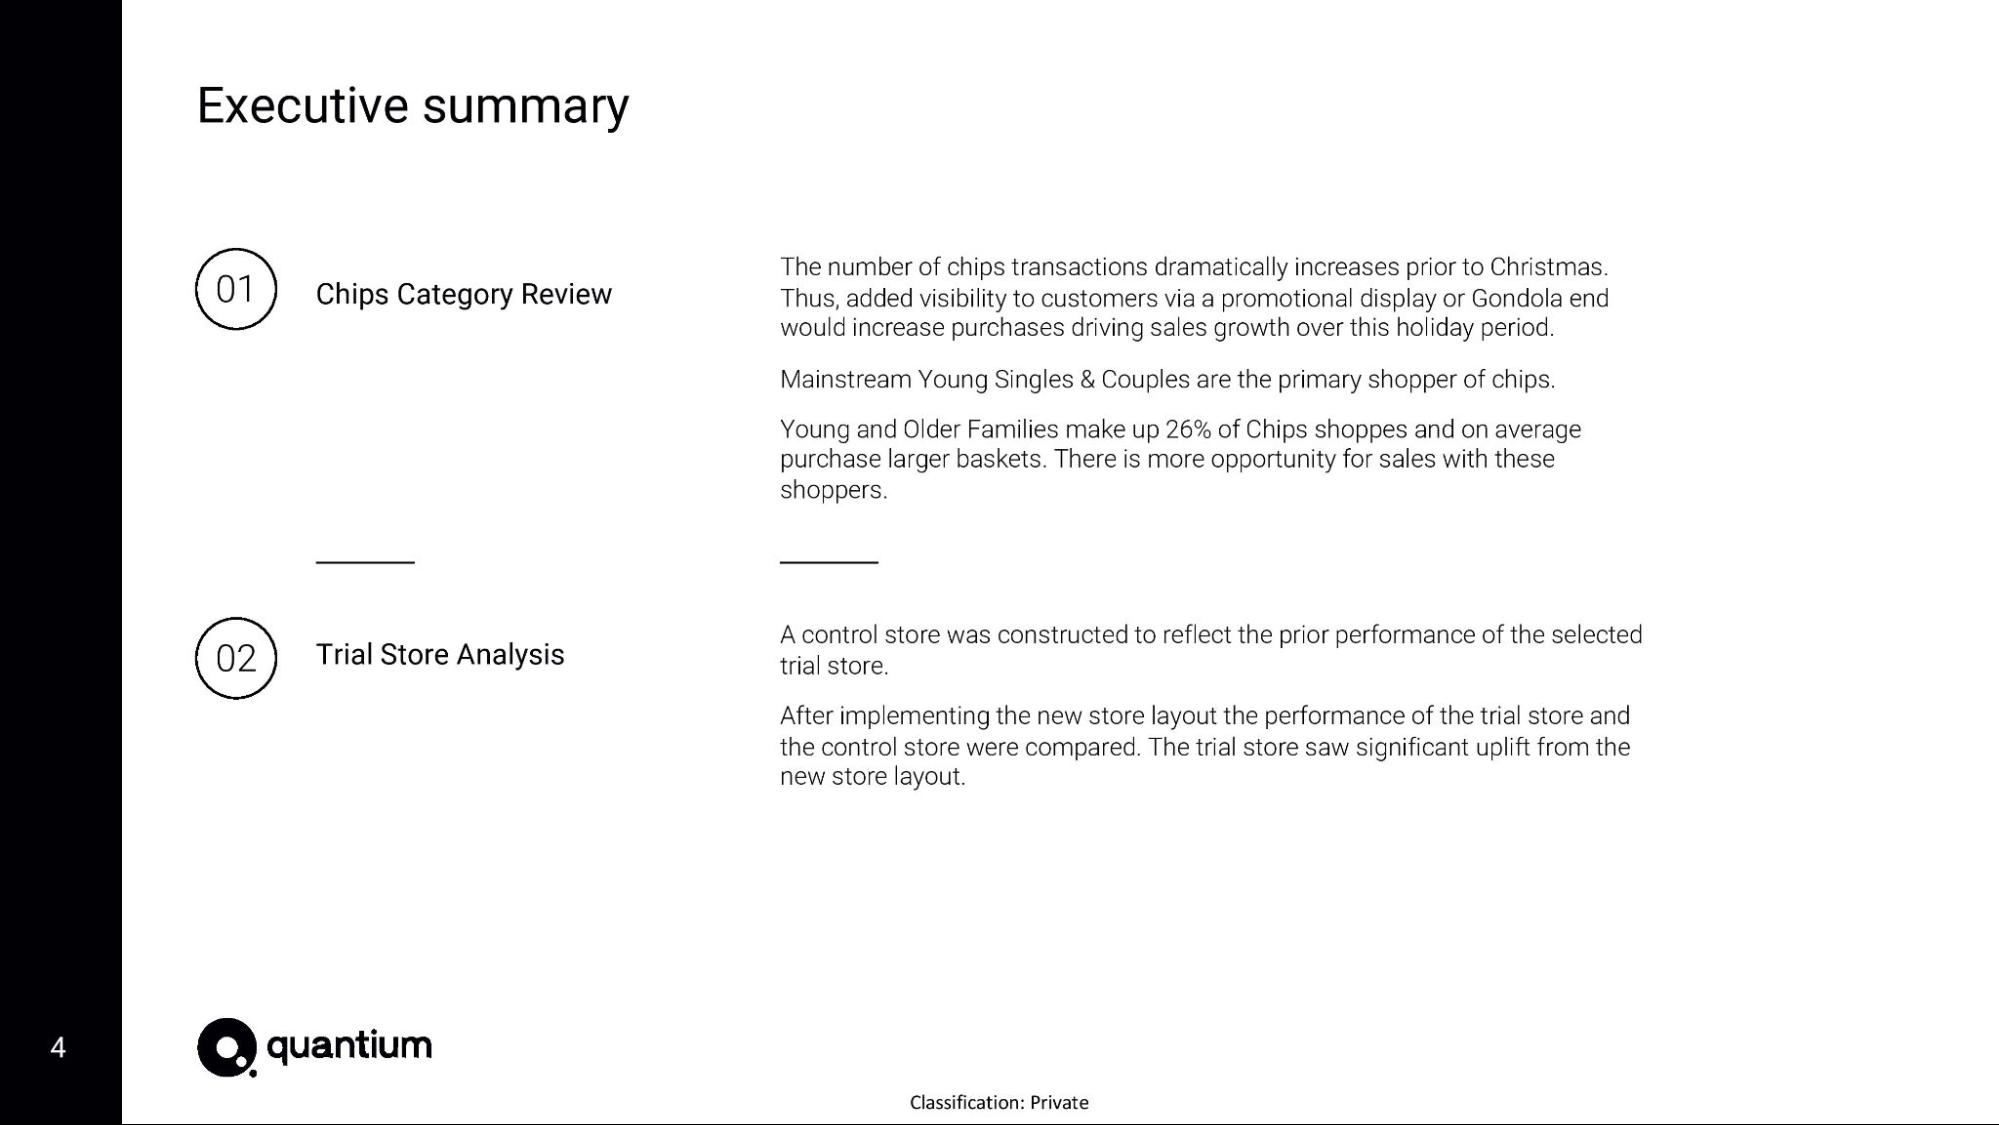
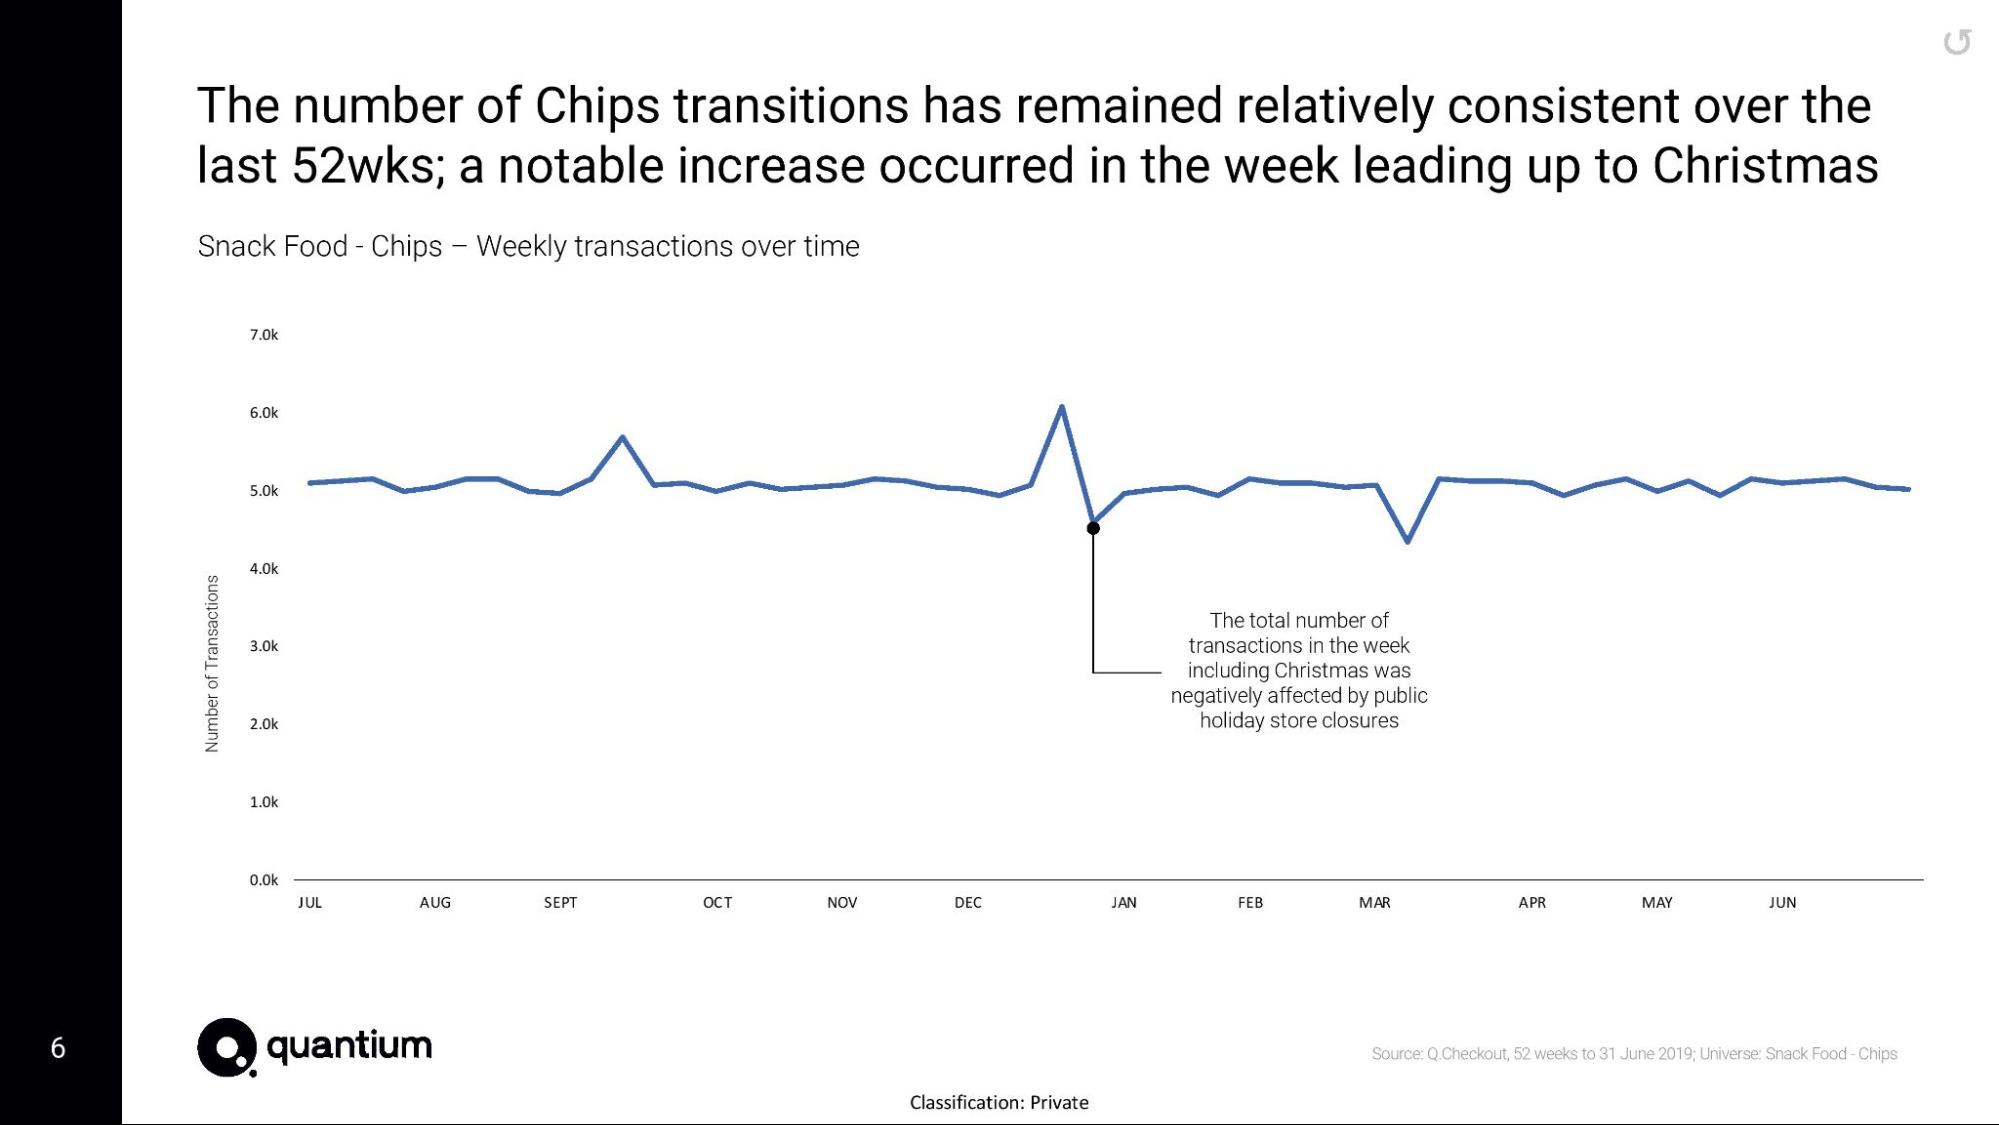
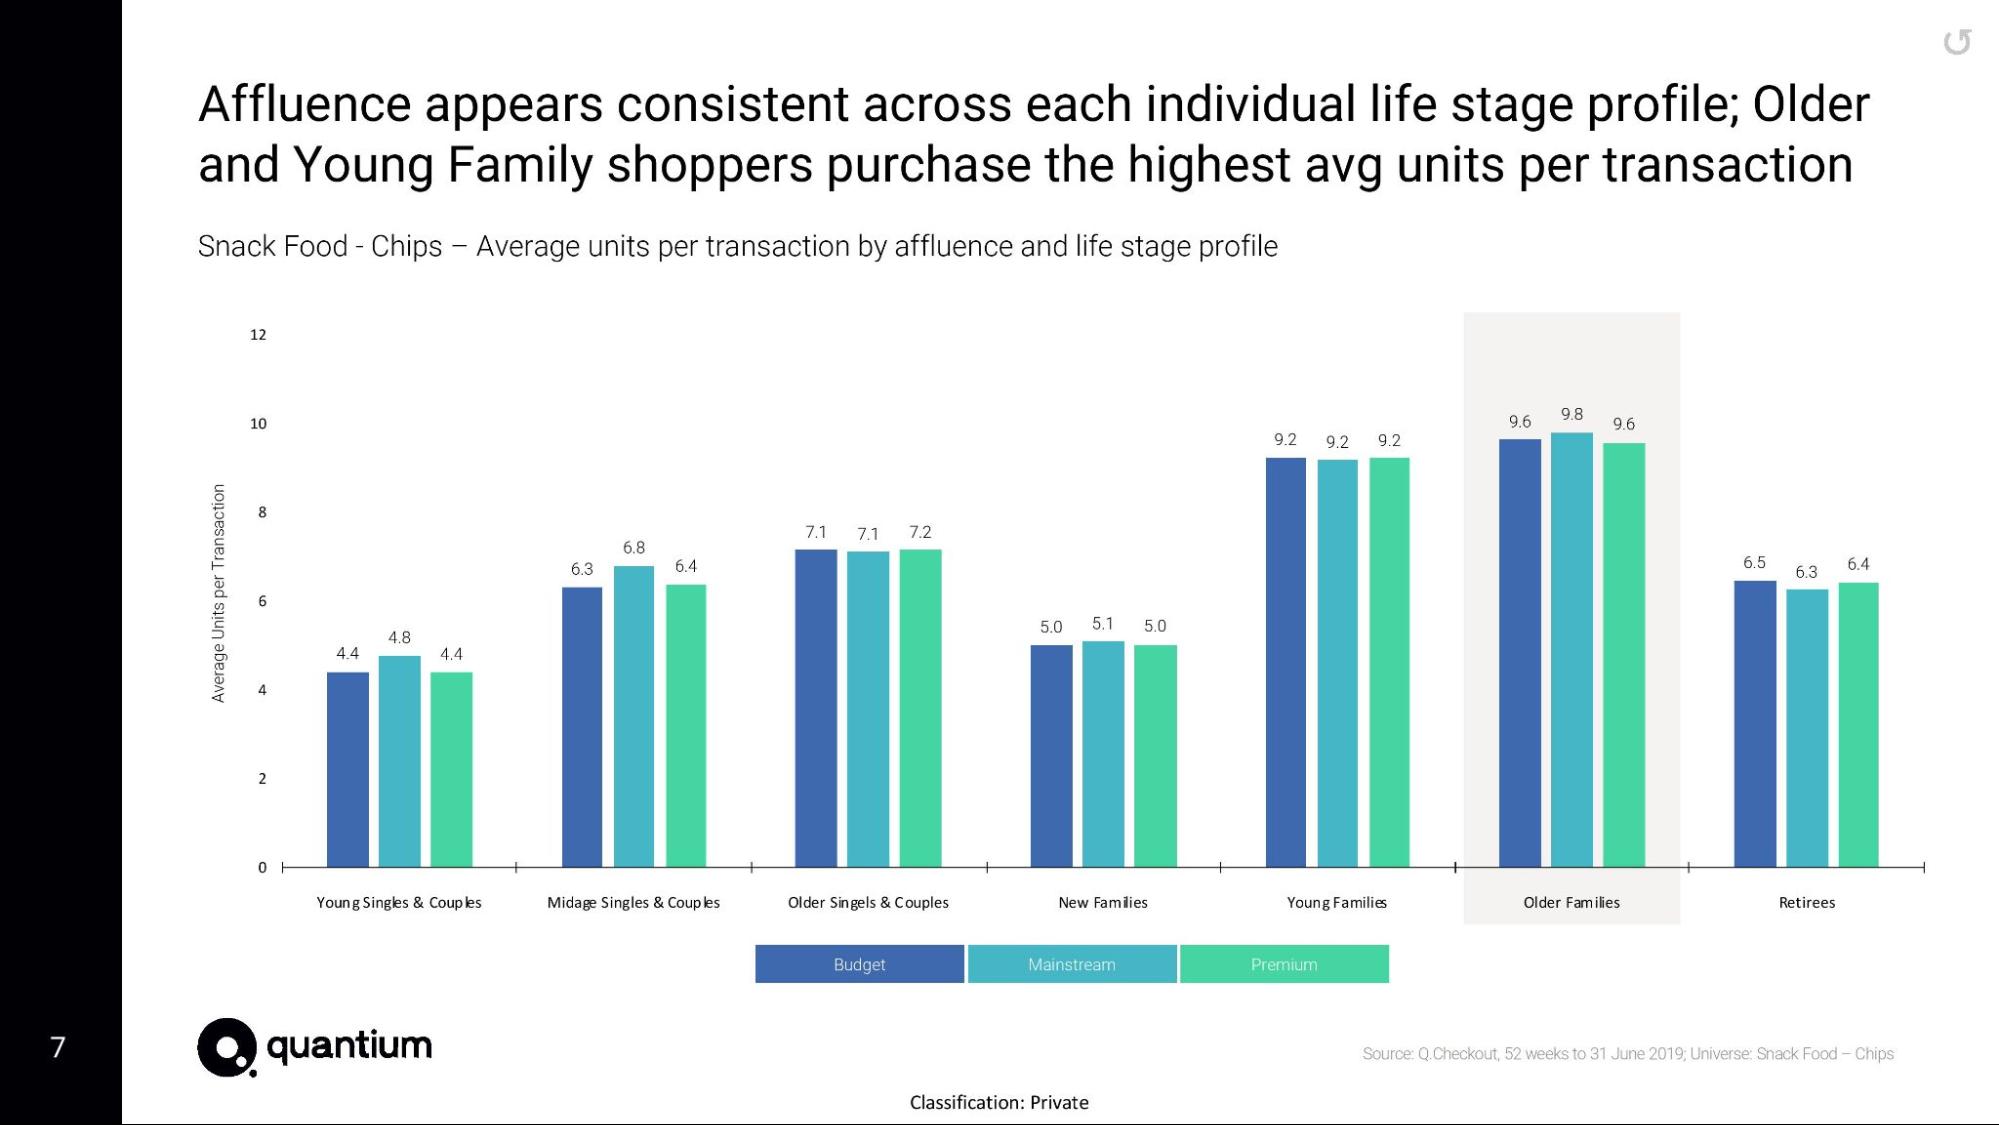
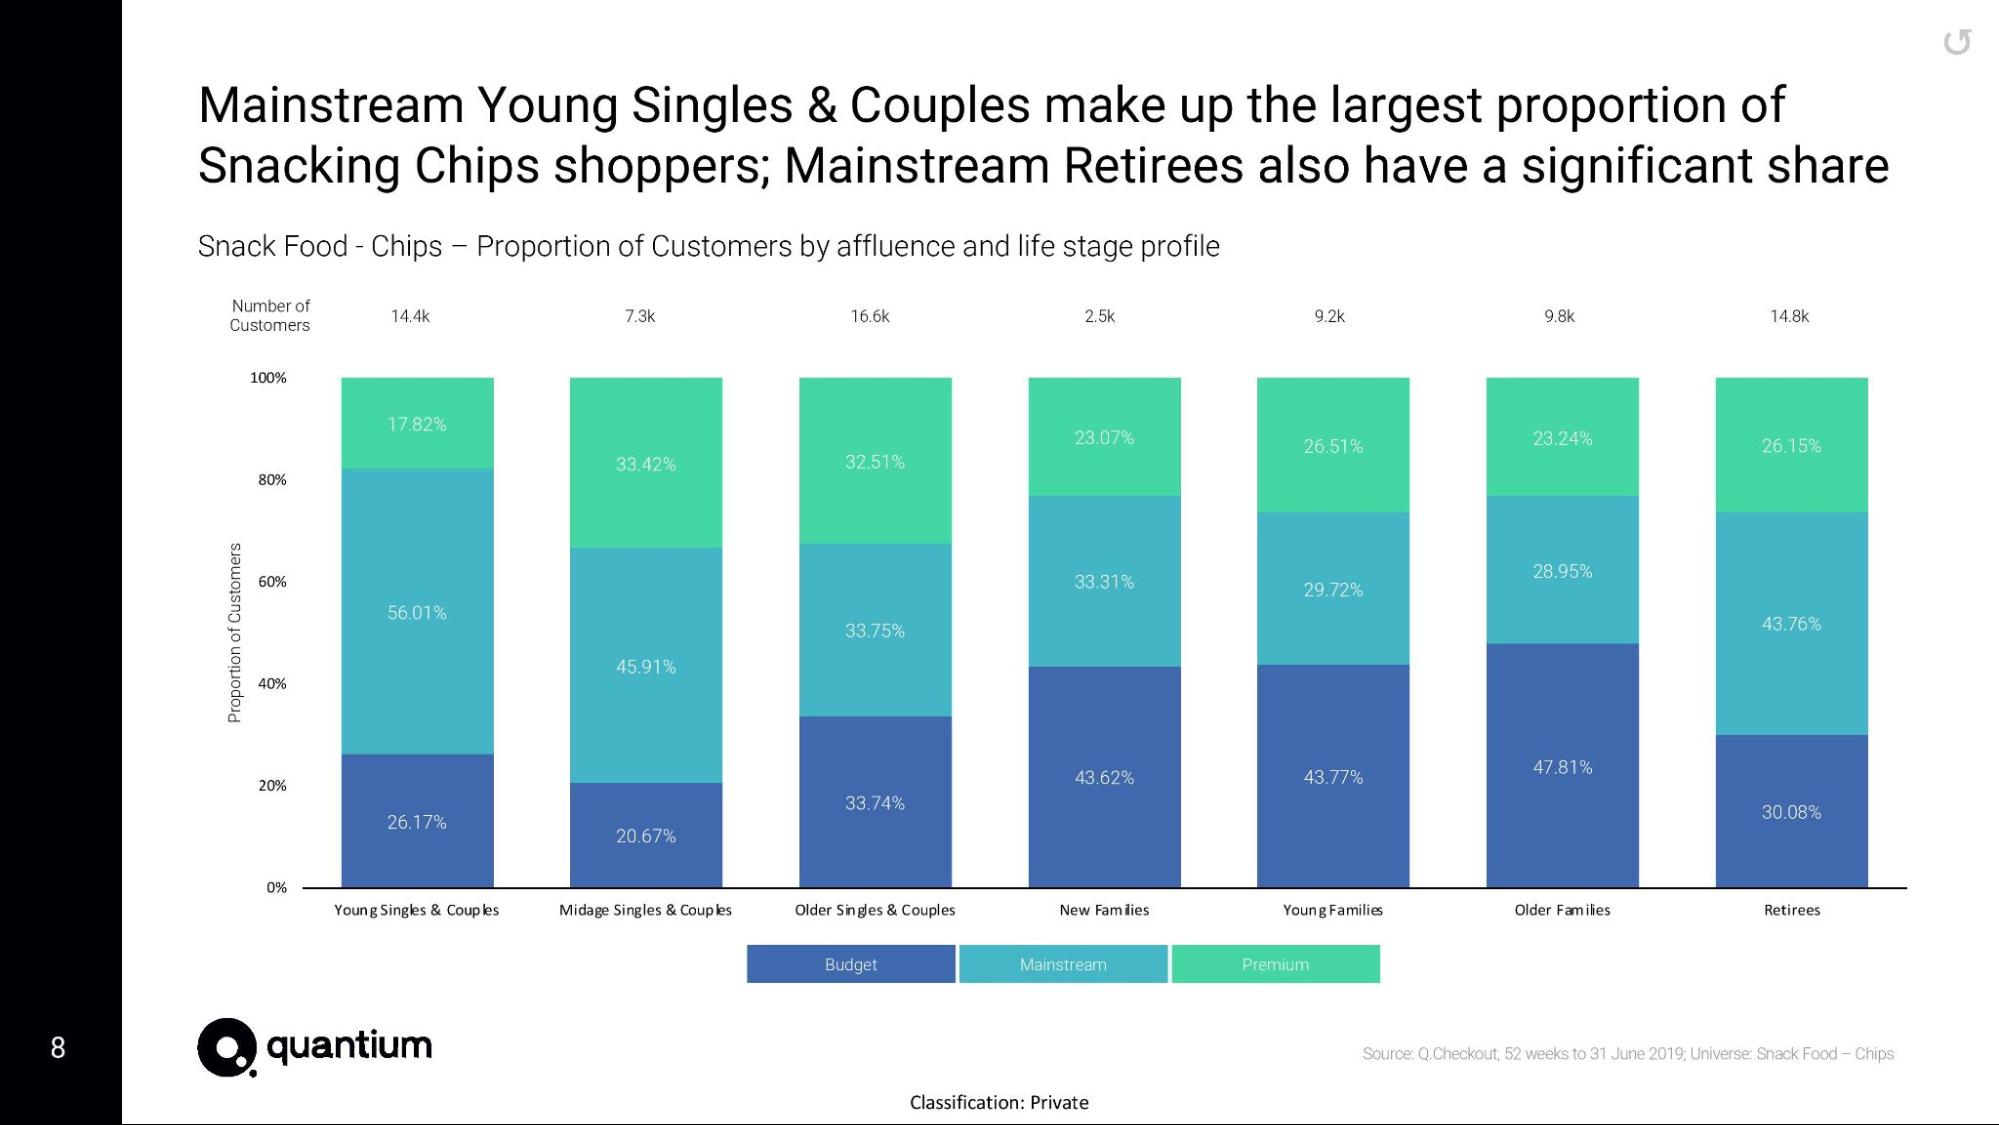
3 Here is your task | Here is your taskWith our project coming to an end its time for us to send a report to Julia, based on our analytics from the previous tasks. We want to provide her with insights and recommendations that she can use when developing the strategic plan for the next half year. As best practice at Quantium, we like to use the “Pyramid Principles” framework when putting together a report for our clients. If you are not already familiar with this framework you can find quick introductions on by searching form them on the internet. For this report, we need to include data visualisations, key callouts, insights as well as recommendations and/or next steps. We recommend you use a tool like PowerPoint (or similar) to create your report, we have also provided you a template to help get you started. One way to create your visualisations (graphs, charts etc) is to save your output files from task 1 & 2 and create generate your charts in Excel. You may find it helpful to create chart templates however that is not essential. We are looking for consistency here – if a series is blue in one chart it needs to remain blue throughout the presentation. Once you have created the charts in your Excel file, paste them into your PowerPoint in the order that suits best. When you have finished creating your report, remember to save it as a PDF to submit in the next page. Below, use the text input to write your cover email to the client you will send with the report. Here are some resources to help youHere are some useful resources on the "Pyramid Principles" framework: A Real-Life Example of The Pyramid Principle In PowerPoint I show you how I map the pyramid principle to a short presentation I created to research the question "how do you manage a millennial?" The pyramid principle was created by Barbara Minto at McKinsey & Company to help structure ideas and create compelling presentations Millennial Presentation: https://www.slideshare.net/slideshow/managing-millennials-fact-or-fiction-debunking-the-myths/142924725 100+ ConsultingPowerPoint Templates: https://strategyu.co/strategy-consulting-powerpoint-templates/
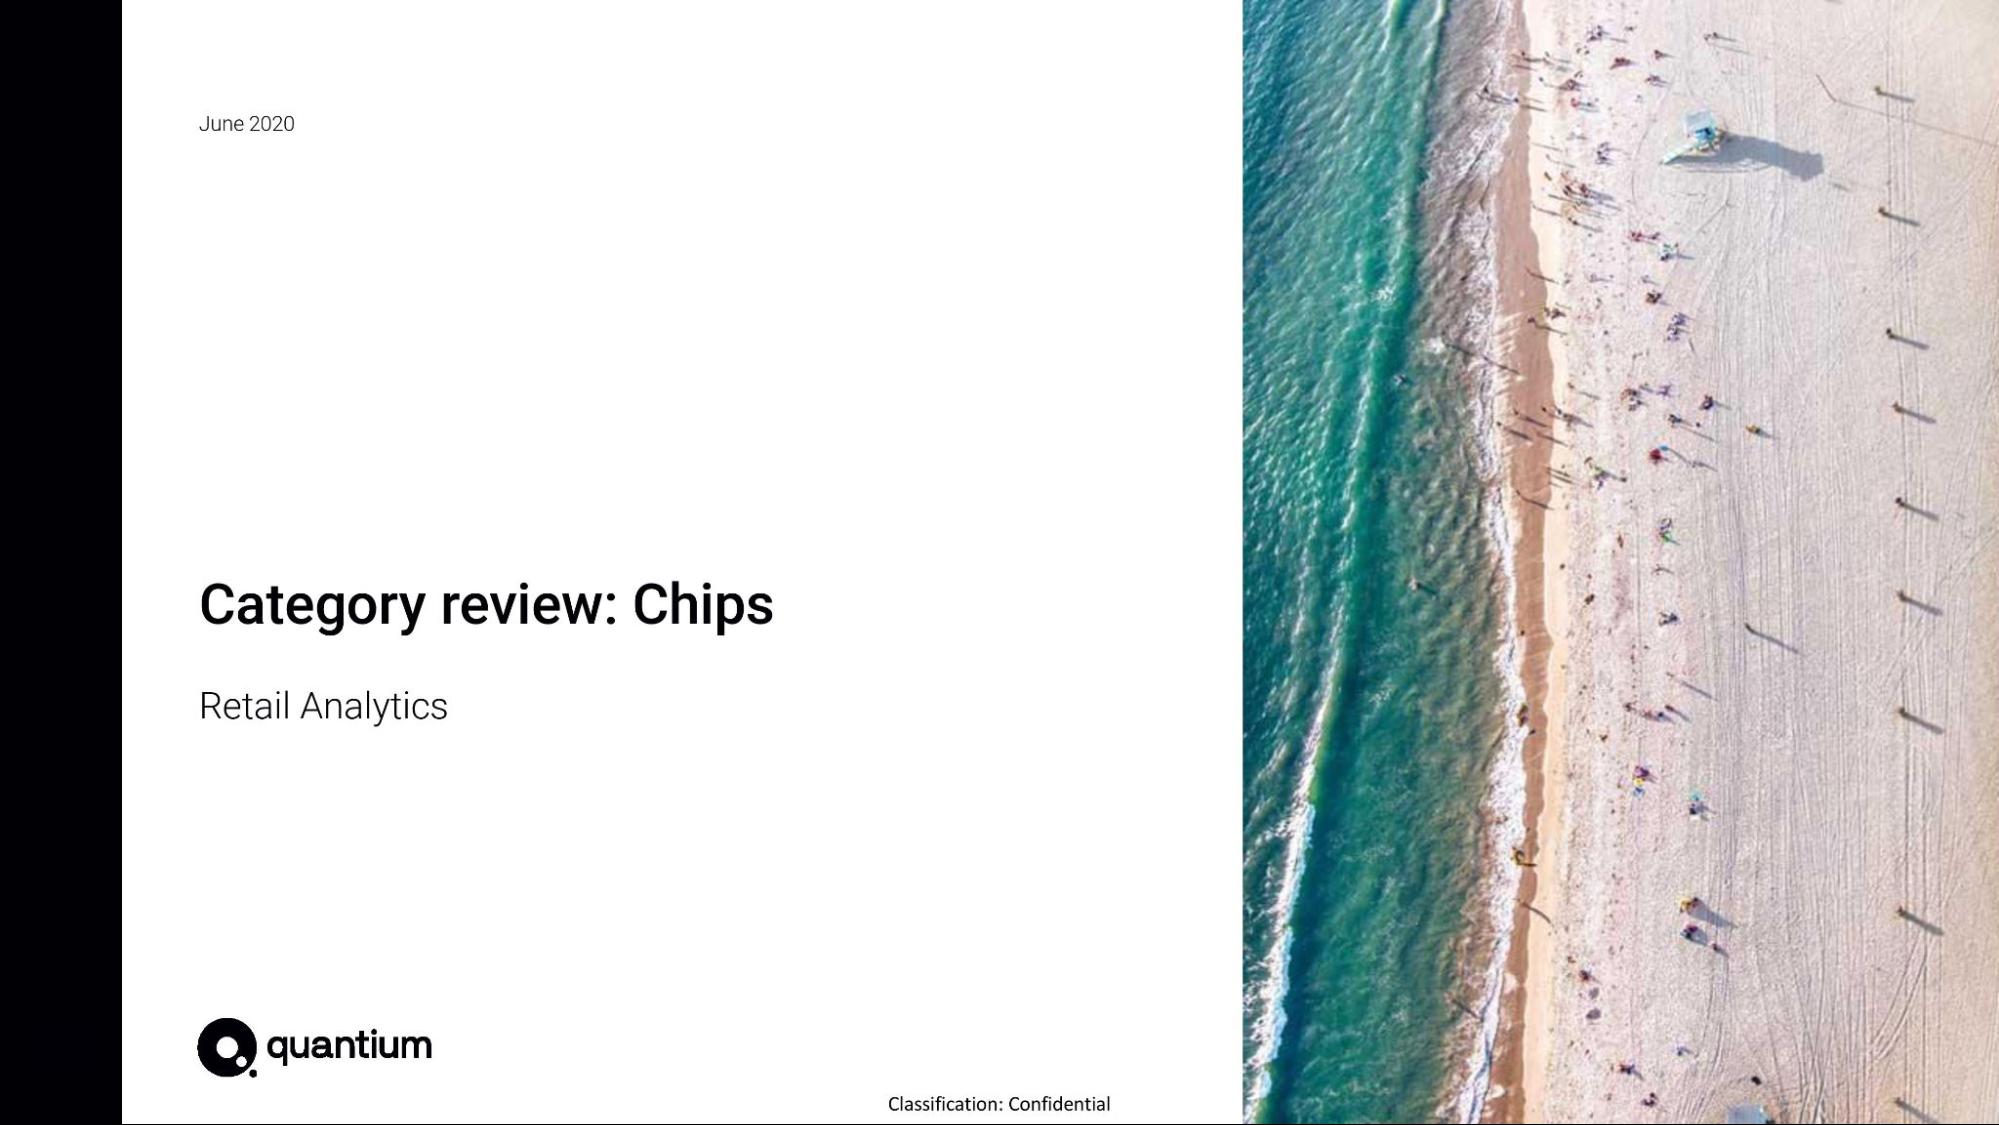
Please feel free to use this template as a guide in preparing your presentation
| ||||||||||||||
4 Now, submit your report here. | Now, submit your report here. | ||||||||||||||
5 Example Answer | Example AnswerGreat work! Take a look at the example answer below to see how a professional would have attempted this task. Think about what you did well and how you can improve. Example Answer - Email to Client
| ||||||||||||||
6 Completion | |||||||||||||||
Finish Line: | |||||||||||||||
1 Resume Snippet | Resume SnippetTake your updated resume and apply for Jobs , Programs , Events and Talent Networks . Quantium Data Analytics Job Simulation on Forage - December 2024
Use our resume guidance here | ||||||||||||||
2 Interview Tip | Interview TipIn a typical interview you’ll be asked “why are you interested in this role?” or “why are you interested in working at our company?”. Use this interview tip to explain why you want the job. “Why are you interested in this role?”I recently participated in Quantium's job simulation on the Forage platform, and it was incredibly useful to understand what it might be like to participate on a data science team at Quantium. I worked on a project to conduct analyses on a client's transaction dataset and identify customer purchasing behaviours to generate insights and provide commercial recommendations. I practised using R and Python and built my Data Visualisation skills in a real-world context. Doing this program confirmed that I really enjoy working on data preparation and customer analytics, and I'm excited to apply these skills on a data science team at a company like Quantium. |