Documentation of the cleaning and manipulation of data | Data Cleaning and Manipulation DocumentationTools Used- Libraries: tidyverse for data manipulation and visualization.
Steps Taken to Clean and Prepare the Data1. Data Import- Loaded daily_activity and sleep_day datasets using read.csv().
2. Initial Exploration- Explored datasets to understand structure and contents:
- Used head() to preview the first few rows.
- Listed column names with colnames().
- Verified data types using str().
3. Checking for Missing Data- Verified the presence of missing values in both datasets using sum(is.na()).
- Result: No missing values found.
4. Removing Duplicates- Checked for duplicate rows using distinct().
- Removed duplicate rows from both datasets:
- daily_activity <- daily_activity %>% distinct()
- sleep_day <- sleep_day %>% distinct()
5. Ensuring Consistent Date Formatting- Reformatted dates to ensure consistency:
- daily_activity$ActivityDate <- as.Date(daily_activity$ActivityDate, format = "%m/%d/%Y")
- sleep_day$ActivityDate <- as.Date(sleep_day$SleepDay, format = "%m/%d/%Y")
6. Alignment of Column Data Types- Verified column data types and ensured alignment using str().
7. Filtering Invalid or Extreme Values- Removed rows with invalid or extreme outlier values:
- Ensured all values in TotalSteps, TotalMinutesAsleep, and SedentaryMinutes were ≥ 0.
- Used filter() to retain only valid data.
8. Merging Datasets- Merged daily_activity and sleep_day datasets on Id and ActivityDate using merge():
- combined_data <- merge(sleep_day, daily_activity, by="Id")
9. Removing Redundant Columns- Dropped unnecessary columns, such as SleepDay, after merging datasets:
- combined_data <- combined_data %>% select(-c(SleepDay))
10. Derived Metrics- Created new metrics to enhance analysis:
- Sleep Efficiency: SleepEfficiency = TotalMinutesAsleep / TotalTimeInBed
- Activity-to-Sedentary Ratio: ActivityToSedentaryRatio = TotalSteps / SedentaryMinutes
11. Summarization by User- Aggregated data to calculate average values per user:
- user_summary <- combined_data %>% group_by(Id) %>% summarise(AvgSteps = mean(TotalSteps, na.rm = TRUE), AvgSleepMinutes = mean(TotalMinutesAsleep, na.rm = TRUE), AvgSedentaryMinutes = mean(SedentaryMinutes, na.rm = TRUE), AvgSleepEfficiency = mean(SleepEfficiency, na.rm = TRUE))
12. Verification- Verified cleaned data using summary statistics:
- summary(combined_data) provided min, max, mean, and median values for key metrics.
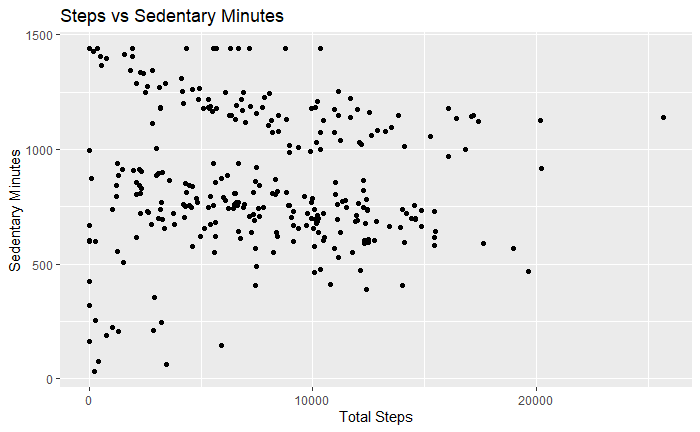
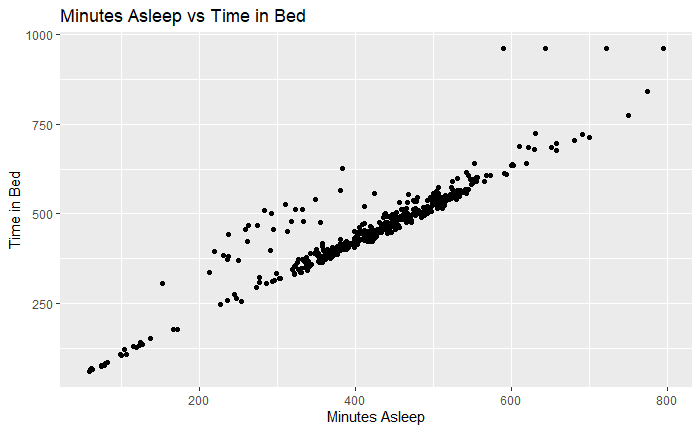
- Visualized relationships to confirm data consistency:
- Scatterplots: TotalSteps vs. SedentaryMinutes, TotalMinutesAsleep vs. TotalTimeInBed.
13. Saving Cleaned Data- Exported cleaned datasets for further analysis:
- Combined data: write.csv(combined_data, "cleaned_combined_data.csv", row.names = FALSE)
- User summary: write.csv(user_summary, "user_summary.csv", row.names = FALSE)
SummaryThe cleaning and manipulation process ensured the dataset’s integrity and consistency, enabling accurate analysis of consumer trends. Key steps included handling duplicates, aligning data formats, creating derived metrics, and verifying the results through visual and statistical checks. The cleaned and transformed data is now ready for insightful analysis to support Bellabeat’s marketing strategy. |