Case study: How does a bike-share navigate speedy success?
CASE STUDY TITLE | Case study: How does a bike-share navigate speedy success? |
AUTHORED BY | Jayoda Jithmini Kulatunga |
DATE | 12/10/2024 |
Executive Summary | This case study explores how Cyclistic, a bike-share company in Chicago, can better understand the usage patterns of its annual members and casual riders. The primary objective is to identify key differences in how these two user groups utilize Cyclistic’s services and to provide actionable insights to guide the company’s strategic initiatives, such as increasing the conversion of casual riders to annual members. The analysis utilized 12 months of historical trip data, focusing on metrics such as trip duration, frequency, and day-of-week trends. Data preparation involved cleaning, standardizing, and merging datasets to ensure consistency and reliability. Advanced tools, including R programming, were used to process and analyze the data, followed by visualizations to present the findings effectively. Key findings revealed that casual riders tend to take longer trips, particularly on weekends, whereas annual members demonstrate consistent usage throughout the week with shorter trip durations. These trends suggest that casual riders likely use the service for leisure, while members use it more for commuting. Based on these insights, the following recommendations were made:
This study underscores the importance of leveraging data analytics to enhance customer segmentation and improve strategic decision-making. By implementing the proposed recommendations, Cyclistic has the potential to boost membership conversion rates and achieve long-term growth. | |||||||||||
|
|
|
|
|
|
|
|
|
|
| ||
Introduction | Cyclistic, a prominent bike-share company based in Chicago, operates in a rapidly growing urban mobility industry. With increasing global interest in sustainable transportation, bike-sharing services like Cyclistic play a pivotal role in reducing traffic congestion and promoting eco-friendly commuting options. The company's innovative approach provides riders with access to docked and dockless bikes, catering to both casual riders and annual members. However, with the bike-sharing industry becoming increasingly competitive, Cyclistic recognizes the need to maximize its customer base by converting casual riders into loyal annual members. This case study focuses on analyzing the distinct usage patterns of Cyclistic’s two primary customer segments: casual riders and annual members. By leveraging historical trip data, the study aims to uncover actionable insights to enhance Cyclistic’s customer retention strategies and drive sustainable growth. The importance of this case lies in its ability to demonstrate how data-driven decision-making can transform business operations, especially in the mobility sector. The findings and recommendations derived from this study provide valuable insights into customer behavior, offering Cyclistic a competitive advantage in the bike-sharing market. | |||||||||||
|
|
|
|
|
|
|
|
|
|
| ||
Statement | Cyclistic, a bike-share company in Chicago, has successfully established itself as a key player in the urban mobility sector. Offering a fleet of docked and dockless bikes, the company serves a diverse customer base, which includes casual riders and annual members. While Cyclistic has experienced steady growth, a significant challenge remains: how to convert casual riders into loyal annual members. Casual riders often contribute to the company’s revenue through one-time or short-term passes, but their inconsistent usage patterns limit Cyclistic’s potential for predictable, long-term income. Annual members, on the other hand, offer greater revenue stability due to their commitment to a subscription model. Understanding the differences in usage behaviors between these two customer segments is essential for creating effective marketing strategies and improving customer retention. Cyclistic’s historical trip data reveals intriguing trends: casual riders tend to take longer trips, predominantly on weekends, while annual members exhibit consistent usage throughout the week. However, the reasons behind these patterns and the factors influencing casual riders' decisions to avoid annual membership remain unclear. This case study aims to address the following key problem: By identifying and addressing this challenge, Cyclistic can refine its business strategies, enhance customer satisfaction, and strengthen its position in the competitive bike-sharing market. | |||||||||||
Decision Criteria | For the Cyclistic Rider Behavior Analysis, when evaluating alternative courses of action, the following decision criteria and assumptions could be considered: Decision Criteria:
Assumptions:
Metrics:
By evaluating these factors, you can make a data-driven decision about which actions to take, such as offering targeted promotions, improving member retention strategies, or optimizing the pricing model. | ||||||||||
|
|
|
|
|
|
|
|
|
|
| |
Data Analysis | The data collected for this case study involves Divvy bike-sharing trips from Q1 2019 and Q1 2020. The dataset was cleaned and merged by ensuring consistent column names and removing irrelevant fields such as latitude, longitude, and personal data. The ride type labels were standardized, and new columns (date, month, day, year, day_of_week) were added for aggregation. | ||||||||||
Key findings from the analysis include:
The analysis also removed any faulty data, such as negative ride lengths, and aggregated ride durations by day of the week to compare patterns. The final data was exported for further visualization in tools like Tableau. | |||||||||||
Alternative Courses of Action | In addressing the analysis of Divvy bike-share data, several alternative strategies could be considered:
Each strategy provides different angles of understanding, with pros related to granularity and clarity but possible risks of simplification or missing broader insights. |
| |||||||||||||
|
|
|
|
|
|
|
|
|
|
|
| ||||
Recommendations | Based on the analysis of the Divvy bike-share data and the alternatives considered, the following recommendations are provided:
RationaleThese strategies directly address the key findings of the analysis, such as the longer trip durations and weekend peaks for casual riders, as well as the higher ride volumes from members. The recommendations aim to increase membership conversions and improve overall rider satisfaction. By aligning the approach with these insights, Divvy can maximize operational efficiency and customer loyalty. |
| |||||||||||||
|
|
|
|
|
|
|
|
|
|
|
| ||||
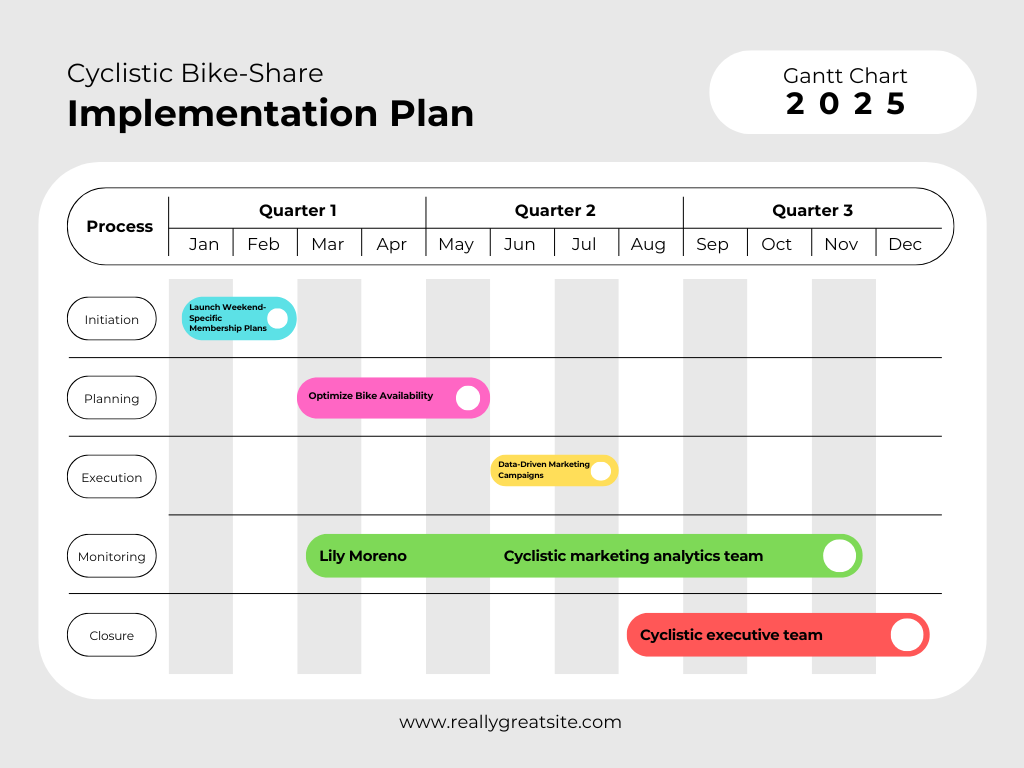
Implementation Plan | 1. Launch Weekend-Specific Membership Plans
2. Optimize Bike Availability
3. Data-Driven Marketing Campaigns
Additional Steps:
This plan should be flexible to adjust based on data feedback and market response. |
| |||||||||||||
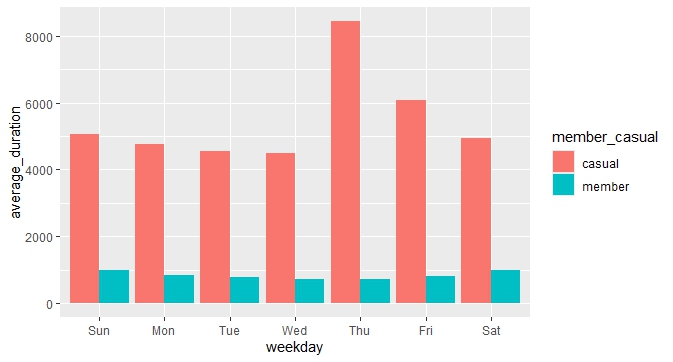
Exhibits and Schedules | To support the findings and recommendations presented in this case study, I have included the following exhibits. These exhibits provide a visual representation of the key trends and patterns derived from the analysis of Cyclistic’s historical trip data. Exhibit 1: Average Trip Duration by Rider TypeThis bar chart illustrates the average trip duration for both casual riders and annual members. It highlights the significant difference in trip durations, particularly during weekends, where casual riders tend to have longer rides. Description:
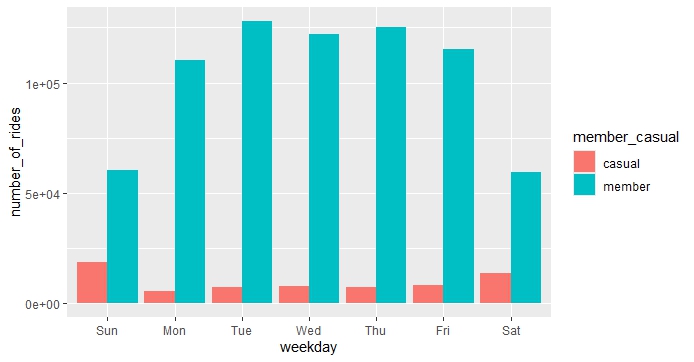
Exhibit 2: Total Number of Rides by Rider TypeThis bar chart displays the total number of rides taken by annual members and casual riders. It emphasizes the volume difference, with members consistently accounting for the majority of rides throughout the week. Description:
Reference to Exhibits in Report
Data Sources and License Information
| |||||||||||
|
|
|
|
|
|
|
|
|
|
| ||
References | Motivate International Inc. (n.d.). Divvy Trip Data. Retrieved from https://divvy-tripdata.s3.amazonaws.com/index.html Motivate International Inc. (n.d.). Data License Agreement. Retrieved from https://www.divvybikes.com/data-license-agreement | |||||||||||