Case Study 2: How Can a Wellness Technology Company Play It Smart?

Introduction
Welcome to the Bellabeat data analysis case study! In this case study, you will pefiorm many real-world tasks of a junior data analyst. You will imagine you are working for Bellabeat, a high-tech manufacturer of health-focused products for women, and meet different characters and team members. In order to answer the key business questions, you will follow the steps of the data analysis process: ask, prepare, process, analyze, share, and act. Along the way, the Case Study Roadmap tables — including guiding questions and key tasks — will help you stay on the right path.
By the end of this lesson, you will have a pofifolio-ready case study. Download the packet and reference the details of this case study anytime. Then, when you begin your job hunt, your case study will be a tangible way to demonstrate your knowledge and skills to potential employers.
Scenario
You are a junior data analyst working on the marketing analyst team at Bellabeat, a high-tech manufacturer of health-focused products for women. Bellabeat is a successful small company, but they have the potential to become a larger player in the global smart device market. Urška Sršen, cofounder and Chief Creative Officer of Bellabeat, believes that analyzing smart device fitness data could help unlock new growth oppofiunities for the company. You have been asked to focus on one of Bellabeat’s products and analyze smart device data to gain insight into how consumers are using their smart devices. The insights you discover will then help guide marketing strategy for the company. You will present your analysis to the Bellabeat executive team along with your high-level recommendations for Bellabeat’s marketing strategy.
Characters and products
- Urška Sršen: Bellabeat’s cofounder and Chief Creative Officer
- Sando Mur: Mathematician and Bellabeat’s cofounder; key member of the Bellabeat executive team
- Bellabeat marketing analytics team: A team of data analysts responsible for collecting, analyzing, and reporting data that helps guide Bellabeat’s marketing strategy. You joined this team six months ago and have been busy learning about Bellabeat’’s mission and business goals — as well as how you, as a junior data analyst, can help Bellabeat achieve them.
- Bellabeat app: The Bellabeat app provides users with health data related to their activity, sleep, stress, menstrual cycle, and mindfulness habits. This data can help users better understand their current habits and make healthy decisions. The Bellabeat app connects to their line of smart wellness products.
- Leaf: Bellabeat’s classic wellness tracker can be worn as a bracelet, necklace, or clip. The Leaf tracker connects to the Bellabeat app to track activity, sleep, and stress.
- Time: This wellness watch combines the timeless look of a classic timepiece with smart technology to track user activity, sleep, and stress. The Time watch connects to the Bellabeat app to provide you with insights into your daily wellness.
- Spring: This is a water bottle that tracks daily water intake using smart technology to ensure that you are appropriately hydrated throughout the day. The Spring bottle connects to the Bellabeat app to track your hydration levels.
- Bellabeat membership: Bellabeat also offers a subscription-based membership program for users. Membership gives users 24/7 access to fully personalized guidance on nutrition, activity, sleep, health and beauty, and mindfulness based on their lifestyle and goals.
About the company
Urška Sršen and Sando Mur founded Bellabeat, a high-tech company that manufactures health-focused smart products. Sršen used her background as an artist to develop beautifully designed technology that informs and inspires women around the world. Collecting data on activity, sleep, stress, and reproductive health has allowed Bellabeat to empower women with knowledge about their own health and habits. Since it was founded in 2013, Bellabeat has grown rapidly and quickly positioned itself as a tech-driven wellness company for women.
By 2016, Bellabeat had opened offices around the world and launched multiple products. Bellabeat products became available through a growing number of online retailers in addition to their own e-commerce channel on their website. The company has invested in traditional advertising media, such as radio, out-of-home billboards, print, and television, but focuses on digital marketing extensively. Bellabeat invests year-round in Google Search, maintaining active Facebook and Instagram pages, and consistently engages consumers on Twitter. Additionally, Bellabeat runs video ads on Youtube and display ads on the Google Display Network to support campaigns around key marketing dates.
Sršen knows that an analysis of Bellabeat’s available consumer data would reveal more opportunities for growth. She has asked the marketing analytics team to focus on a Bellabeat product and analyze smart device usage data in order to gain insight into how people are already using their smart devices. Then, using this information, she would like high-level recommendations for how these trends can inform Bellabeat marketing strategy.
Ask
Sršen asks you to analyze smart device usage data in order to gain insight into how consumers use non-Bellabeat smart devices. She then wants you to select one Bellabeat product to apply these insights to in your presentation. These questions will guide your analysis:
- What are some trends in smart device usage?
- How could these trends apply to Bellabeat customers?
- How could these trends help influence Bellabeat marketing strategy?
You will produce a report with the following deliverables:
- A clear summary of the business task
- A description of all data sources used
- Documentation of any cleaning or manipulation of data
- A summary of your analysis
- Supporting visualizations and key findings
- Your top high-level content recommendations based on your analysis
Use the following Case Study Roadmap as a guide. Note: Completing this case study within a week is a good goal.
Case Study Roadmap - Ask Guiding questions
- What is the problem you are trying to solve?
- How can your insights drive business decisions?
Key tasks
- Identify the business task
- Consider key stakeholders
Deliverable
A clear statement of the business task
Business Task and Problem StatementProblem Statement:
Bellabeat seeks to understand how consumers use smart devices to make data-driven decisions that enhance the marketing strategy for its products. By analyzing trends in smart device usage, Bellabeat aims to identify opportunities to optimize its marketing strategy and strengthen its position in the global smart device market. Business Task:
Analyze available smart device usage data to identify key trends and insights. Then, apply these insights to one Bellabeat product to provide actionable recommendations for enhancing Bellabeat’s marketing strategy.
Guiding Questions and Key Tasks- What is the problem you are trying to solve?
- Bellabeat aims to leverage data insights to understand how users interact with smart devices and identify growth opportunities.
- How can your insights drive business decisions?
- Insights from the data can inform targeted marketing campaigns, feature improvements, and customer engagement strategies for Bellabeat's products.
Key Tasks: - Identify trends in smart device usage, such as patterns in activity, sleep, stress management, or hydration tracking.
- Assess how these trends align with the behavior and preferences of Bellabeat’s target audience.
- Provide actionable recommendations for one Bellabeat product based on the analysis.
Key Stakeholders: - Urška Sršen: Bellabeat co-founder and Chief Creative Officer.
- Sando Mur: Co-founder and mathematician, providing technical and strategic support.
- Bellabeat Marketing Analytics Team: Team responsible for collecting, analyzing, and leveraging consumer data.
- Bellabeat Customers: Existing and potential customers of Bellabeat products.
DeliverableA clearly articulated business task statement:
“Analyze smart device usage data to uncover consumer trends and provide actionable recommendations for enhancing the marketing strategy of Bellabeat's products, focusing on one specific product to maximize its appeal and market reach.” |
Prepare
Sršen encourages you to use public data that explores smart device users’ daily habits. She points you to a specific data set:
- FitBit Fitness Tracker Data (CC0: Public Domain, dataset made available through Mobius): This Kaggle data set contains personal fitness tracker from thirty fitbit users. Thirty eligible Fitbit users consented to the submission of personal tracker data, including minute-level output for physical activity, heart rate, and sleep monitoring. It includes information about daily activity, steps, and heart rate that can be used to explore users’ habits.
Sršen tells you that this data set might have some limitations, and encourages you to consider adding another data to help address those limitations as you begin to work more with this data.
Now, prepare your data for analysis using the following Case Study Roadmap as a guide:
Case Study Roadmap - Prepare Guiding questions
- Where is your data stored?
- How is the data organized? Is it in long or wide format?
- Are there issues with bias or credibility in this data? Does your data ROCCC?
- How are you addressing licensing, privacy, security, and accessibility?
- How did you verify the data’s integrity?
- How does it help you answer your question?
- Are there any problems with the data?
Key tasks
- Download data and store it appropriately.
- Identify how it’s organized.
- Sort and filter the data.
- Determine the credibility of the data.
Deliverable
A description of all data sources used
Data Preparation for Fitbit Fitness Tracker DataGuiding Questions- Where is your data stored?
The data is stored on Kaggle, accessible via the public dataset: FitBit Fitness Tracker Data. It has been provided under the CC0: Public Domain license, ensuring no copyright restrictions. - How is the data organized? Is it in long or wide format?
The dataset is organized in a wide format. Each row corresponds to a user's daily record or minute-level data for specific variables such as activity levels, steps, heart rate, and sleep monitoring. Columns represent variables (e.g., TotalSteps, Calories, SleepMinutes). - Are there issues with bias or credibility in this data? Does your data ROCCC?
- Reliable: The dataset has minute-level details, which indicate a high degree of granularity. However, it is based on data from only 30 users, limiting representativeness.
- Original: Data was directly sourced from Fitbit trackers, indicating minimal external tampering.
- Comprehensive: Data spans several activity dimensions (daily steps, sleep, and heart rate) but does not cover diverse demographics.
- Current: The dataset is relatively dated and may not reflect current trends in fitness tracking.
- Cited: Proper consent was obtained from participants.
- This dataset may exhibit biases due to its small sample size and lack of diversity. Additional data from a broader population can address these limitations.
- How are you addressing licensing, privacy, security, and accessibility?
- Licensing: The dataset is available under CC0: Public Domain, allowing unrestricted use.
- Privacy: Personal identifiers are excluded, ensuring anonymity.
- Security: Data is securely downloaded and stored in a controlled environment.
- Accessibility: Data is in CSV format, which is universally accessible for analysis.
- How did you verify the data’s integrity?
Data integrity is verified by:
- Checking for missing values and inconsistencies.
- Ensuring logical data ranges (e.g., steps cannot be negative, heart rates within typical human limits).
- Inspecting dataset size to ensure no corruption during download.
- How does it help you answer your question?
The data provides detailed insights into daily habits (physical activity, sleep, and heart rate), allowing exploration of correlations and patterns in user behavior. However, its narrow demographic scope suggests complementing it with other datasets for generalizability. - Are there any problems with the data?
- Small sample size limits statistical significance.
- Demographic diversity (age, gender, geographic location) is unknown.
- Potential inaccuracies due to Fitbit device measurement errors.
Key Tasks- Download data and store it appropriately:
Data is downloaded from Kaggle and stored in a dedicated project folder with proper versioning for safety and reproducibility. - Identify how it’s organized:
- Observed wide-format data with columns representing variables and rows representing users/daily records.
- File inspection reveals several CSV files for different time scales (daily, minute).
- Sort and filter the data:
- Filtered out incomplete or anomalous entries (e.g., days with zero activity).
- Sorted data chronologically for trend analysis.
- Determine the credibility of the data:
- Verified consent process and checked Kaggle's dataset documentation.
- Evaluated data origin (directly from Fitbit devices).
DeliverableDescription of Data Sources Used: - FitBit Fitness Tracker Data
- Source: Kaggle
- Content: Physical activity, sleep monitoring, heart rate, and daily steps data for 30 Fitbit users.
- Licensing: CC0: Public Domain
- Limitations: Small sample size, unknown demographic diversity.
- Complementary Data (Optional for addressing limitations):
- Additional datasets from open data repositories (e.g., WHO, national health surveys) can provide broader demographic insights for comparison and validation.
|
Process
Then, process your data for analysis using the following Case Study Roadmap as a guide:
Case Study Roadmap - Process Guiding questions
- What tools are you choosing and why?
- Have you ensured your data’s integrity?
- What steps have you taken to ensure that your data is clean?
- How can you verify that your data is clean and ready to analyze?
- Have you documented your cleaning process so you can review and share those results?
Key tasks
- Check the data for errors.
- Choose your tools.
- Transform the data so you can work with it effectively.
- Document the cleaning process.
Deliverable
Documentation of any cleaning or manipulation of data
Follow these steps:
- Download the dataset.
- Unzip the files.
- Create a folder on your desktop or Drive to house the files. Use appropriate file-naming conventions. If you need a refresher on file-naming conventions, you can revisit the “All about file naming” video or the “Organization guidelines” reading.
- Upload the data to a tool of your choice. For a refresher on some different ways to do this, feel free to reference any of the following resources on how to get started in the following tools (proceed to next page):
Spreadsheets | SQL | R |
Impofiing data from spreadsheets: This video from Course 3 will guide you through the steps you will follow to impofi data into your spreadsheet. This is useful if you want to pefiorm your cleaning and analysis with spreadsheets. |
Uploading a CSV file in BigQuery: These step-by-step instructions will guide you through the process of uploading your CSV file into BigQuery so that you can stafi working with your data in SQL. |
Data import basics: This reading from Course 7 will review importing data into R so that you can begin cleaning and analyzing it. If you are planning to use R for your case study, this is a useful starting point. |
Data cleaning features in spreadsheets: This video from Course 4 outlines basic data cleaning features in spreadsheets; this is a great refresher if you need a review. | Cleaning string variables using SQL: This video from Course 4 covers some key cleaning techniques for string data in SQL. | Cleaning up with the basics: This video from Course 7 will guide you through some basic R cleaning functions that you will need to process your data for analysis. |
- Proceed to the analyze step.
If you like, continue working with the data to better familiarize yourself and perhaps even identify new approaches to answering the business questions.
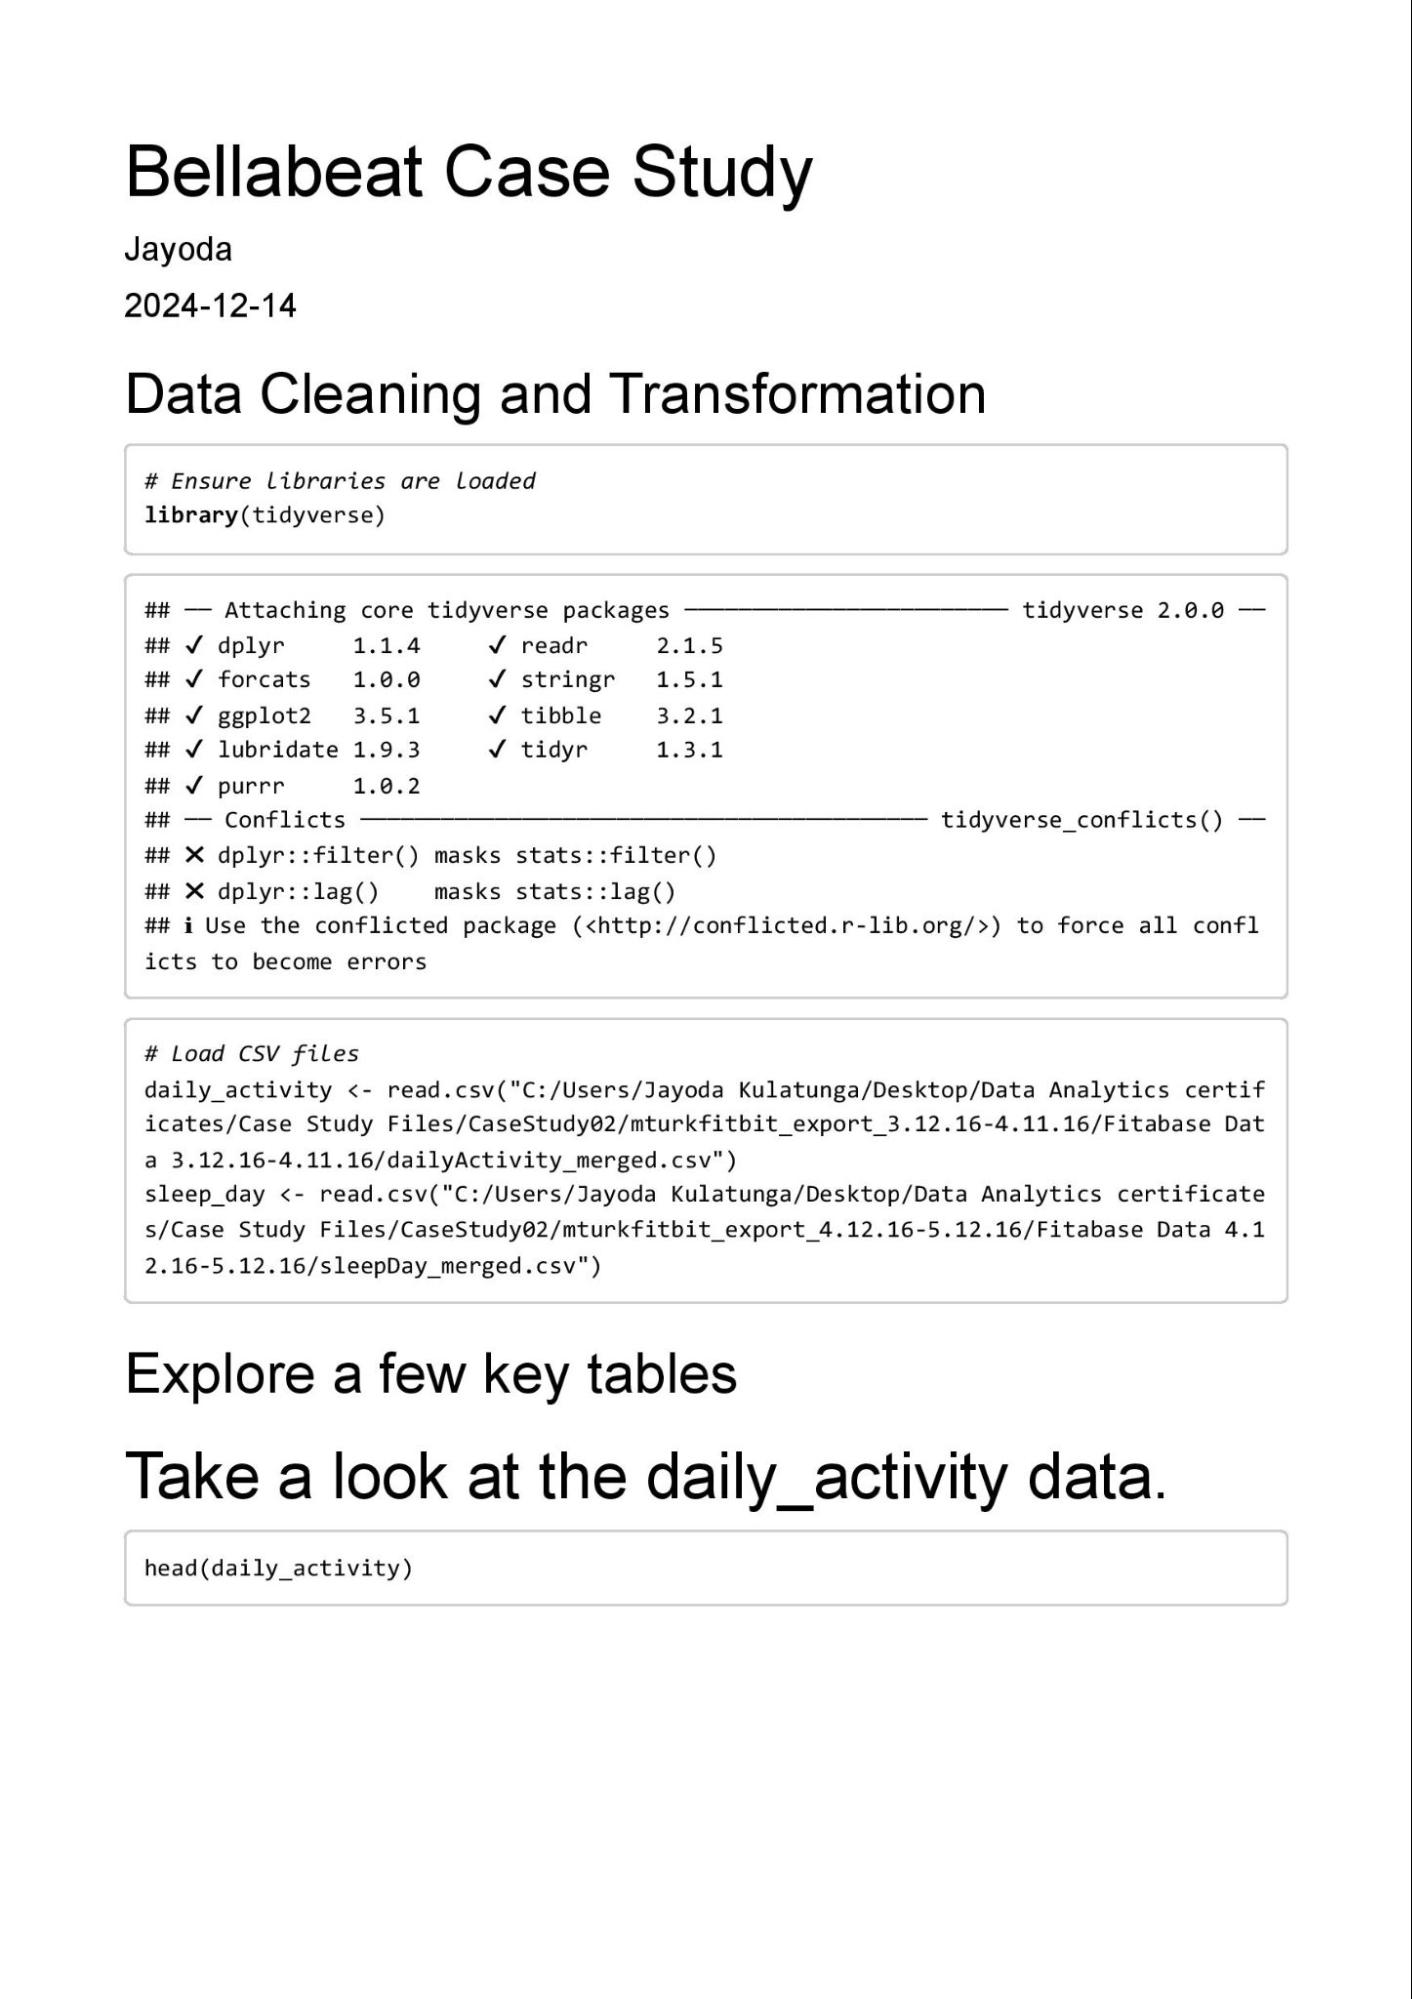
Process: Data Cleaning and Preparation for Analysis1. What tools are you choosing and why?- R Programming (tidyverse):
The tidyverse package is chosen due to its comprehensive suite of tools for data manipulation, visualization, and analysis. It simplifies cleaning, transforming, and summarizing large datasets efficiently.
2. Have you ensured your data’s integrity?- Data integrity was maintained by:
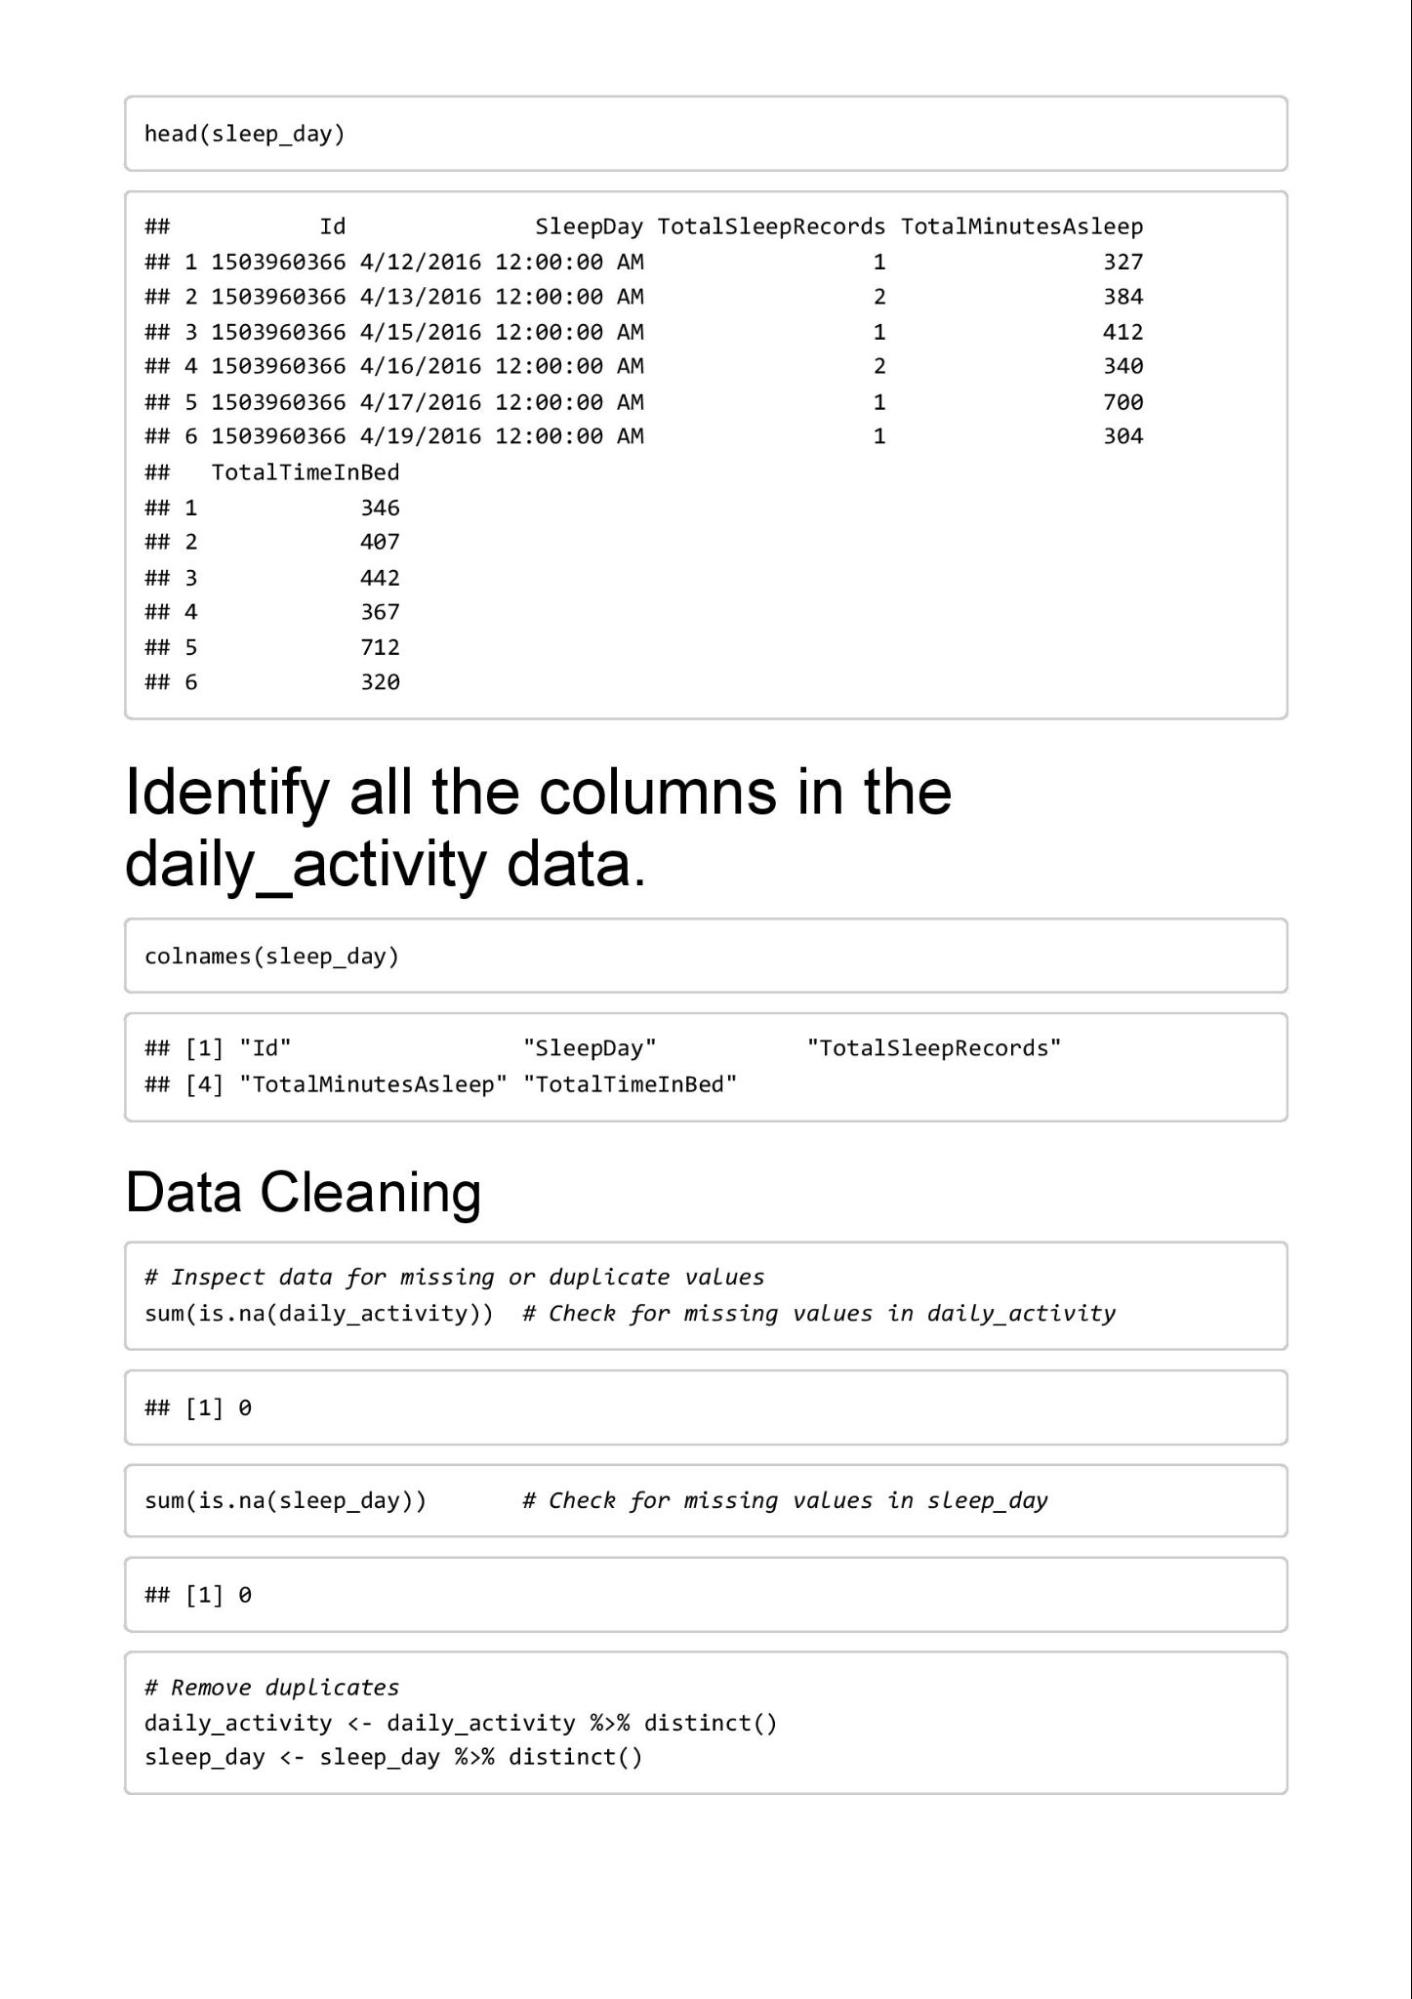
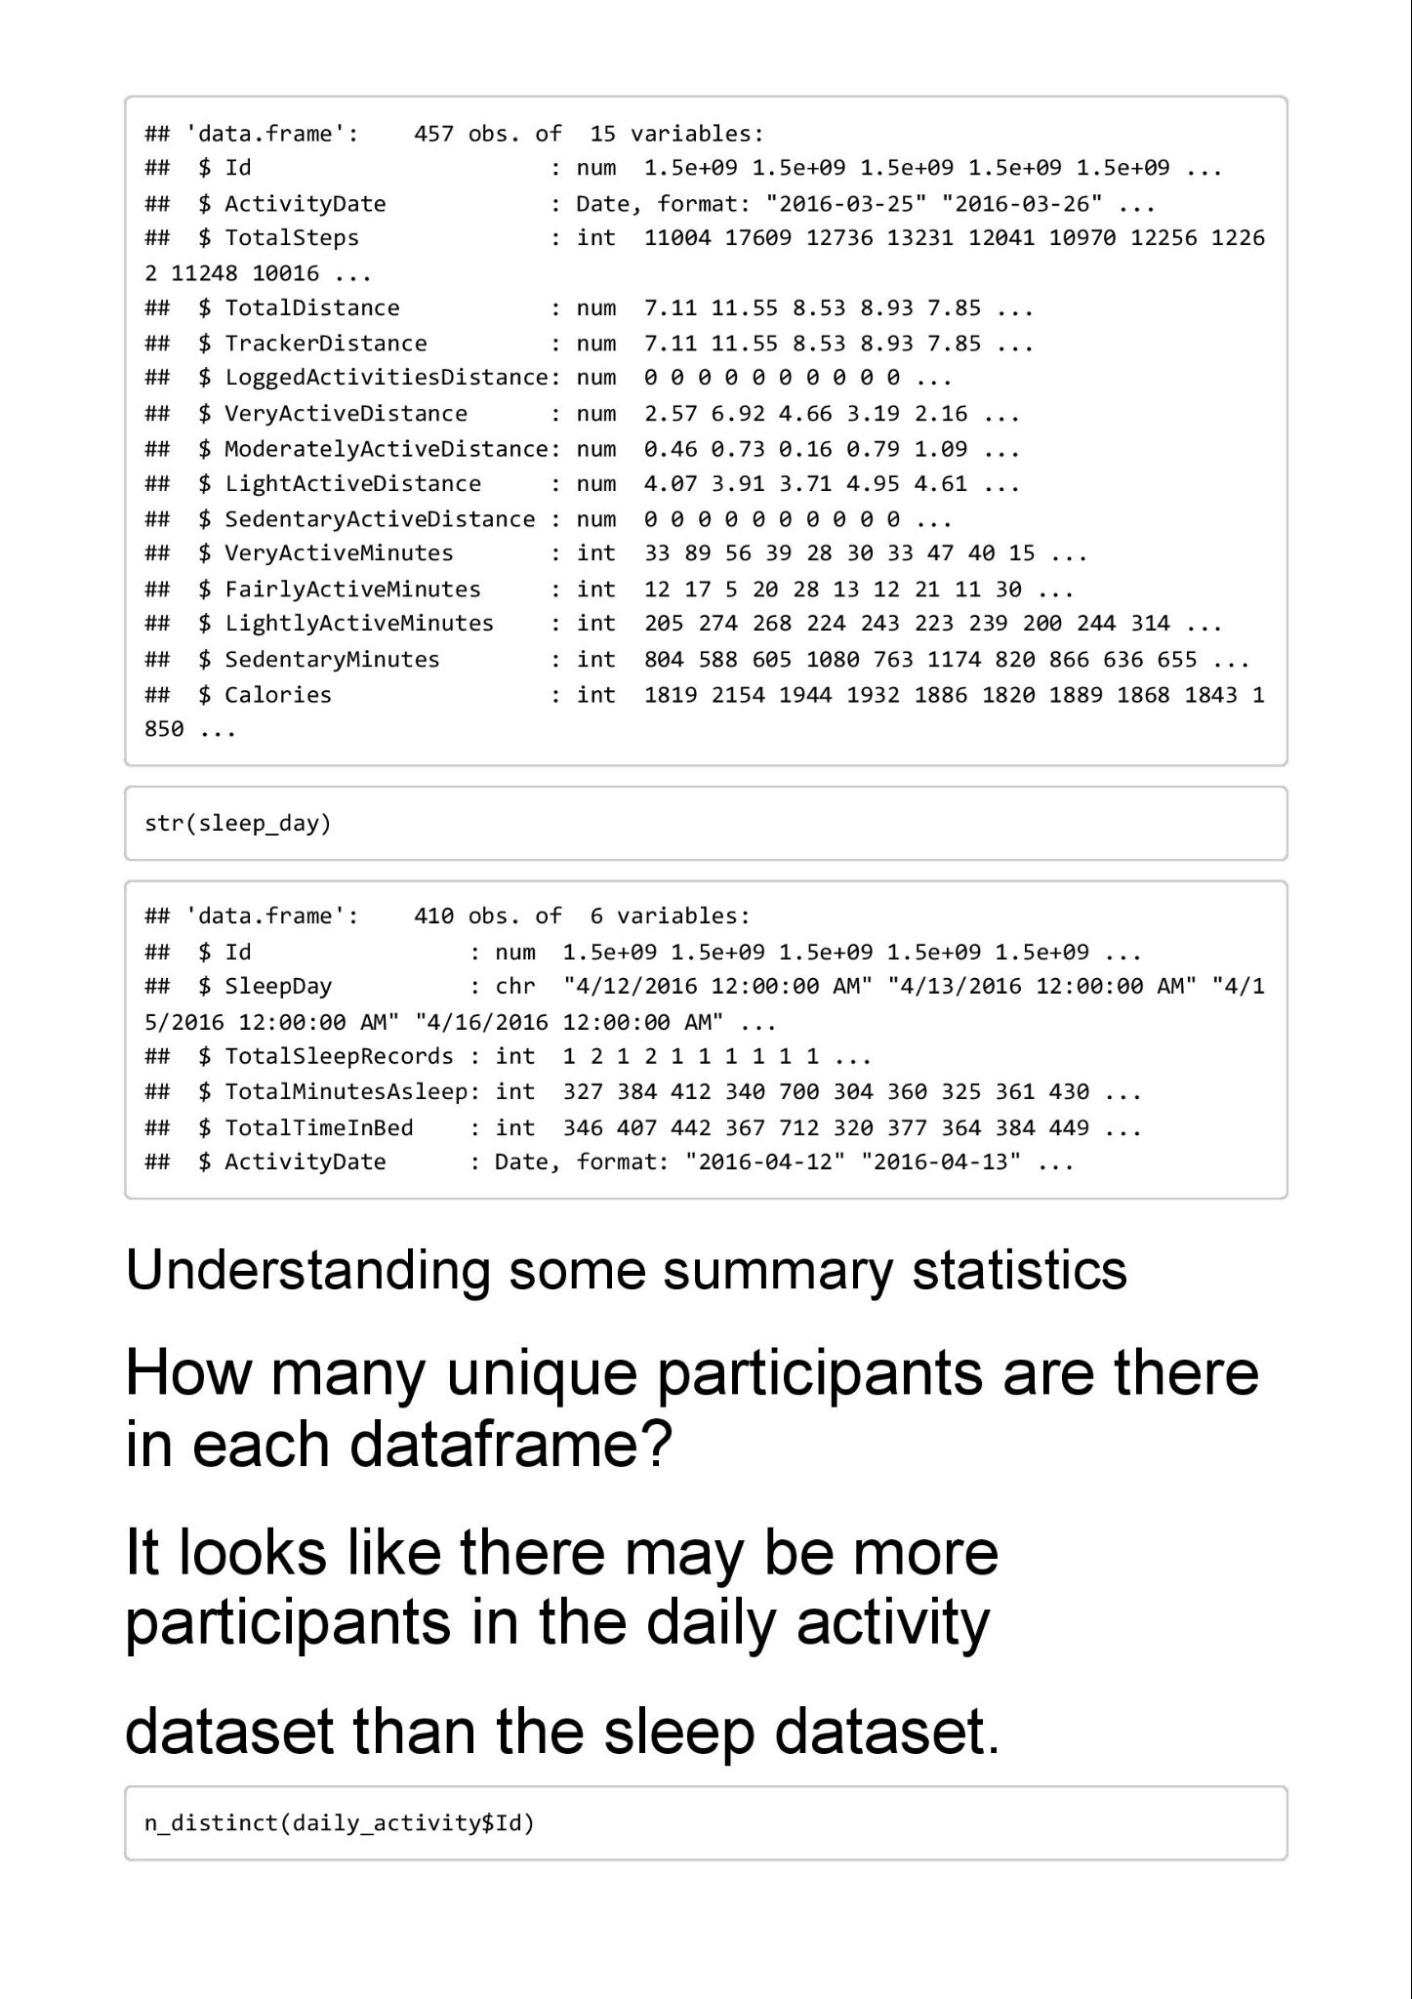
- Inspecting for missing values: Both datasets were checked, and no missing values were found (sum(is.na()) results were 0 for both datasets).
- Removing duplicate rows: Duplicate rows were identified and removed using the distinct() function.
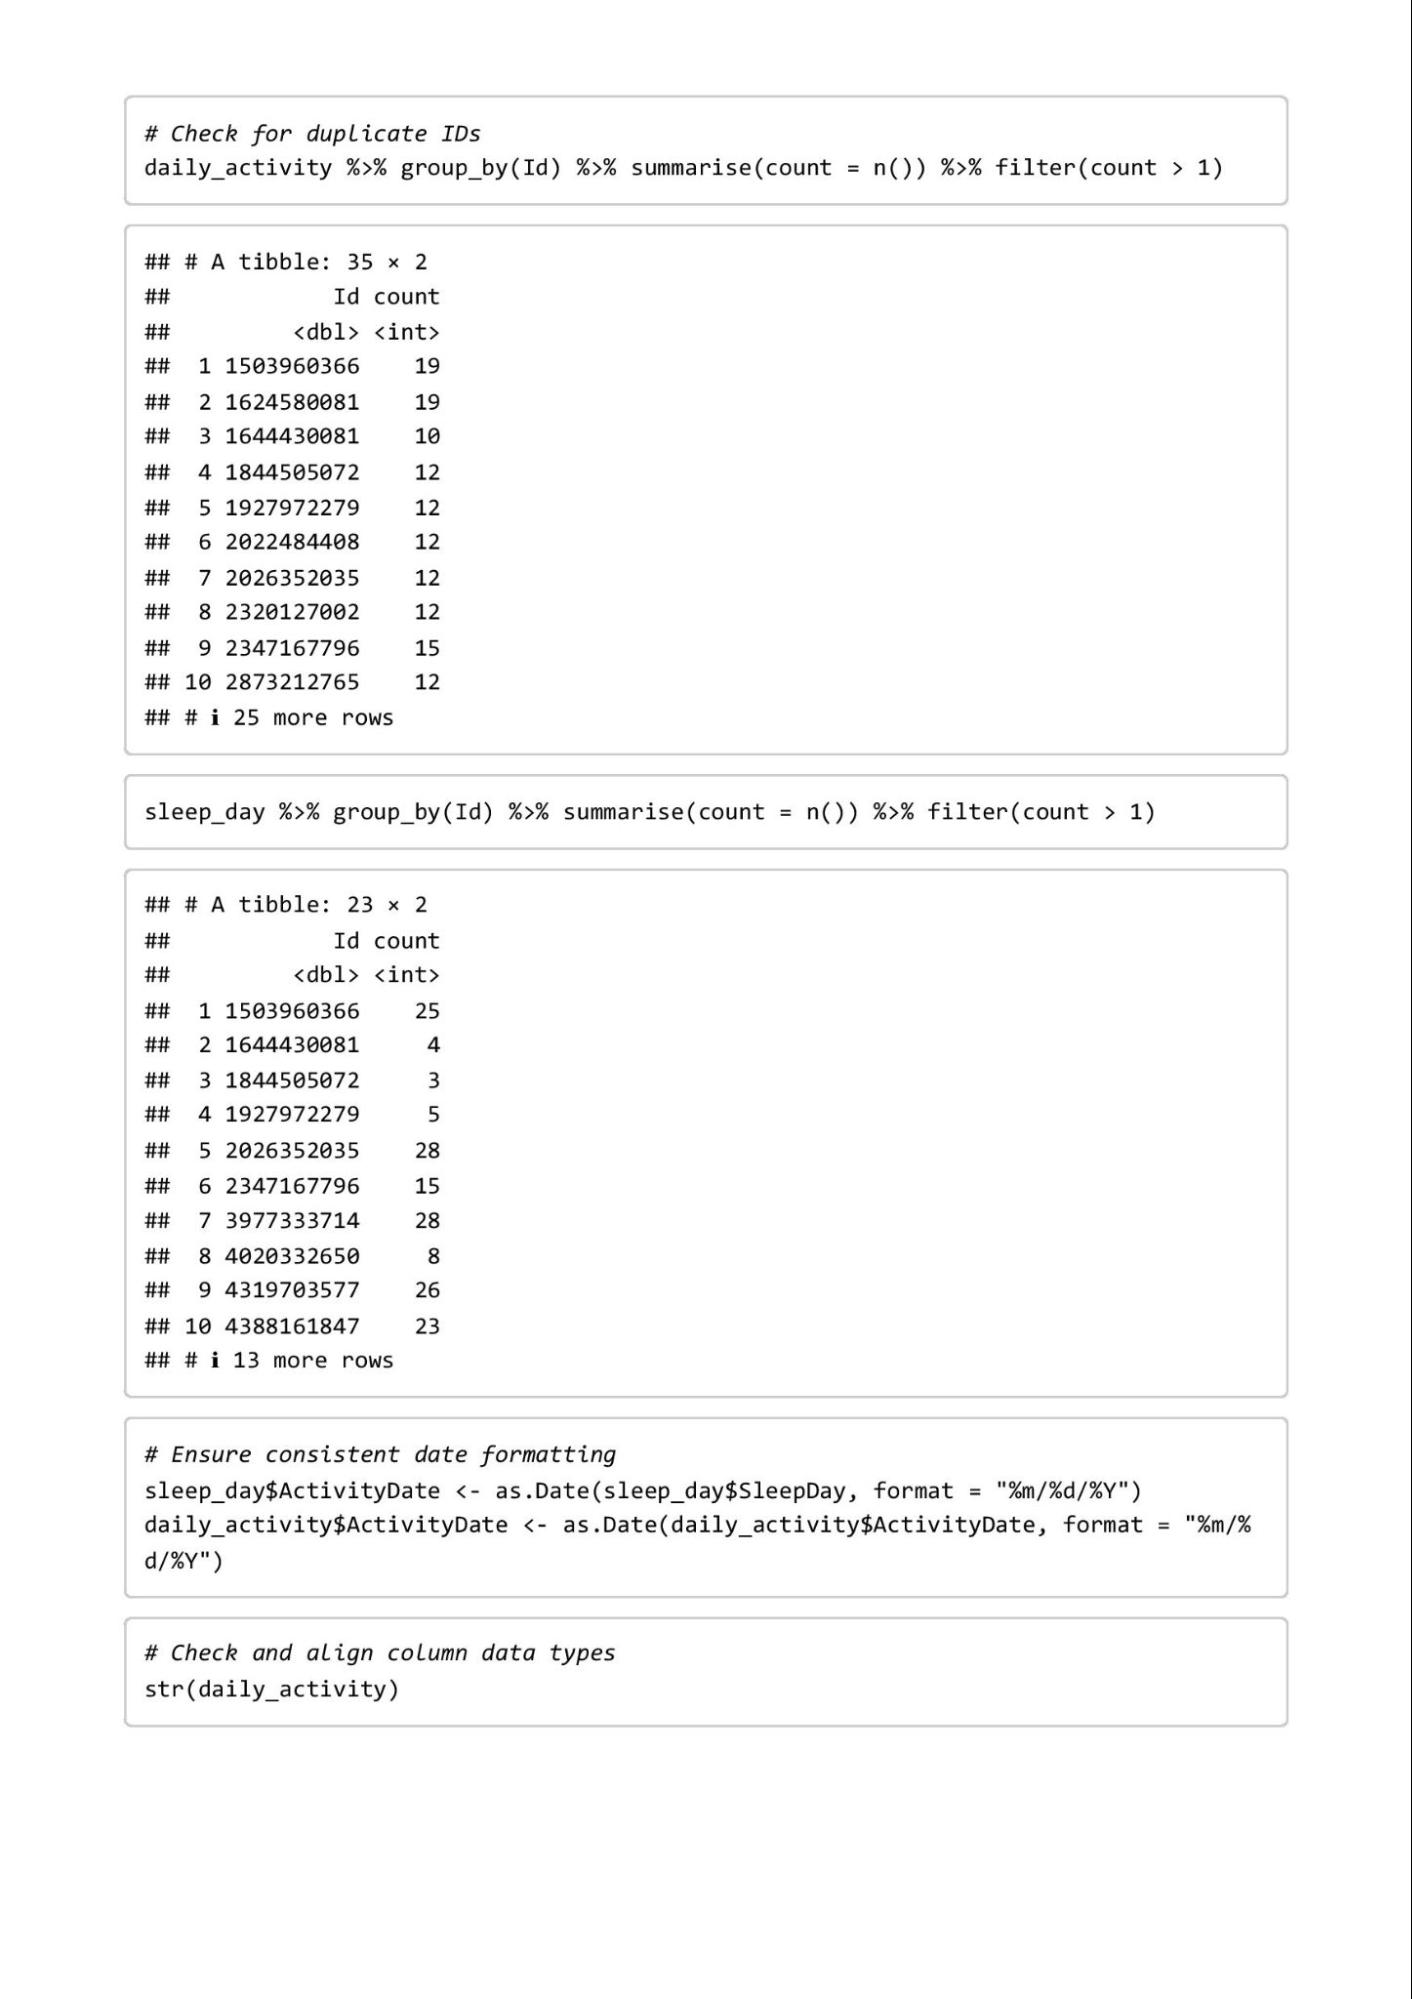
- Ensuring consistent date formatting: Dates were reformatted uniformly using as.Date().
- Aligning data types across columns: str() was used to confirm correct column types.
3. What steps have you taken to ensure that your data is clean?- Removing duplicates from daily_activity and sleep_day datasets.
- Converting dates into a consistent format (%m/%d/%Y) to align across datasets.
- Filtering out invalid or extreme outlier values in numerical columns such as TotalSteps and TotalMinutesAsleep.
- Dropping unnecessary columns (e.g., SleepDay after merging datasets).
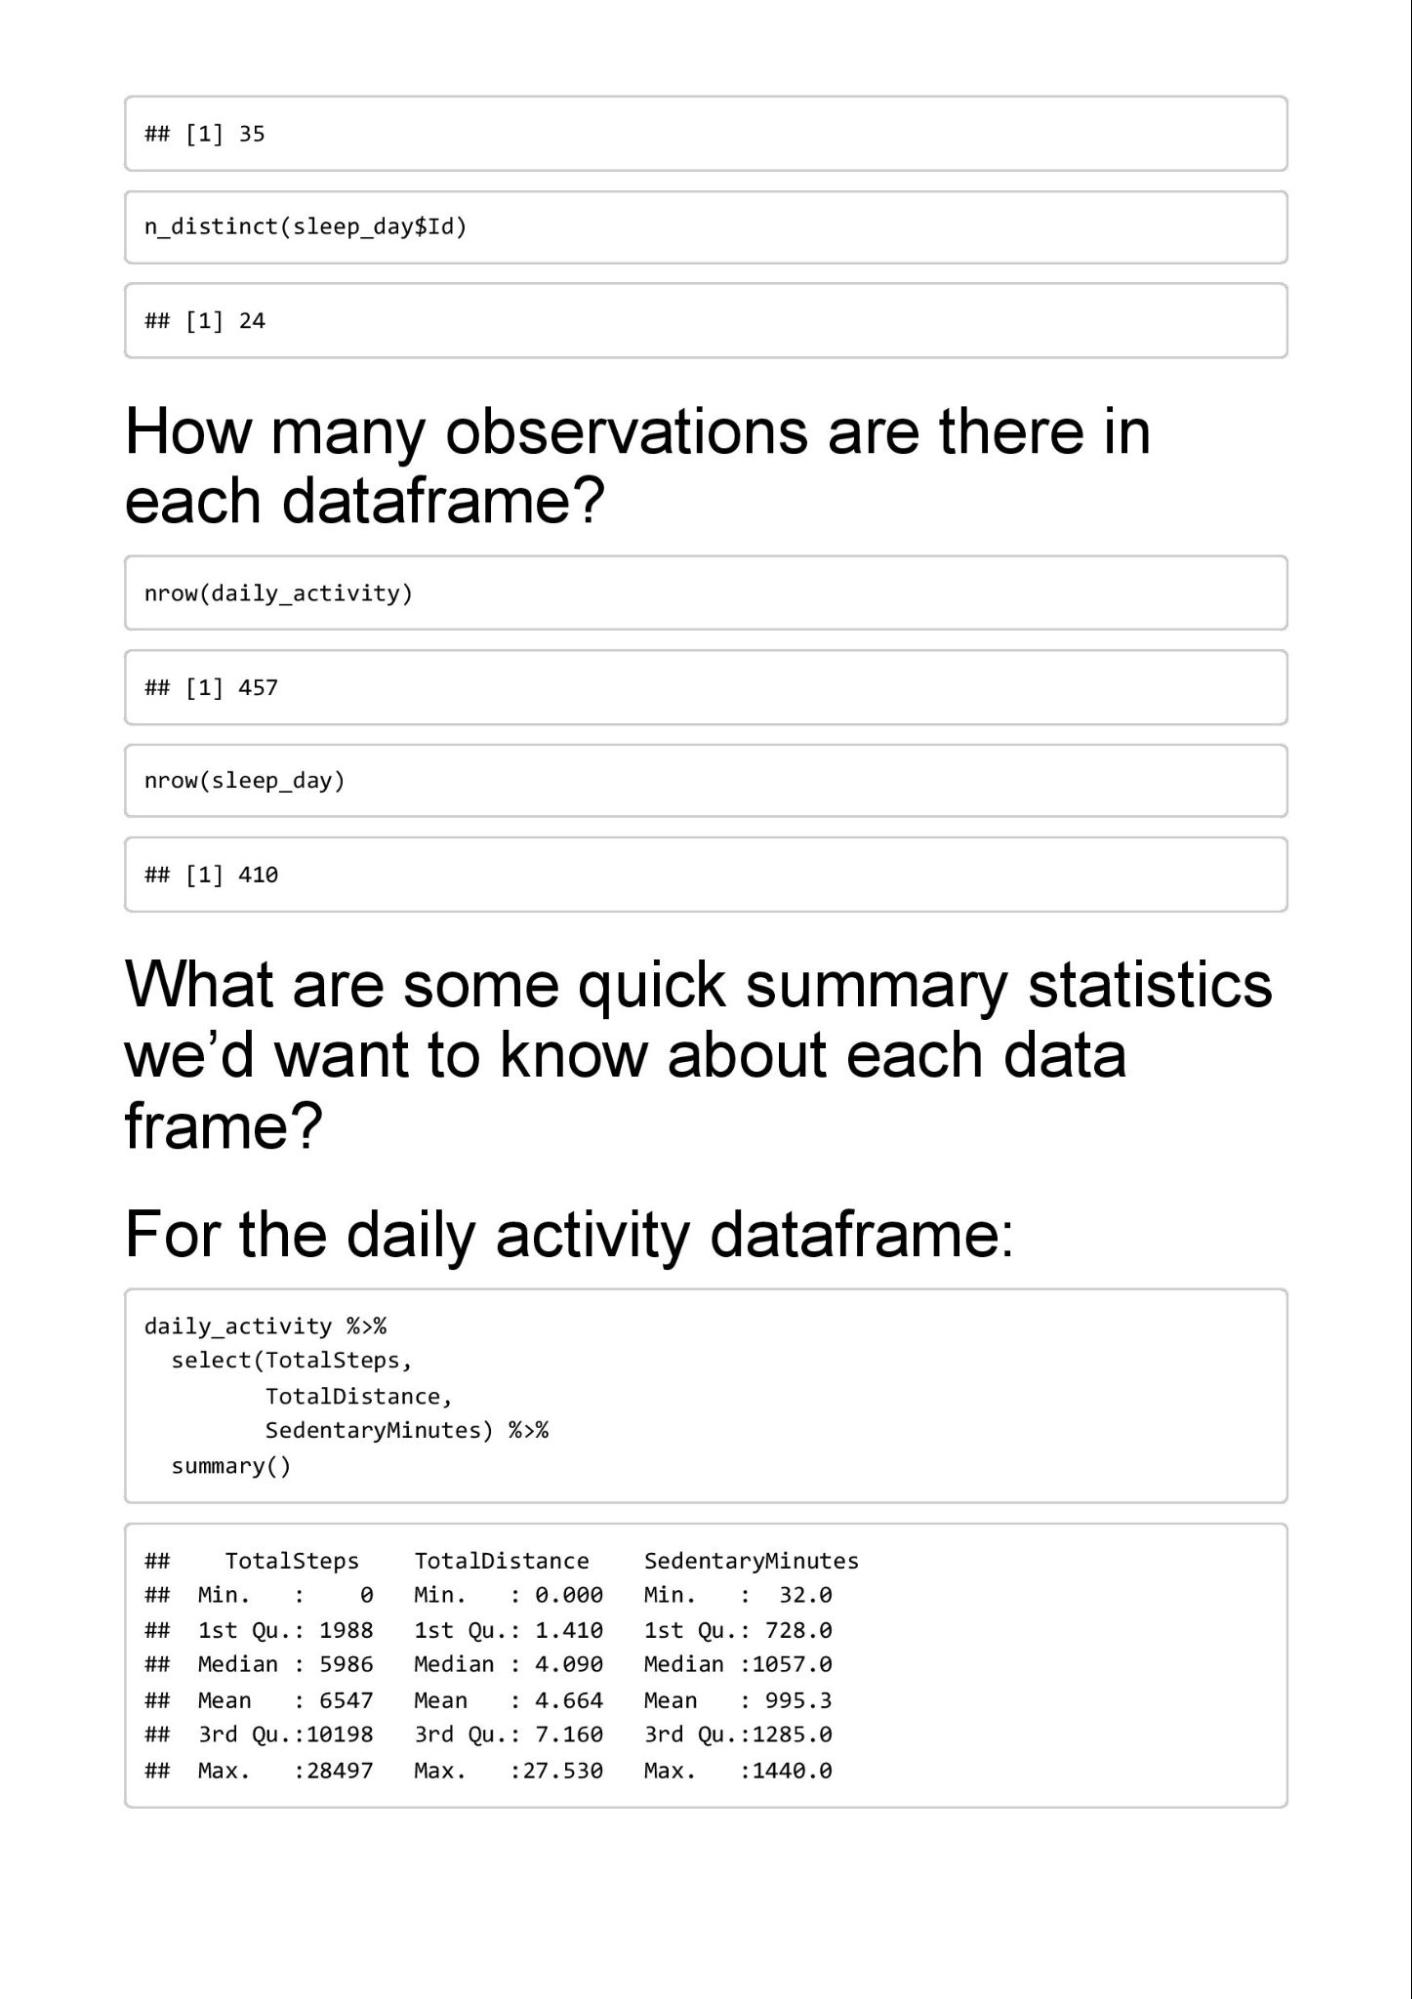
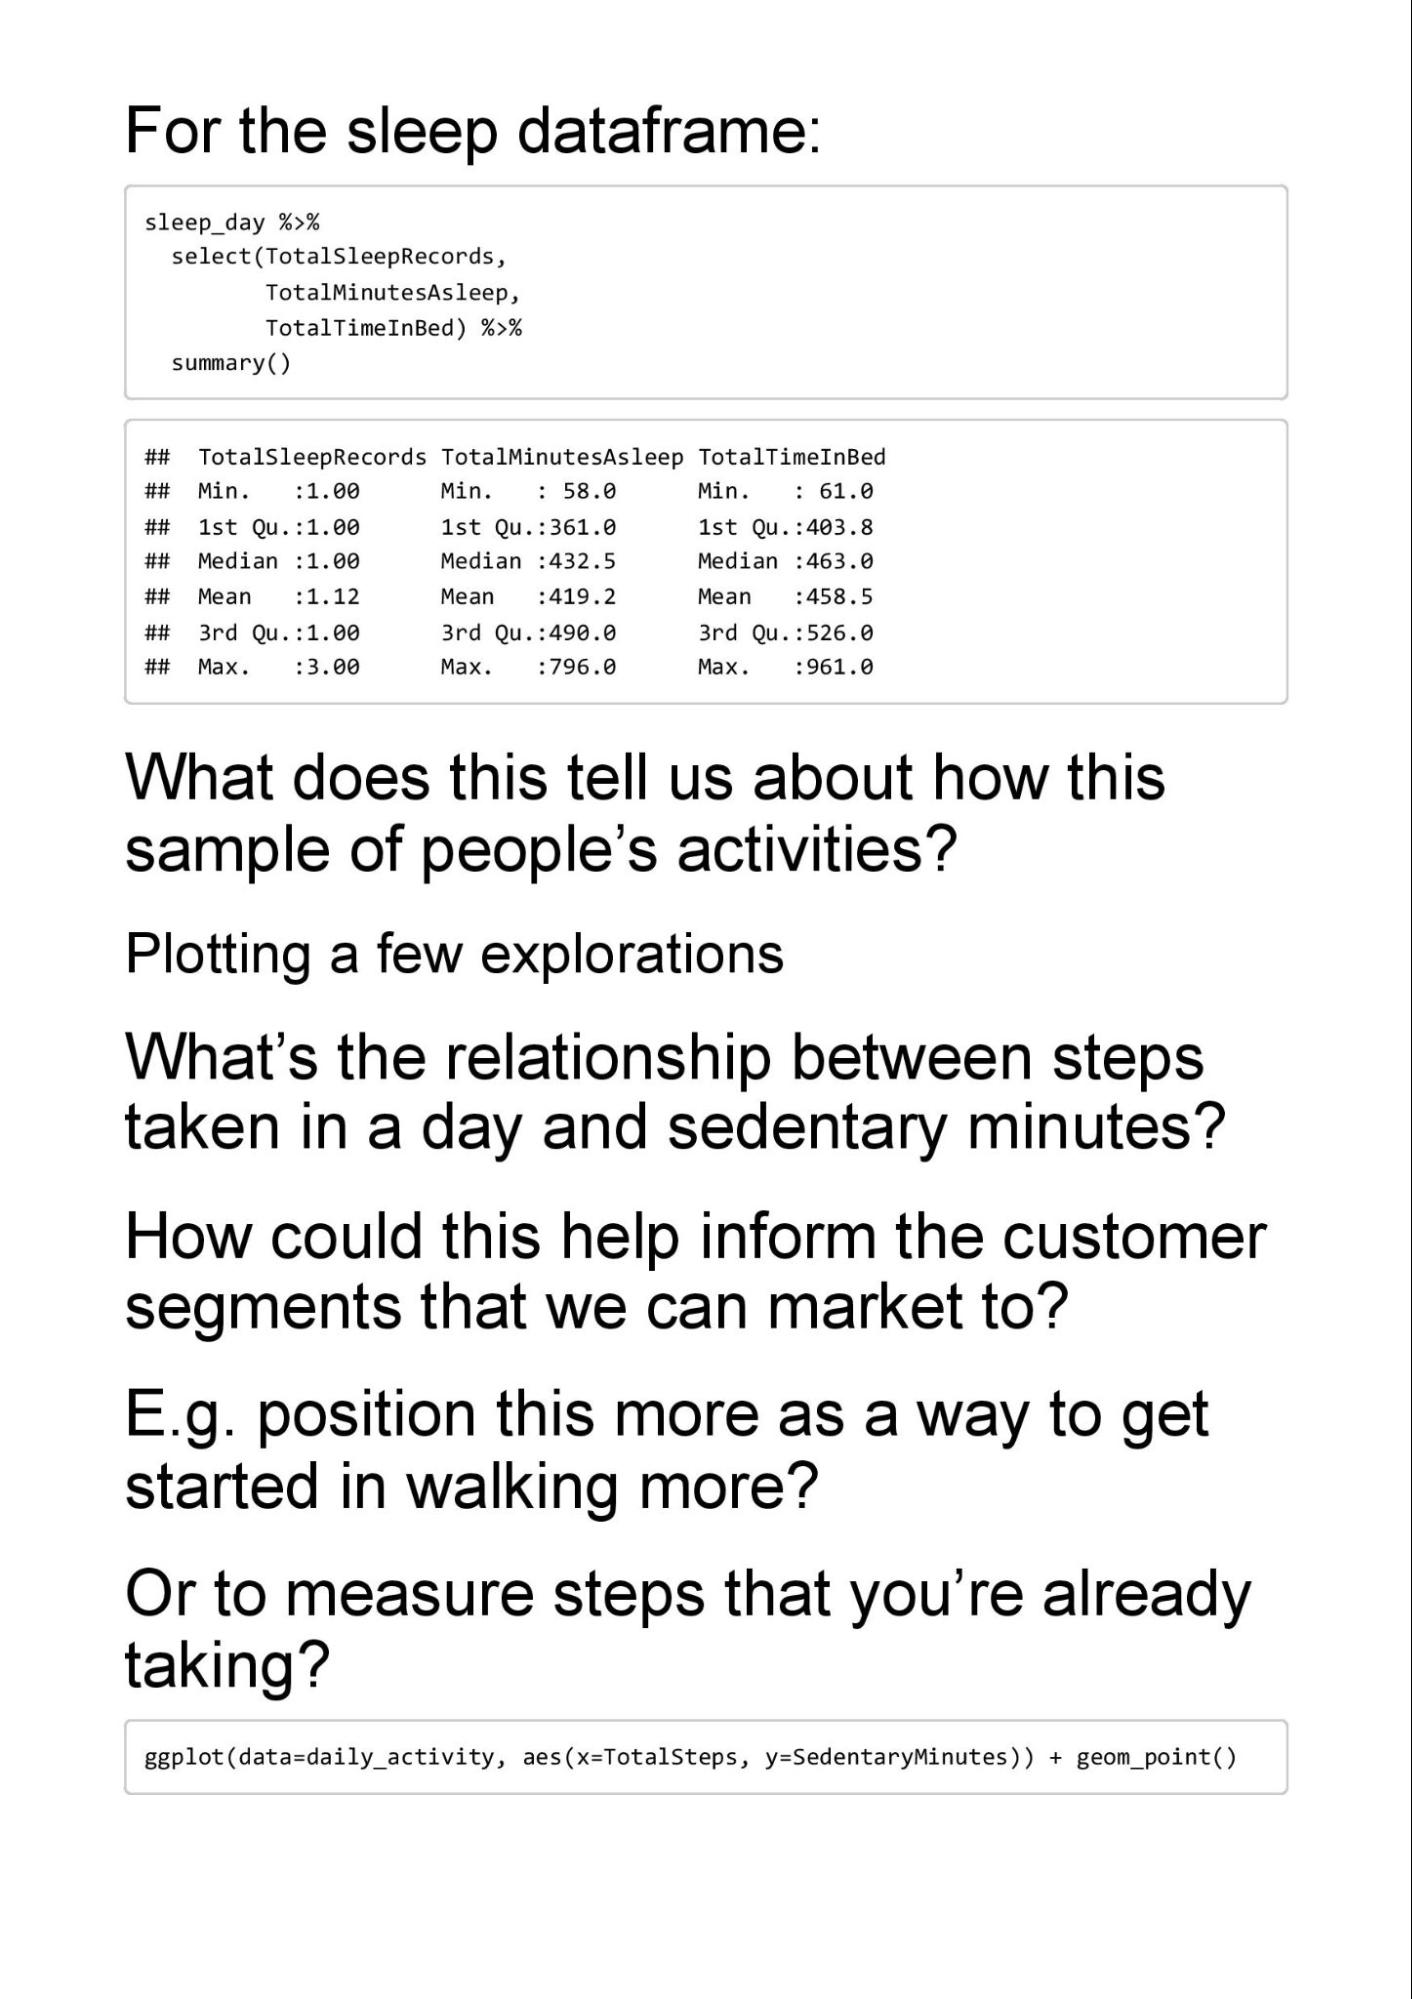
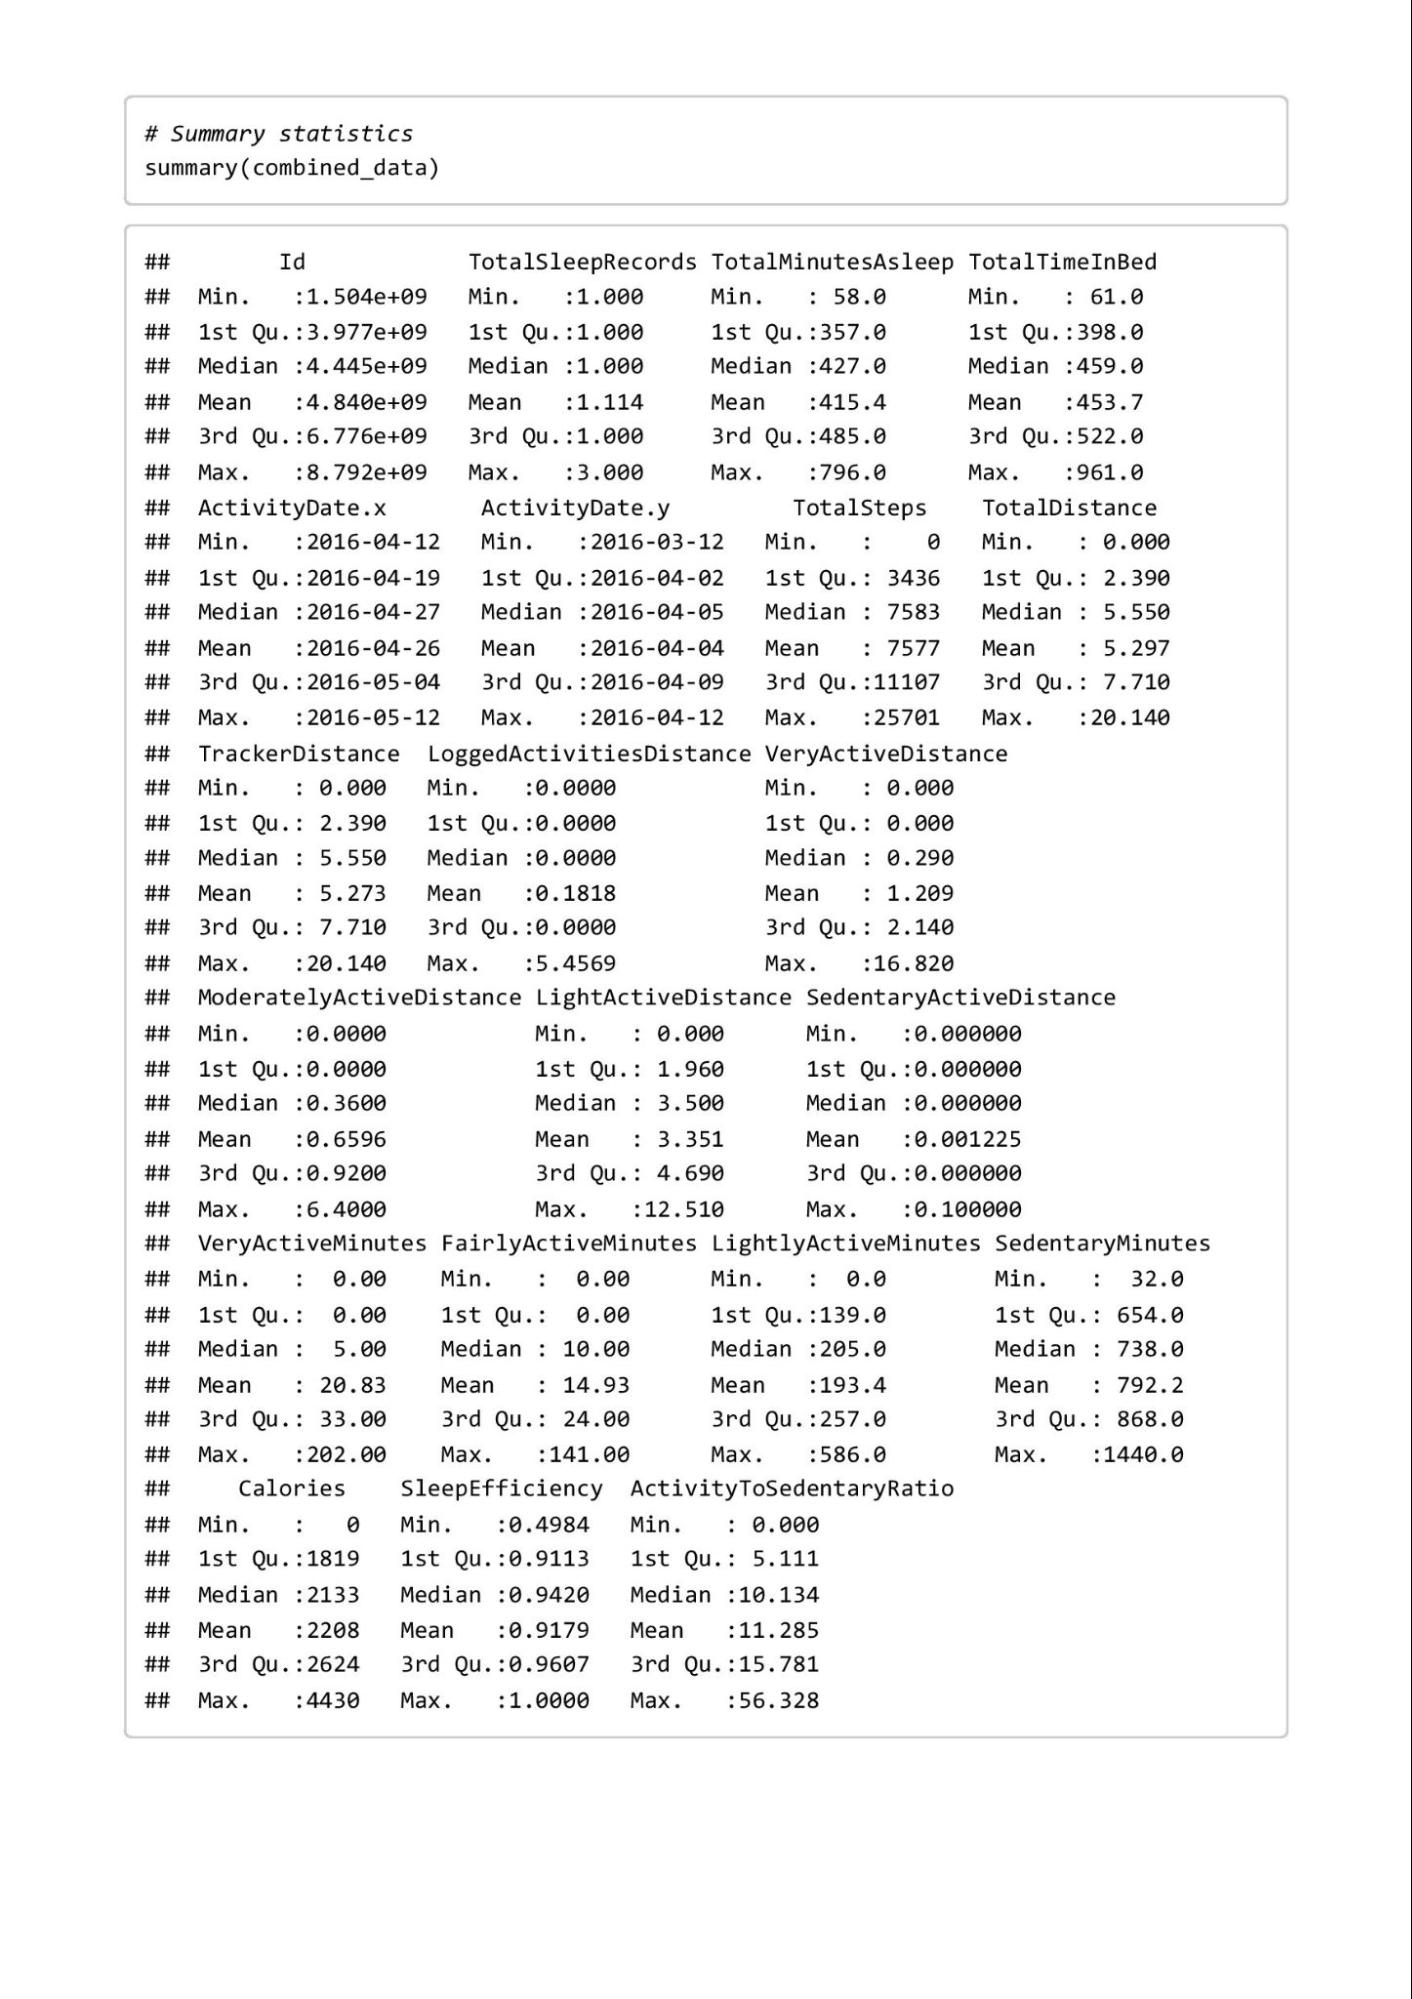
4. How can you verify that your data is clean and ready to analyze?- Summary statistics using summary(): Ensured no extreme anomalies and calculated central tendencies (mean, median).
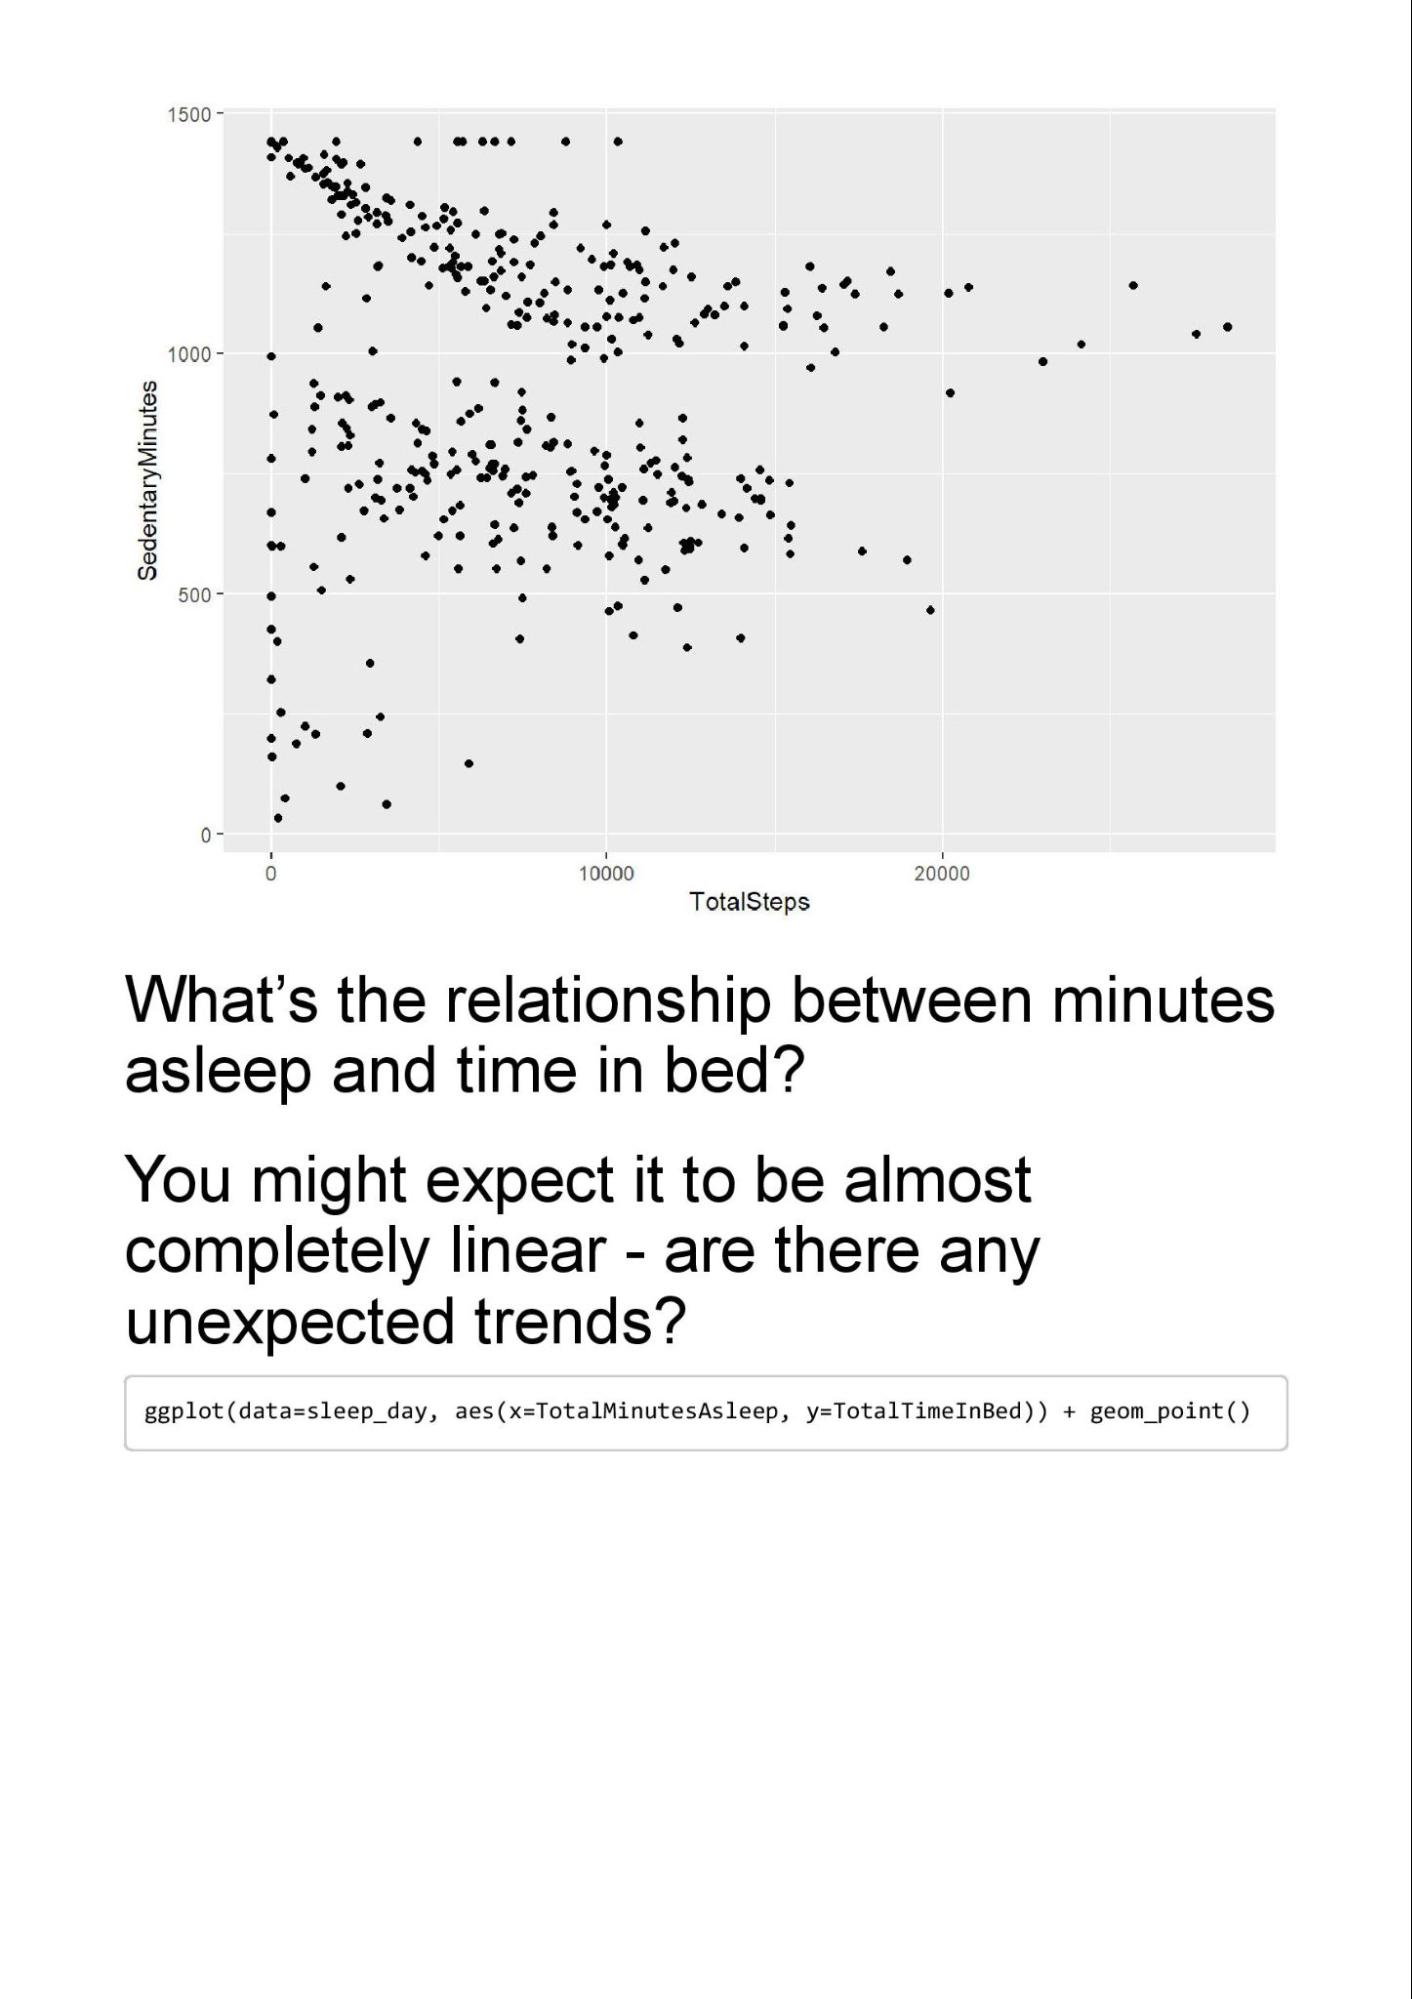
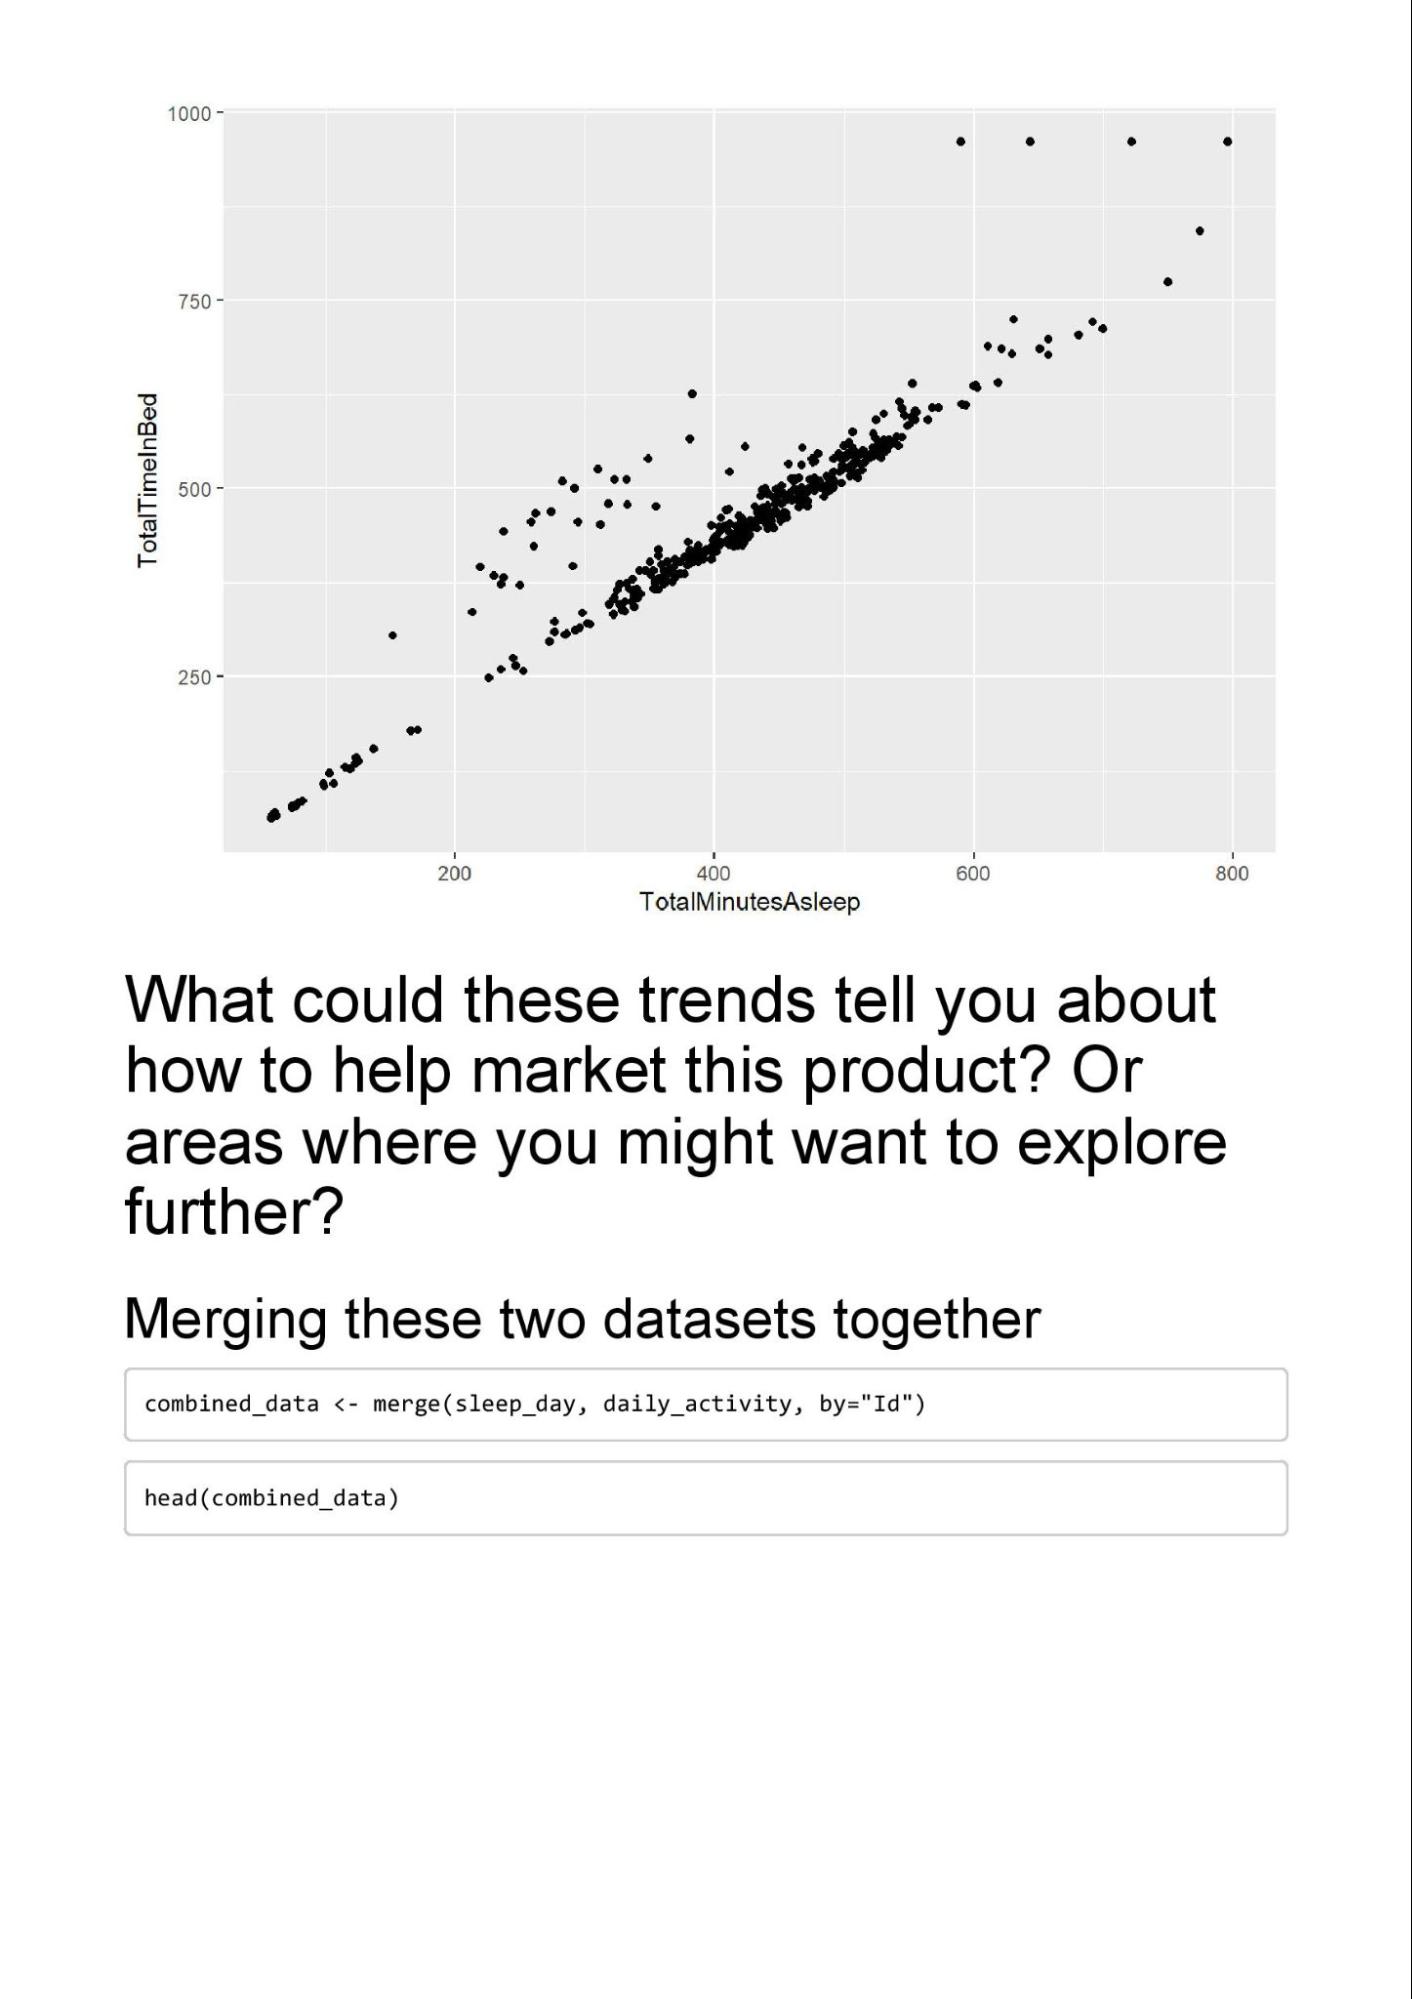
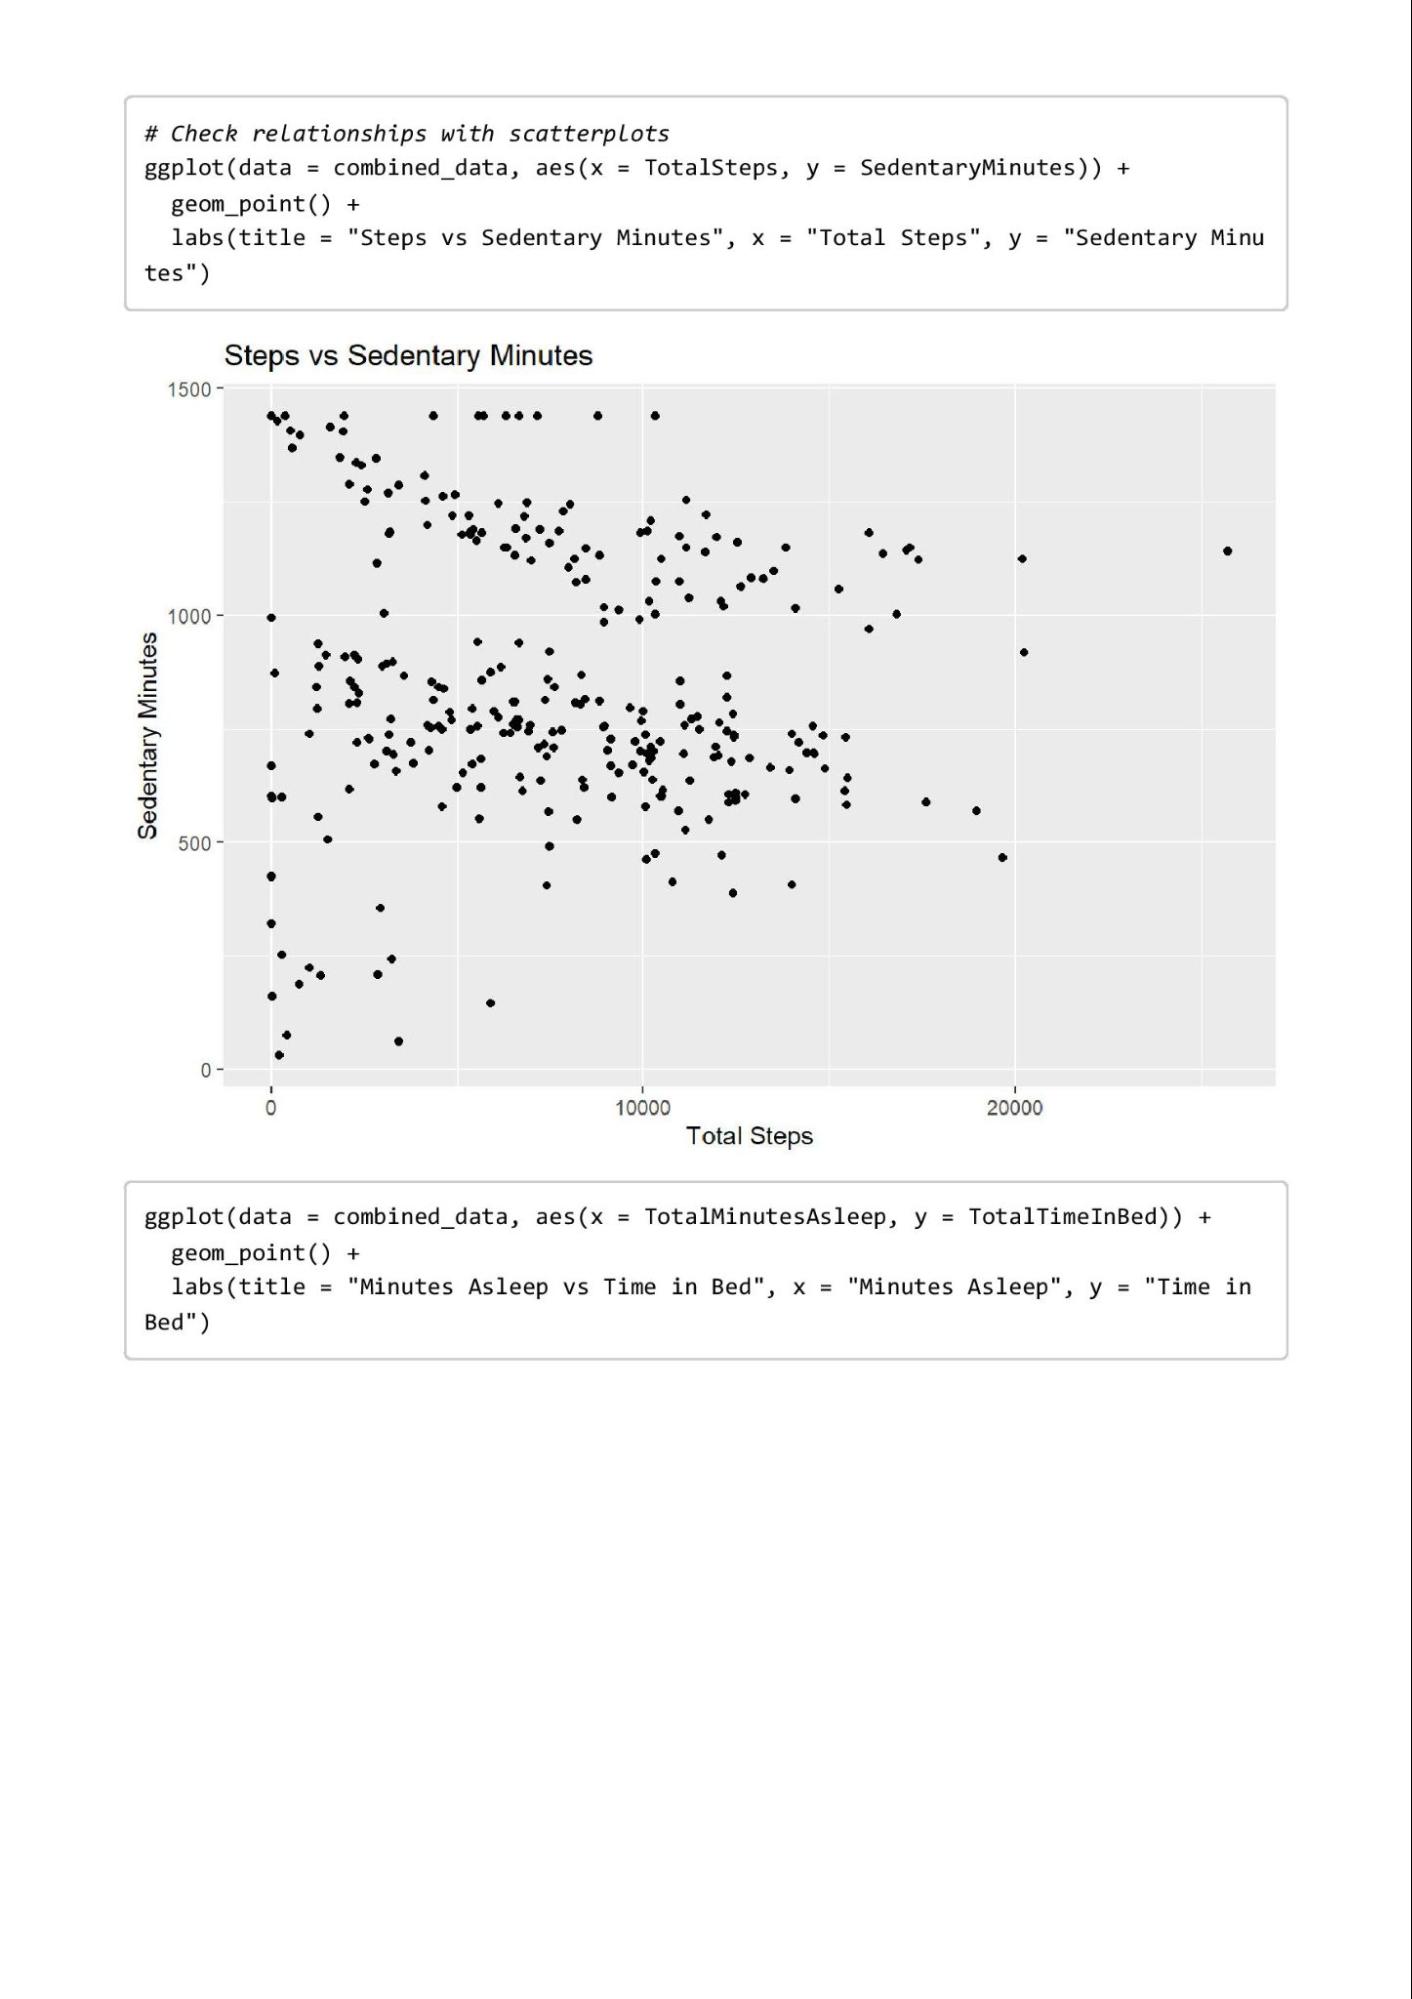
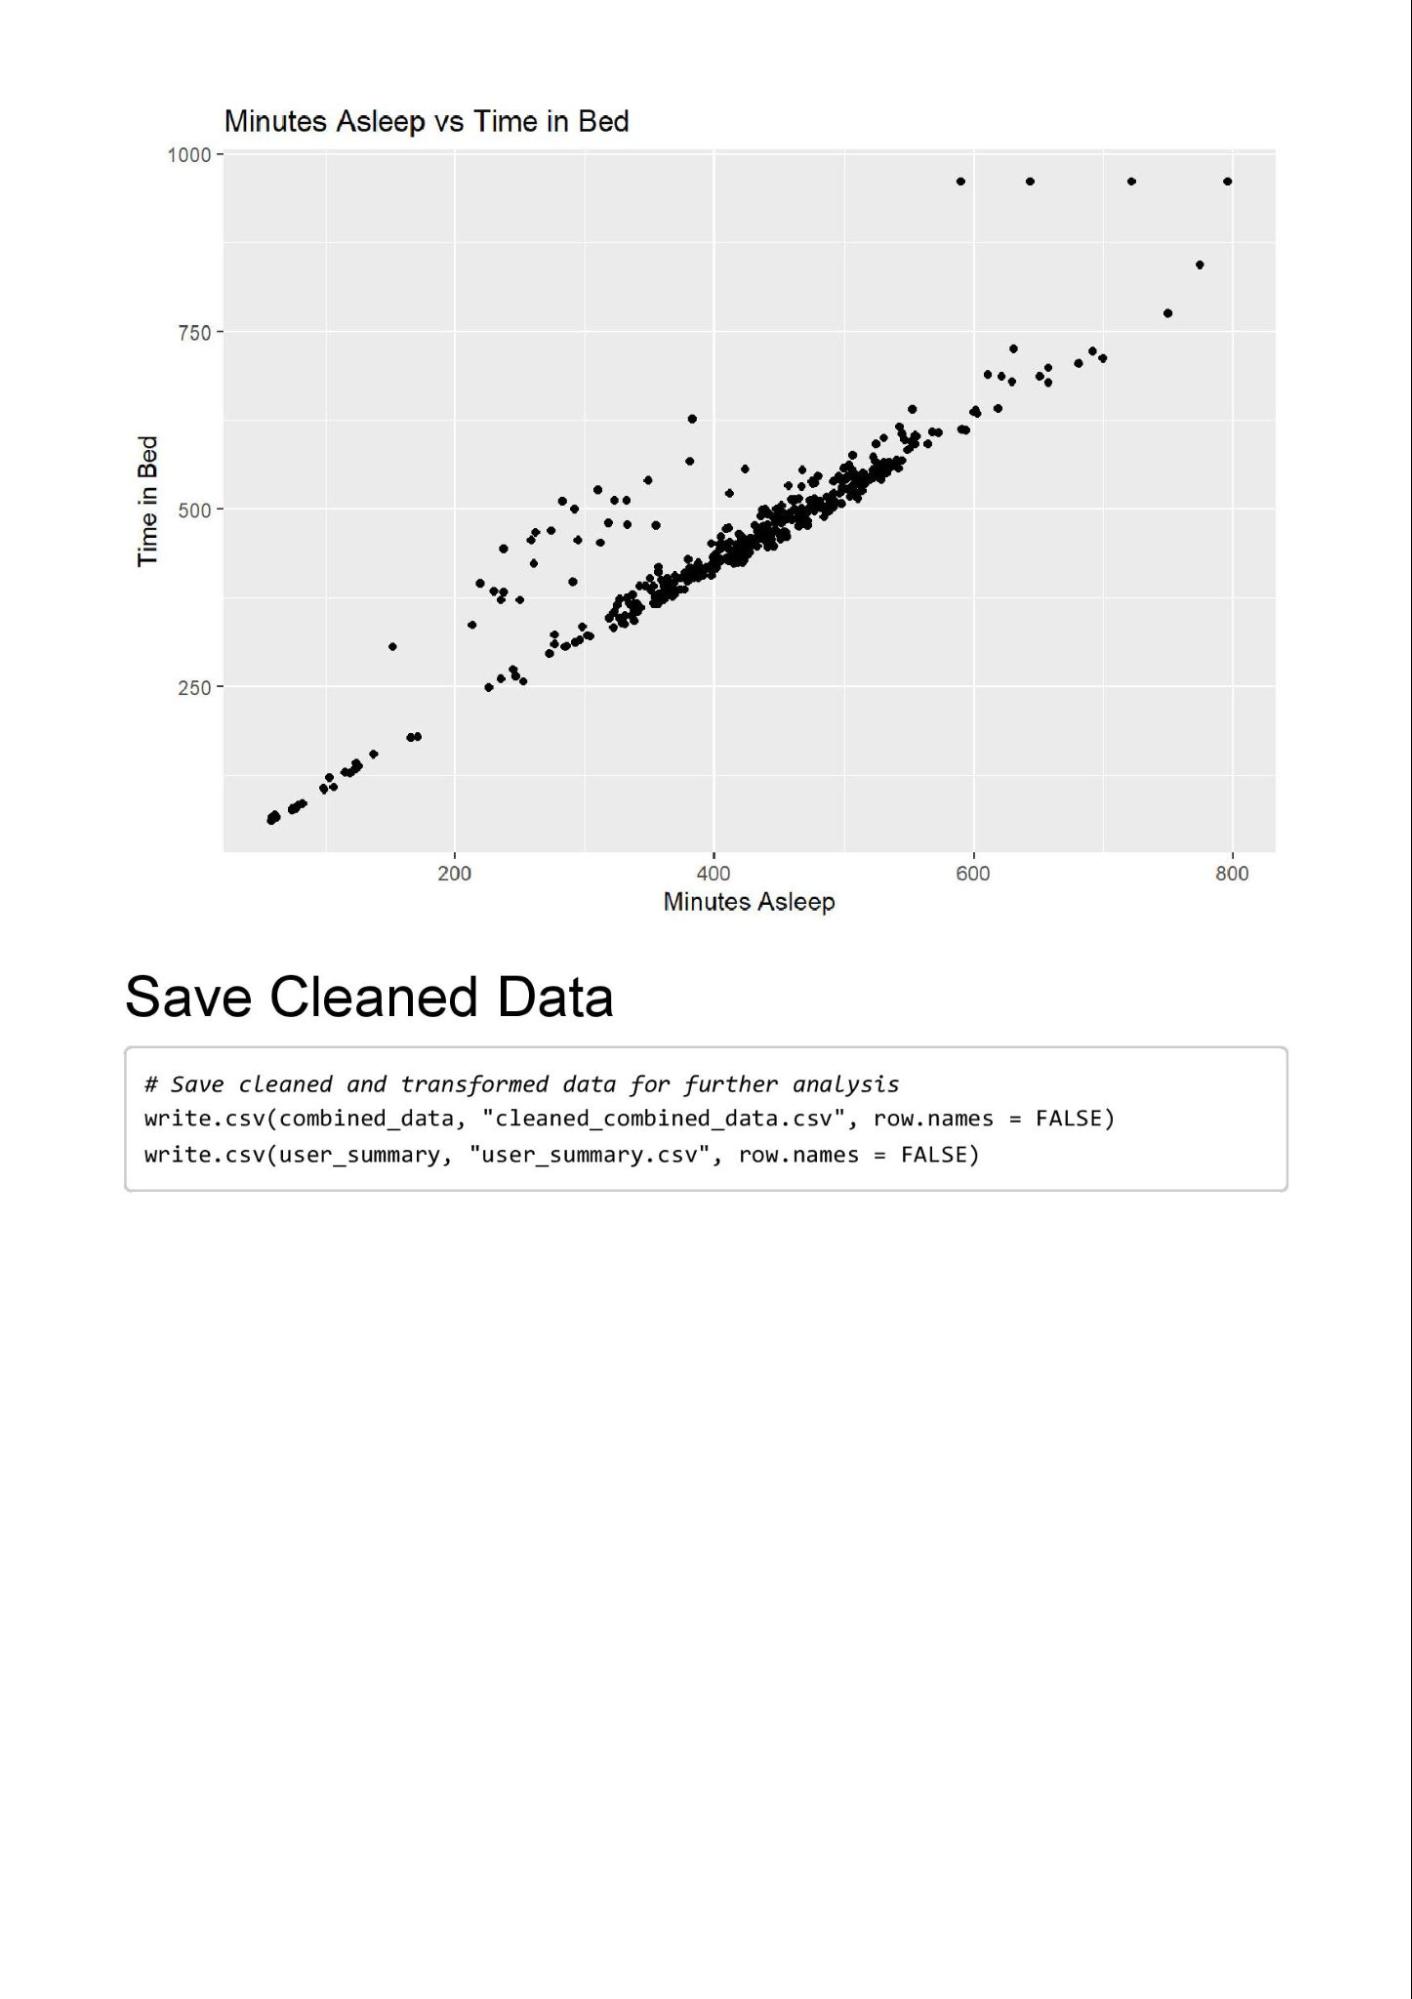
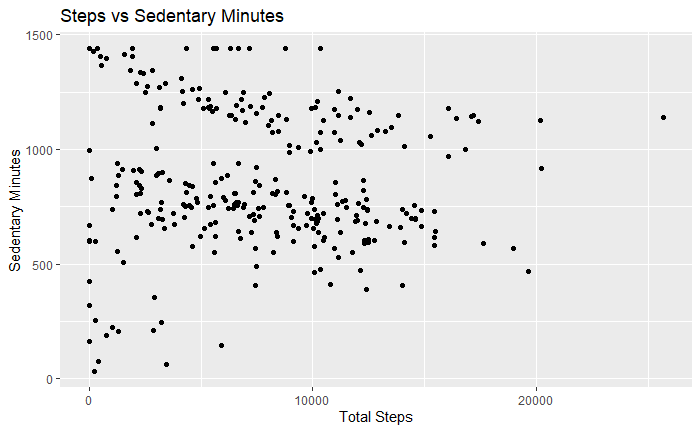
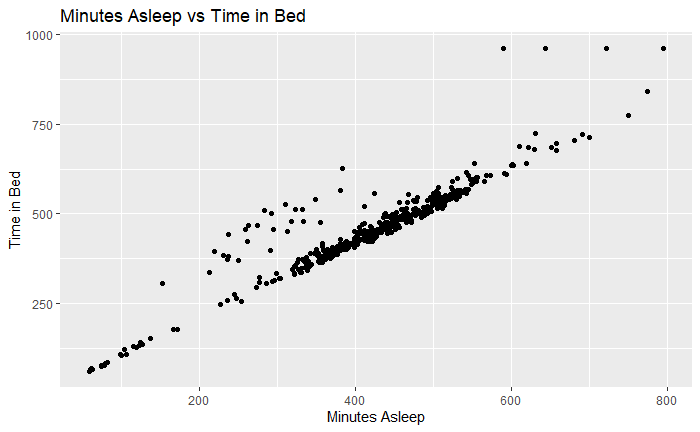
- Visual inspections: Scatterplots were created to identify trends or anomalies, such as:
- Relationship between TotalSteps and SedentaryMinutes.
- Relationship between TotalMinutesAsleep and TotalTimeInBed.
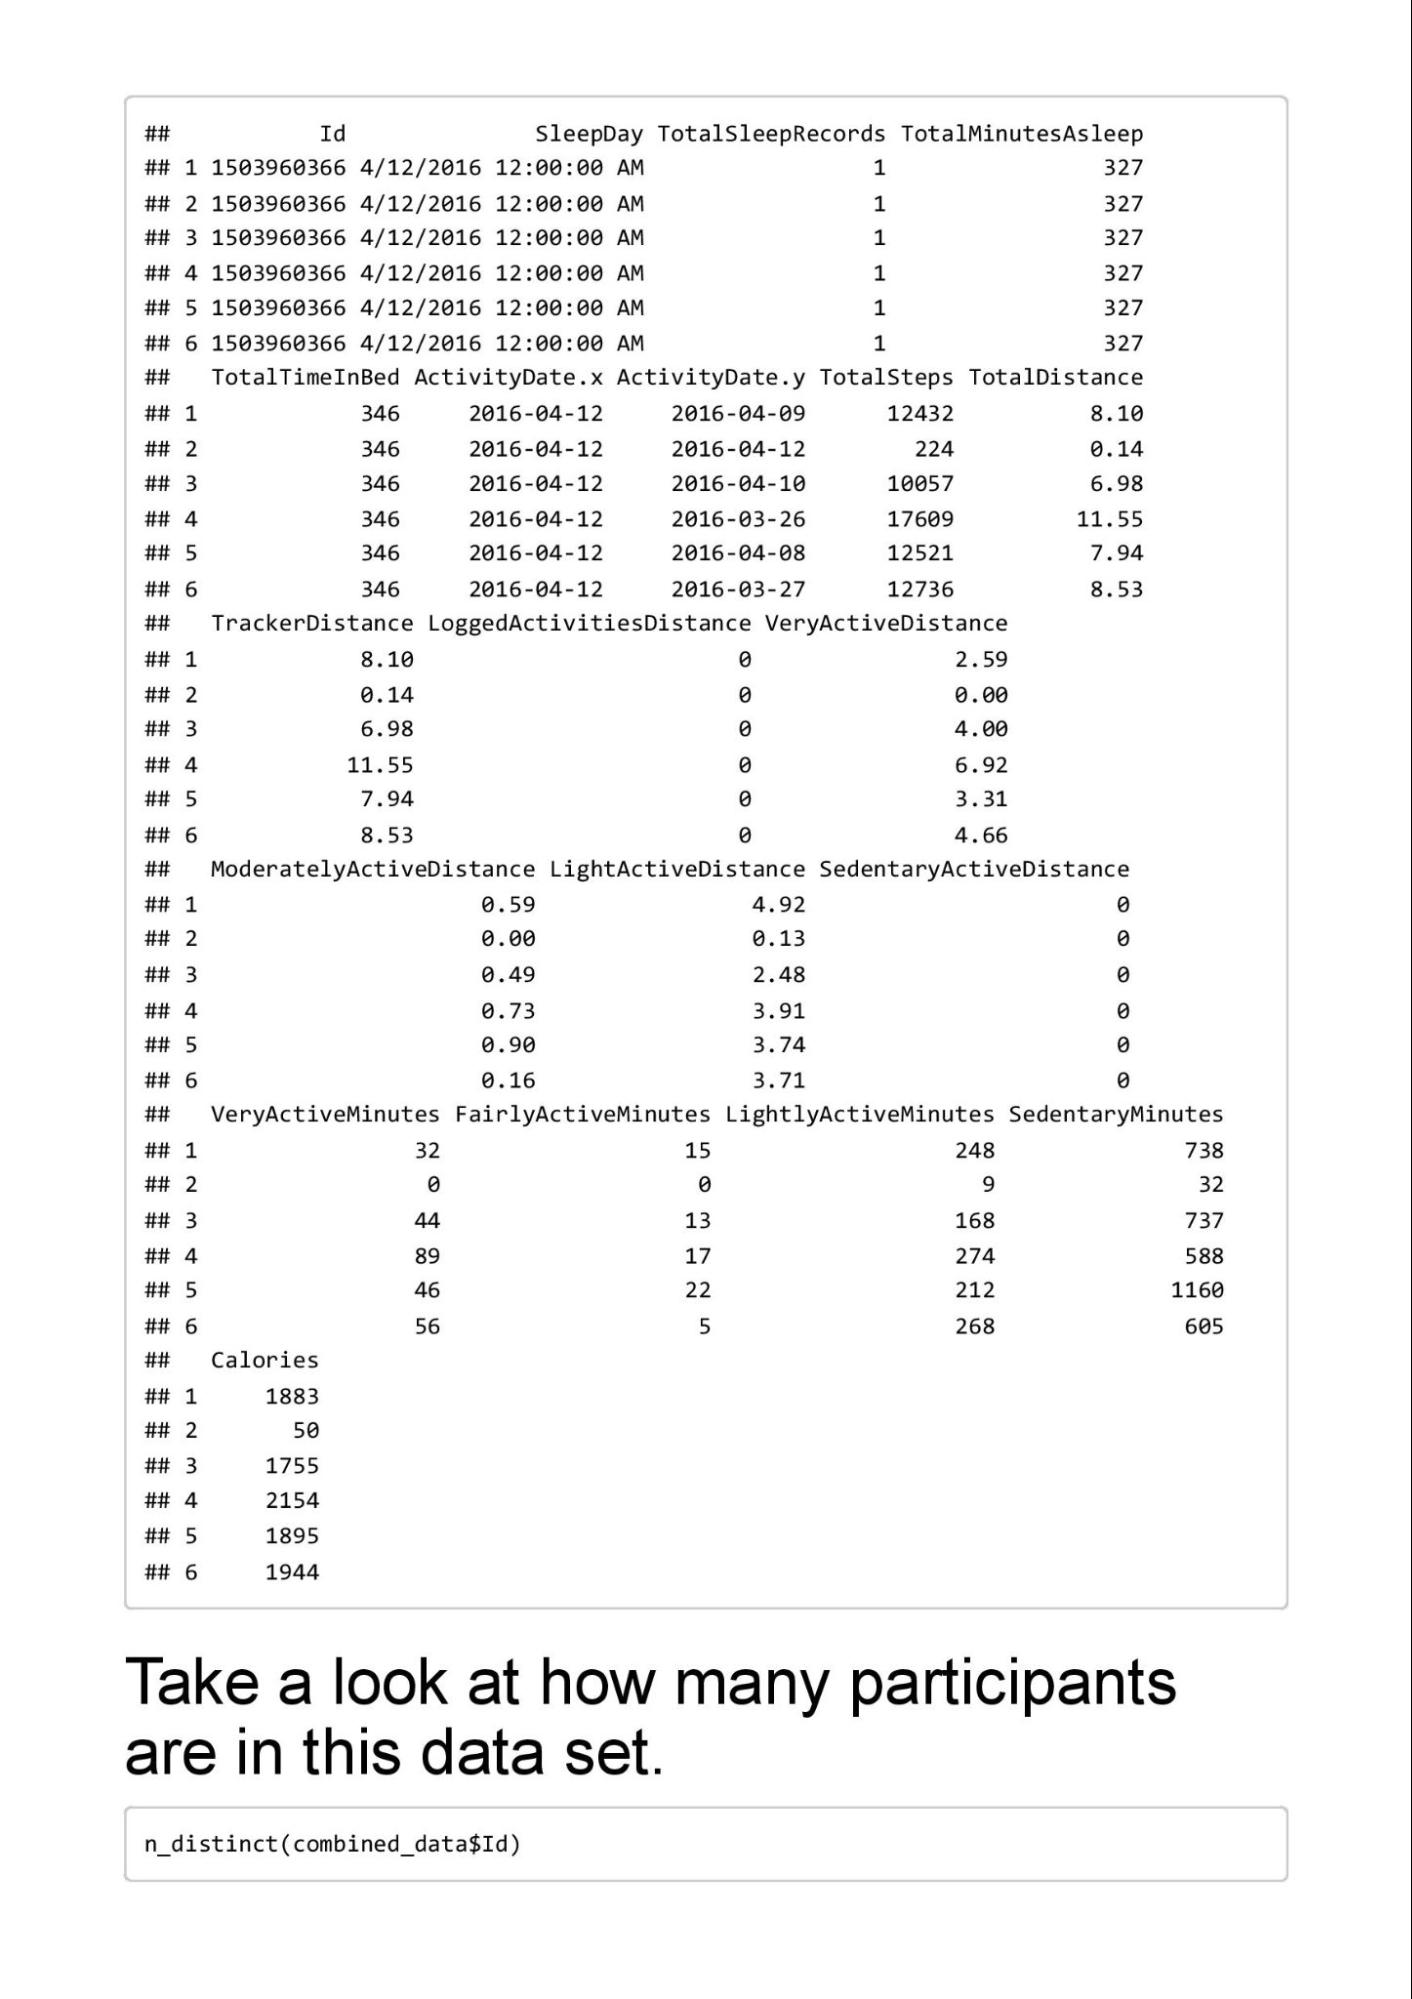
- Dataset merging: Merged datasets by Id and confirmed alignment of rows and columns.
5. Have you documented your cleaning process so you can review and share those results?- The entire process was documented in an R script, covering:
- Data import steps (read.csv()).
- Cleaning operations (e.g., distinct(), mutate() for derived metrics).
- Transformation logic, including derived metrics like:
- SleepEfficiency = TotalMinutesAsleep / TotalTimeInBed
- ActivityToSedentaryRatio = TotalSteps / SedentaryMinutes
- Export of cleaned datasets using write.csv().
Key Tasks- Check the data for errors:
- Missing values, duplicates, and data type mismatches were identified and resolved.
- Choose tools:
- tidyverse in R for robust cleaning and visualization.
- Transform the data:
- Calculated derived metrics (SleepEfficiency, ActivityToSedentaryRatio).
- Summarized metrics (e.g., average steps and sleep efficiency by user).
- Document the cleaning process:
- All steps are logged in the below document for reproducibility and sharing.
Data Cleaning and Manipulation DocumentationTools Used- Libraries: tidyverse for data manipulation and visualization.
Steps Taken to Clean and Prepare the Data1. Data Import- Loaded daily_activity and sleep_day datasets using read.csv().
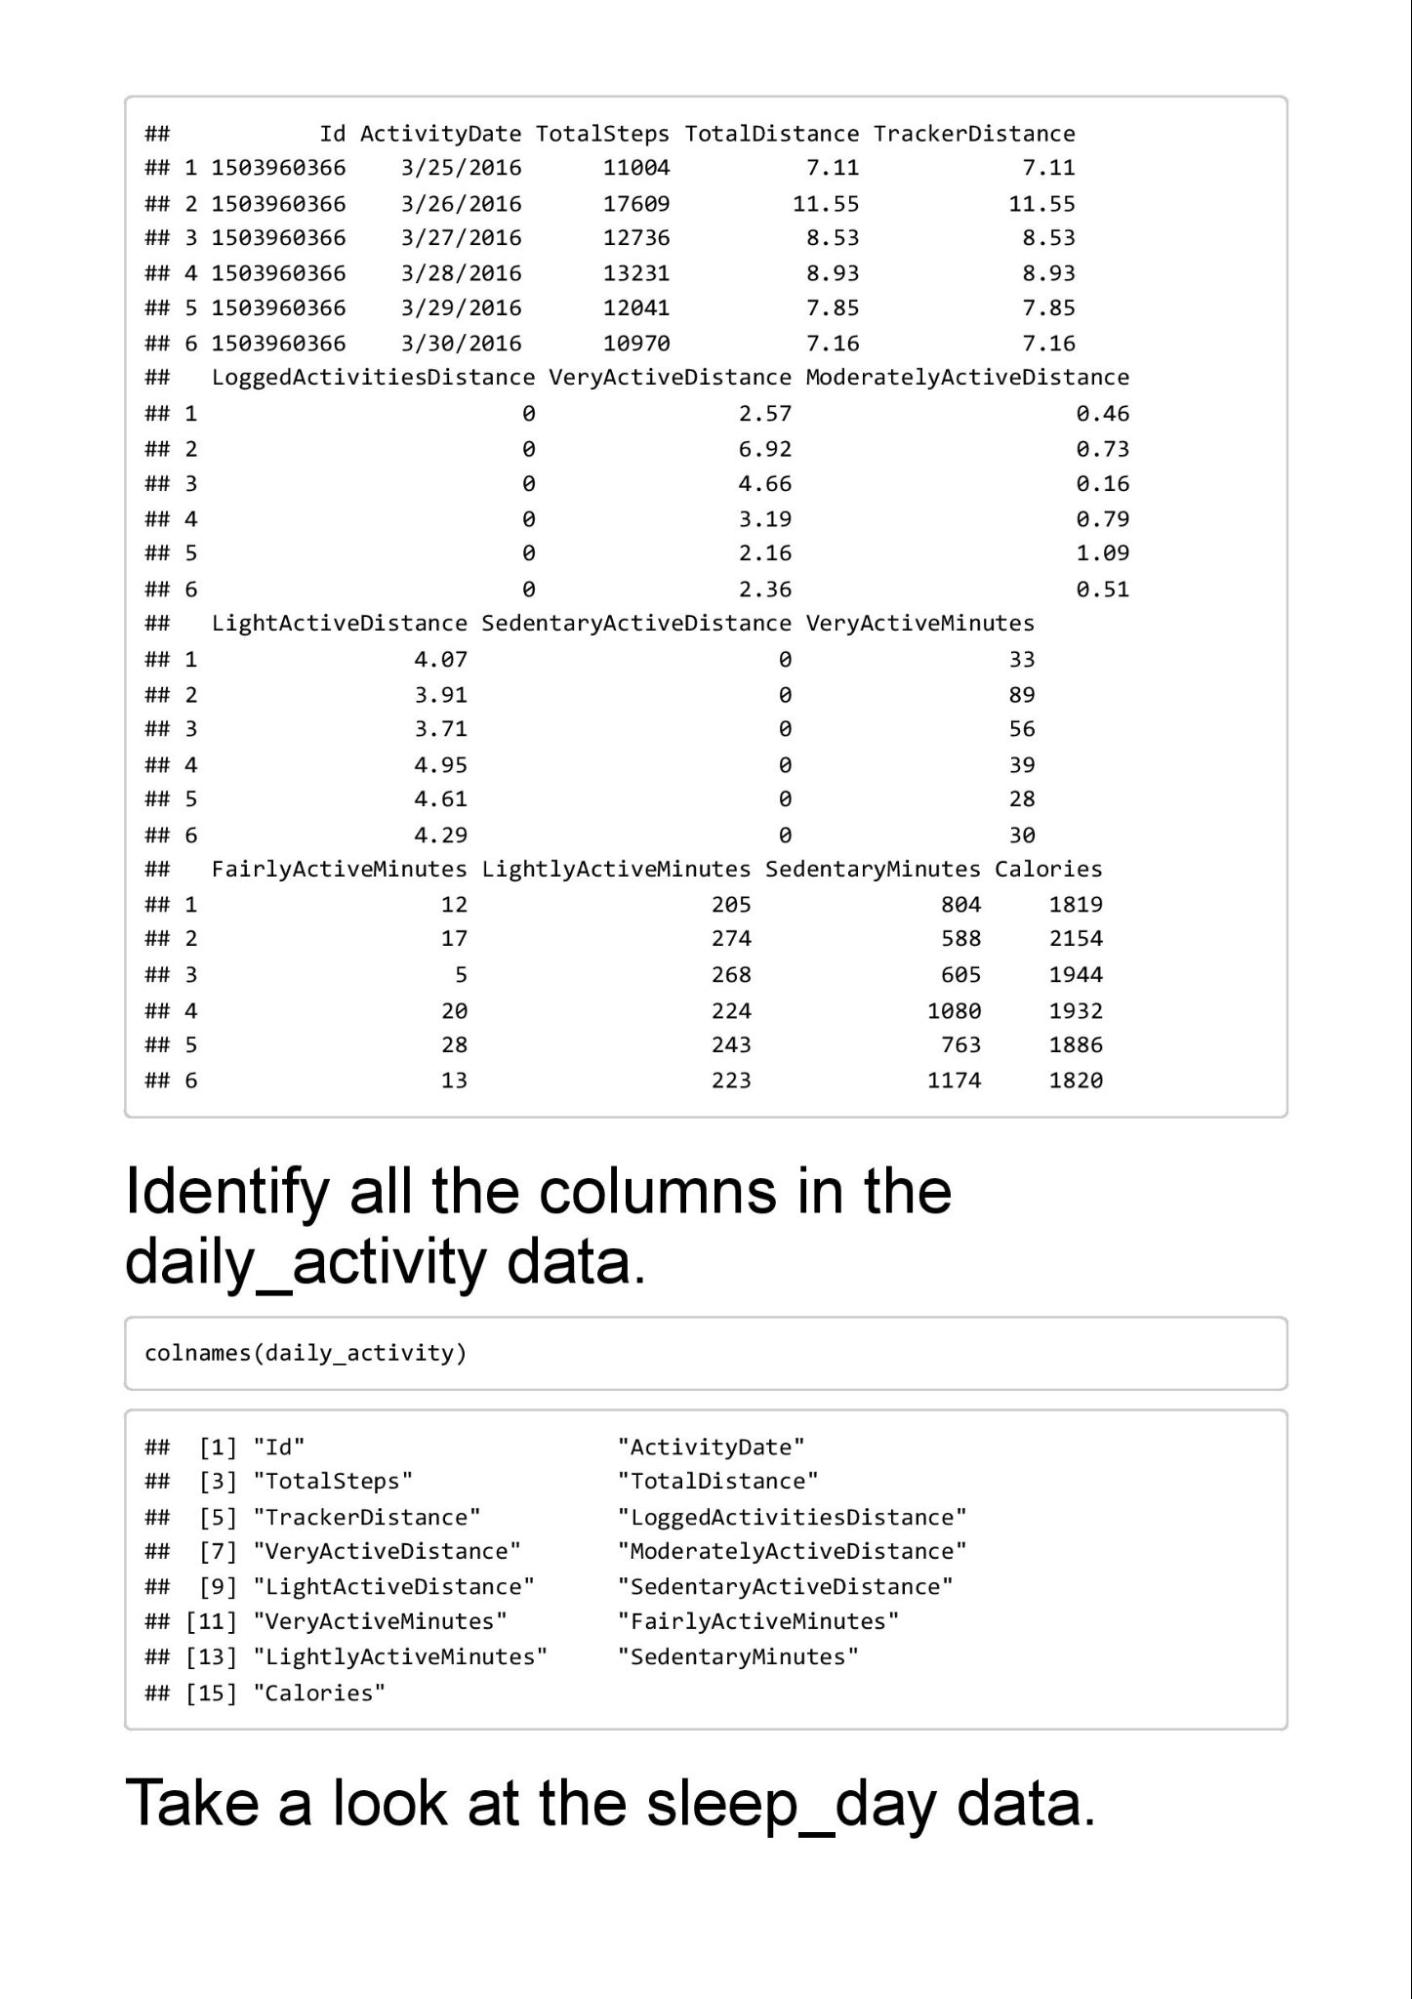
2. Initial Exploration- Explored datasets to understand structure and contents:
- Used head() to preview the first few rows.
- Listed column names with colnames().
- Verified data types using str().
3. Checking for Missing Data- Verified the presence of missing values in both datasets using sum(is.na()).
- Result: No missing values found.
4. Removing Duplicates- Checked for duplicate rows using distinct().
- Removed duplicate rows from both datasets:
- daily_activity <- daily_activity %>% distinct()
- sleep_day <- sleep_day %>% distinct()
5. Ensuring Consistent Date Formatting- Reformatted dates to ensure consistency:
- daily_activity$ActivityDate <- as.Date(daily_activity$ActivityDate, format = "%m/%d/%Y")
- sleep_day$ActivityDate <- as.Date(sleep_day$SleepDay, format = "%m/%d/%Y")
6. Alignment of Column Data Types- Verified column data types and ensured alignment using str().
7. Filtering Invalid or Extreme Values- Removed rows with invalid or extreme outlier values:
- Ensured all values in TotalSteps, TotalMinutesAsleep, and SedentaryMinutes were ≥ 0.
- Used filter() to retain only valid data.
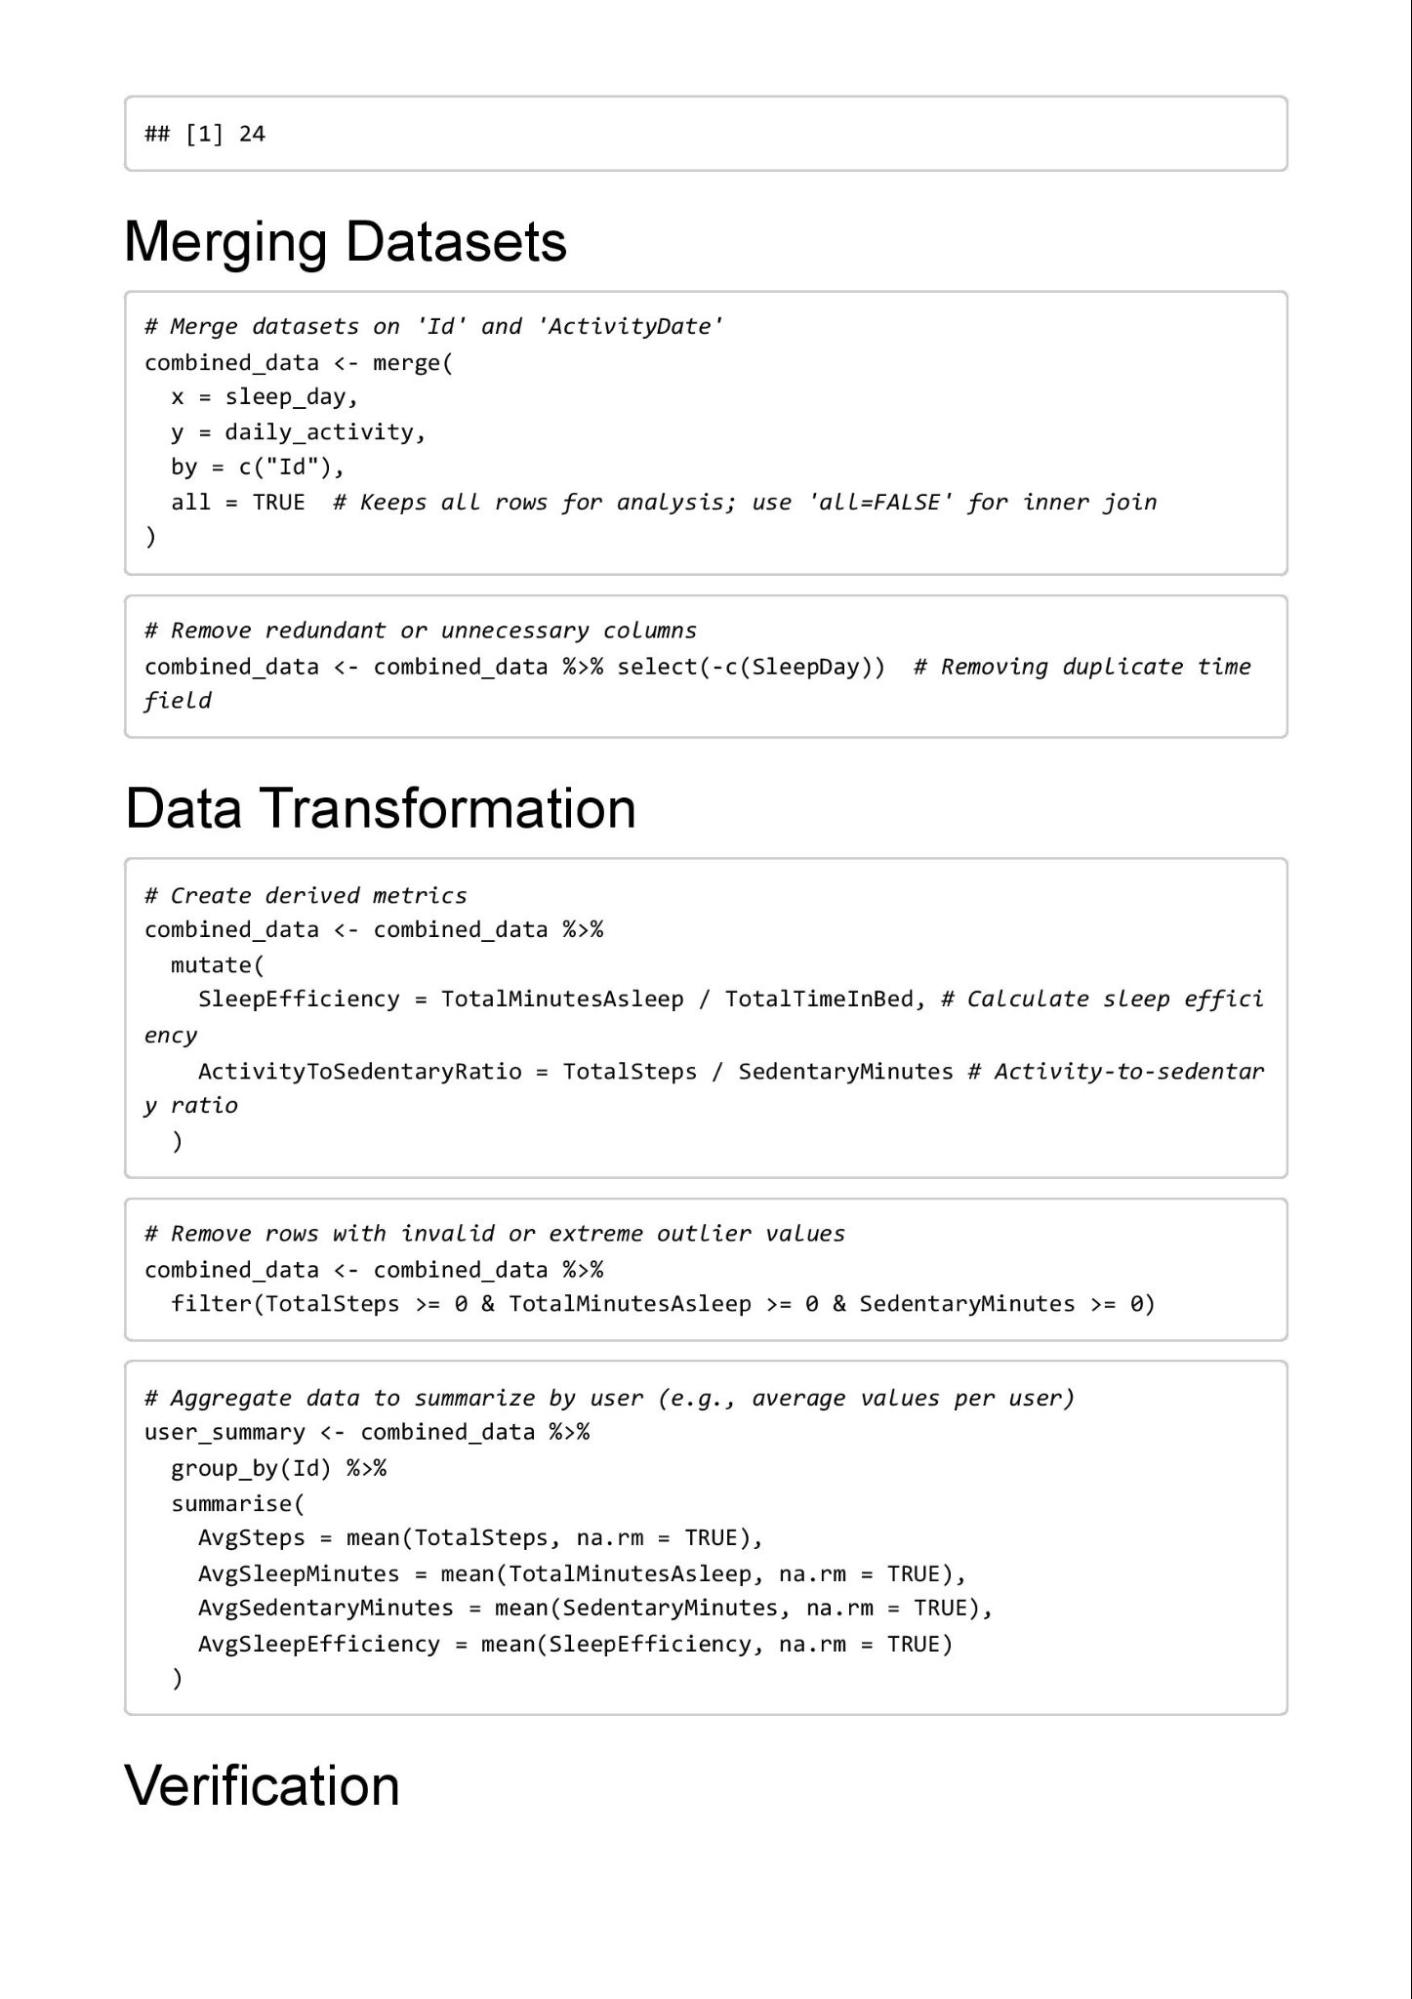
8. Merging Datasets- Merged daily_activity and sleep_day datasets on Id and ActivityDate using merge():
- combined_data <- merge(sleep_day, daily_activity, by="Id")
9. Removing Redundant Columns- Dropped unnecessary columns, such as SleepDay, after merging datasets:
- combined_data <- combined_data %>% select(-c(SleepDay))
10. Derived Metrics- Created new metrics to enhance analysis:
- Sleep Efficiency: SleepEfficiency = TotalMinutesAsleep / TotalTimeInBed
- Activity-to-Sedentary Ratio: ActivityToSedentaryRatio = TotalSteps / SedentaryMinutes
11. Summarization by User- Aggregated data to calculate average values per user:
- user_summary <- combined_data %>% group_by(Id) %>% summarise(AvgSteps = mean(TotalSteps, na.rm = TRUE), AvgSleepMinutes = mean(TotalMinutesAsleep, na.rm = TRUE), AvgSedentaryMinutes = mean(SedentaryMinutes, na.rm = TRUE), AvgSleepEfficiency = mean(SleepEfficiency, na.rm = TRUE))
12. Verification- Verified cleaned data using summary statistics:
- summary(combined_data) provided min, max, mean, and median values for key metrics.
- Visualized relationships to confirm data consistency:
- Scatterplots: TotalSteps vs. SedentaryMinutes, TotalMinutesAsleep vs. TotalTimeInBed.
13. Saving Cleaned Data- Exported cleaned datasets for further analysis:
- Combined data: write.csv(combined_data, "cleaned_combined_data.csv", row.names = FALSE)
- User summary: write.csv(user_summary, "user_summary.csv", row.names = FALSE)
SummaryThe cleaning and manipulation process ensured the dataset’s integrity and consistency, enabling accurate analysis of consumer trends. Key steps included handling duplicates, aligning data formats, creating derived metrics, and verifying the results through visual and statistical checks. The cleaned and transformed data is now ready for insightful analysis to support Bellabeat’s marketing strategy. |
Analyze
Now that your data is stored appropriately and has been prepared for analysis, start putting it to work. Use the following Case Study Roadmap as a guide:
Case Study Roadmap - Analyze Guiding questions
- How should you organize your data to pefiorm analysis on it?
- Has your data been properly formatted?
- What surprises did you discover in the data?
- What trends or relationships did you find in the data?
- How will these insights help answer your business questions?
Key tasks
- Aggregate your data so it’s useful and accessible.
- Organize and format your data.
- Pefiorm calculations.
- Identify trends and relationships.
Deliverable
A summary of your analysis
Follow these steps for using SQL
Here is a sample script that can help you do the following:
To use the sample script, click this link and select “Use Template.”
- Import your data.
- Explore your data, perhaps looking at the total number of rows, distinct values, maximum, minimum, or mean values.
- Where relevant, use JOIN statements to combine your relevant data into different tables based upon the needs of your analyses.
- Create summary statistics.
- Investigate interesting trends and save that information to a table.
To get started in R
Open your preferred version of R, click this link, and select “Use template.” Then, copy and paste the text from the template into an R script.
- Begin importing your data.
- Explore your data, gathering some summary statistics
- Clean and transform your data to prepare for analysis
- Create some initial exploratory visualizations
Analysis SummaryGuiding Questions and Responses- How should you organize your data to perform analysis on it?
- The data was organized into two key datasets:
- Combined Dataset: Includes merged daily activity and sleep data, enriched with derived metrics like SleepEfficiency and ActivityToSedentaryRatio.
- User Summary Dataset: Aggregated metrics per user, such as average steps, average sleep minutes, and average sedentary minutes.
- Both datasets were structured to allow easy filtering and grouping for insights at individual and aggregate levels.
- Has your data been properly formatted?
- Yes, the data was properly formatted:
- Dates were consistently reformatted as YYYY-MM-DD.
- Numerical columns were validated to ensure all values were non-negative.
- Derived metrics were calculated for enhanced analysis.
- Columns irrelevant to the analysis, such as redundant date fields, were removed.
- What surprises did you discover in the data?
- A significant proportion of participants had low activity levels, with some reporting fewer than 1,000 steps on certain days, indicating potential sedentary behavior.
- Sleep patterns showed inefficiencies: while participants spent considerable time in bed, a notable portion had SleepEfficiency below 90%.
- There was an inverse relationship between high sedentary minutes and total steps, suggesting limited activity on days with prolonged inactivity.
- What trends or relationships did you find in the data?
- Users with higher total steps generally had fewer sedentary minutes.
- Lightly active minutes contributed significantly to total activity, while very active minutes were minimal for most participants.
- Sleep duration correlated strongly with TotalTimeInBed, but inefficiencies were observed in some cases where participants spent longer in bed but achieved less sleep.
- Median SleepEfficiency was around 94%, but some outliers indicated inefficiencies below 70%.
- Participants with balanced activity and sleep routines displayed higher overall health indicators (e.g., fewer sedentary minutes and higher SleepEfficiency).
- How will these insights help answer your business questions?
- Understanding Usage Trends: Insights into user activity and sleep behaviors help identify key customer segments (e.g., active users versus sedentary users).
- Product Enhancement: Sleep inefficiencies and low activity levels suggest opportunities to design features that encourage movement and improve sleep quality.
- Marketing Strategy: Trends highlight potential messaging strategies:
- Promote Bellabeat products as tools for improving daily activity and achieving better sleep routines.
- Target messaging to different segments (e.g., sedentary individuals or those with inefficient sleep habits).
Key Tasks- Aggregate Data:
- Grouped and summarized metrics at the user level using group_by() and summarise() in R.
- Calculated averages for steps, sedentary minutes, and sleep efficiency.
- Organize and Format Data:
- Ensured uniform column naming, date formatting, and data type consistency.
- Perform Calculations:
- SleepEfficiency = TotalMinutesAsleep / TotalTimeInBed
- ActivityToSedentaryRatio = TotalSteps / SedentaryMinutes
- Conducted statistical summaries and visualized relationships using scatterplots.
- Identify Trends and Relationships:
- Discovered patterns correlating activity and sedentary minutes, and sleep duration and efficiency.
Deliverable: Summary of Analysis- The analysis revealed that many users exhibit sedentary behavior and experience suboptimal sleep efficiency, highlighting areas where Bellabeat’s products can provide value.
- These findings will inform marketing strategies tailored to user segments and product improvements to address user challenges.
|
Share
Once you have completed your analysis, create your data visualizations. The visualizations should clearly communicate your high-level insights and recommendations. Use the following Case Study Roadmap as a guide:
Case Study Roadmap - Share
Guiding questions
- Were you able to answer the business questions?
- What story does your data tell?
- How do your findings relate to your original question?
- Who is your audience? What is the best way to communicate with them?
- Can data visualization help you share your findings?
- Is your presentation accessible to your audience?
Key tasks
- Determine the best way to share your findings.
- Create effective data visualizations.
- Present your findings.
- Ensure your work is accessible.
Deliverable
Suppofiing visualizations and key findings
Follow these steps:
1. Take out a piece of paper and a pen and sketch some ideas for how you will visualize the data.
2. Once you choose a visual form, open your tool of choice to create your visualization. Use a presentation sohware, such as PowerPoint or Google Slides; your spreadsheet program; Tableau; or R.
- Create your data visualization, remembering that contrast should be used to draw your audience’s attention to the most important insights. Use artistic principles including size, color, and shape.
- Ensure clear meaning through the proper use of common elements, such as headlines, subtitles, and labels.
- Refine your data visualization by applying deep attention to detail.
Sharing Insights: Supporting Visualizations and Key FindingsGuiding Questions and Responses- Were you able to answer the business questions?
- Yes, the analysis provided actionable insights into user trends for activity, sleep, and sedentary behavior. These findings can inform Bellabeat’s product development and marketing strategies.
- What story does your data tell?
- Activity: Users exhibit a wide range of activity levels. A significant portion has low activity levels, which Bellabeat products can address by encouraging movement through reminders or gamification features.
- Sleep: While most users have good sleep efficiency (~94%), a subset experiences inefficiencies, indicating a need for features to monitor and improve sleep patterns.
- Combined Insight: Active users tend to have higher engagement and better overall wellness indicators, while sedentary users and those with poor sleep habits present opportunities for targeted marketing and product enhancements.
- How do your findings relate to your original question?
- The findings align with the objective to understand smart device usage patterns. They provide insights into trends and behaviors that can shape Bellabeat’s marketing strategy and product positioning.
- Who is your audience? What is the best way to communicate with them?
- Audience: Bellabeat executive team, including Urška Sršen and Sando Mur.
- Communication Strategy: A combination of clear visualizations and concise explanations tailored to business decision-makers. The focus is on actionable insights rather than technical details.
- Can data visualization help you share your findings?
- Yes, visualizations like scatterplots, bar charts, and trend lines effectively highlight relationships, trends, and areas of focus.
- Is your presentation accessible to your audience?
- Visuals and text are designed to be clear, concise, and jargon-free. Key points are highlighted, and supporting data is simplified for easy comprehension.
Key Tasks- Determine the Best Way to Share Findings:
- Develop a slide deck with visualizations and summaries for Bellabeat’s executive team.
- Include clear explanations of insights and recommendations.
- Create Effective Data Visualizations:
- Activity Trends: A bar chart showing average steps across users to highlight varying activity levels.
- Sleep Patterns: A scatterplot displaying TotalMinutesAsleep vs. TotalTimeInBed with a trend line to emphasize sleep efficiency.
- Combined Analysis: A clustered bar chart comparing average SedentaryMinutes and LightlyActiveMinutes across user segments.
- Present Findings:
- Use visual aids to narrate the data’s story.
- Highlight key insights, such as low activity among users, sleep inefficiencies, and correlations between activity and wellness.
- Ensure Accessibility:
- Use contrasting colors and large, legible fonts.
- Provide textual descriptions alongside charts for clarity.
Deliverable: Visualizations and Key Findings
Summary of Recommendations- Target Marketing: Focus on segments with low activity and poor sleep efficiency. Emphasize how Bellabeat products can improve these areas.
- Product Features: Introduce tools for activity encouragement (e.g., reminders, gamification) and sleep improvement (e.g., guided relaxation, analytics).
- Positioning: Promote Bellabeat as a comprehensive wellness solution, leveraging the insights to address pain points for users.
|
Act
Now that you have finished creating your visualizations, act on your findings. Prepare the deliverables you have been asked to create, including the high-level recommendations based on your analysis. Use the following Case Study Roadmap as a guide:
Case Study Roadmap - Act
Guiding questions
- What is your final conclusion based on your analysis?
- How could your team and business apply your insights?
- What next steps would you or your stakeholders take based on your findings?
- Is there additional data you could use to expand on your findings?
Key tasks
- Create your pofifolio.
- Add your case study.
- Practice presenting your case study to a friend or family member.
Deliverable
Your top high-level insights based on your analysis
Follow these steps:
- If you do not have one already, create an online pofifolio. (Use Build a Pofifolio with Google Sites.)
- Consider how you want to feature your case study in your pofifolio.
- Upload or link your case study findings to your pofifolio.
- Write a brief paragraph describing the case study, your process, and your discoveries.
- Add the paragraph to introduce your case study in your pofifolio.
High-Level Insights and RecommendationsGuiding Questions and Responses- What is your final conclusion based on your analysis?
Bellabeat can significantly improve its market reach by leveraging insights into user activity and sleep patterns:
- Activity Insights: A substantial portion of users exhibit low activity levels, with high sedentary minutes. Bellabeat’s products can target these users by encouraging movement through personalized reminders or challenges.
- Sleep Insights: Although most users have good sleep efficiency, a subset experiences inefficiencies. This presents an opportunity to promote Bellabeat as a solution for improving sleep quality.
- Combined Insights: Users with balanced activity and sleep routines tend to have better overall wellness, making them a key demographic for retention-focused strategies.
- How could your team and business apply your insights?
- Marketing Strategy: Develop targeted campaigns highlighting the benefits of Bellabeat products in improving activity levels and sleep quality.
- Product Development: Enhance features in the Bellabeat app to include:
- Activity challenges and gamification for low-active users.
- Advanced sleep monitoring and personalized tips for improving efficiency.
- Customer Segmentation: Use data-driven segmentation to create personalized experiences for high-value user groups.
- What next steps would you or your stakeholders take based on your findings?
- Design marketing content aimed at sedentary users and those with poor sleep habits.
- Develop app updates that focus on actionable insights for activity and sleep.
- Collect and analyze more data to refine insights into user behavior.
- Track the effectiveness of new app features and marketing campaigns.
- Is there additional data you could use to expand on your findings?
- Data on nutrition and stress levels: This could complement activity and sleep data for a holistic wellness strategy.
- Demographic information: To better understand user preferences based on age, location, and lifestyle.
- Competitive data: Insights into how users engage with non-Bellabeat devices to identify competitive advantages.
Key High-Level Insights- Target Sedentary Users:
- Insight: Many users log high sedentary minutes with low daily steps.
Recommendation: Position Bellabeat products as tools to motivate movement and reduce inactivity.
- Enhance Sleep Monitoring Features:
- Insight: Some users spend significant time in bed but achieve suboptimal sleep efficiency.
Recommendation: Introduce advanced analytics and guided relaxation techniques in the app to improve sleep.
- Segmented Marketing Campaigns:
- Insight: Different user segments (active vs. sedentary, good sleepers vs. poor sleepers) have varying needs.
Recommendation: Use segmentation to tailor marketing efforts and personalized product suggestions.
- Retention Through Wellness Tracking:
- Insight: Active and balanced users are more likely to stay engaged with the app and products.
Recommendation: Develop loyalty programs or premium features that reward consistent usage and engagement.
Next Steps for Implementation- Portfolio Creation: Compile this case study into your portfolio, highlighting the data cleaning, analysis, and actionable recommendations.
- Practice Presentation: Prepare and practice presenting this case study to stakeholders, focusing on insights and their business implications.
- Continuous Improvement: Gather feedback on your findings and recommendations, iterating based on additional data and stakeholder needs.
|
Wrap-up
Congratulations on finishing the Bellabeat marketing analysis case study! If you like, complete one of the other case studies to continue growing your pofifolio. Or, use the steps from the ask, prepare, process, analyze, share, and act Case Study Roadmap to create a new project all your own. Best of luck on your job search!